
How to Map Lorry Traffic and Freight Corridors from Count Points
On this page
Problem statement
Freight in Britain moves by road, and the traffic count file records it link by link: heavy goods vehicles split into six axle classes at every major-road count point, every year. That is enough to map the freight network — which roads carry the most lorries, where lorries dominate the traffic, how far they travel in total — without any logistics data. The difficulty is choosing the measure: a lorry count picks out busy motorways, a lorry share picks out port roads with little other traffic, and lorry-kilometres weight both by length.
This page maps 2025 lorry traffic on Britain's major roads all three ways, separates long-distance articulated lorries from local rigid ones, and follows lorry and van travel since 2000.
Quick answer
Summarise each road by the median lorry count across its links, alongside the lorry share of its traffic and the articulated share of its lorries:
y = aadf[(aadf.year == 2025) & (aadf.road_type == "Major")].copy()
y["hgv_share"] = y.all_HGVs / y.all_motor_vehicles
y["artic"] = y[["HGVs_3_or_4_articulated_axle", "HGVs_5_articulated_axle", "HGVs_6_articulated_axle"]].sum(axis=1)
roads = y.groupby("road_name").agg(points=("count_point_id", "size"), hgv=("all_HGVs", "median"),
                                   share=("hgv_share", "median"), artic_share=("artic", "sum"), total_hgv=("all_HGVs", "sum"))
roads["artic_share"] = roads.artic_share / roads.total_hgv
print(roads[roads.points >= 10].sort_values("hgv", ascending=False).head(8).round(3).to_string())
points hgv share artic_share total_hgv
road_name
M62 51 14987.0 0.139 0.759 648909
M25 51 14318.0 0.103 0.701 780857
M1 97 12767.0 0.122 0.744 1177574
M18 12 12416.0 0.171 0.776 137816
M6 99 12334.0 0.135 0.754 1279023
M42 26 10210.0 0.112 0.737 226021
A74(M) 13 9156.0 0.232 0.831 115568
M5 55 8816.0 0.095 0.728 457873
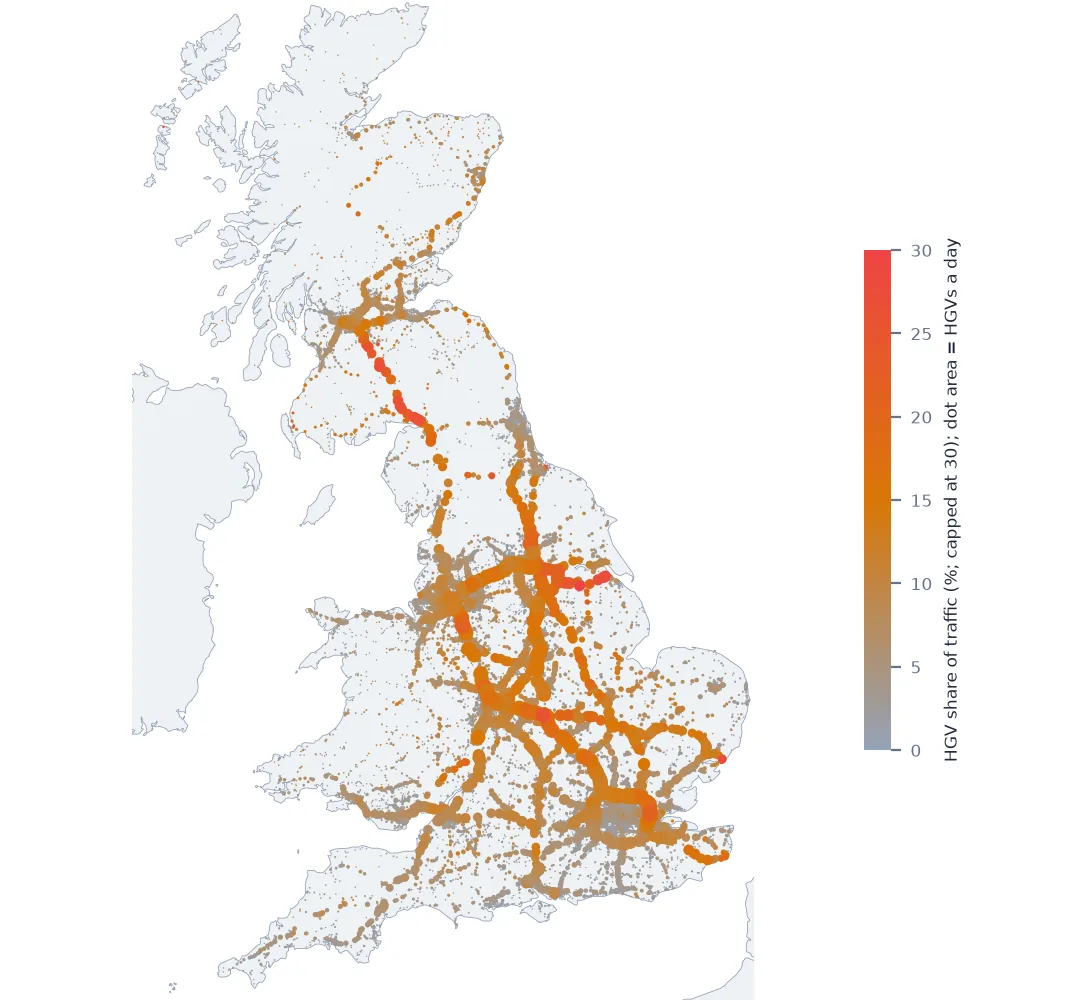
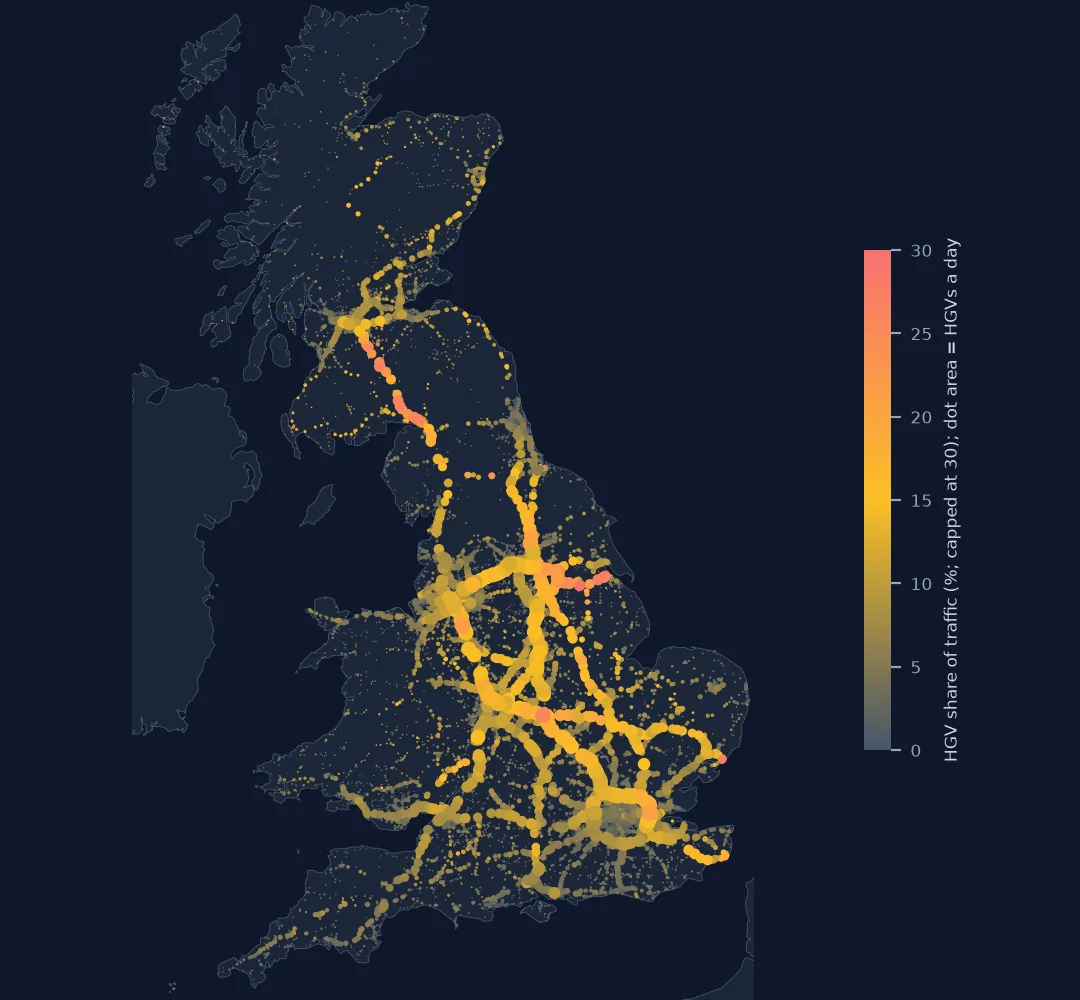
The M62 across the Pennines has the highest median lorry count of any road with ten or more count points, 14,987 a day, ahead of the M25, M1, M18 and M6. The A74(M) to Glasgow carries fewer lorries but has the highest share, 23.2% of its traffic, and the most articulated: 83.1% of its lorries. These are the trunk freight corridors.
Count, share and distance
1. Lorry counts and lorry shares
print(y.groupby("road_category").agg(median_hgv=("all_HGVs", "median"), median_share=("hgv_share", "median")).round(3).to_string())
print(f"correlation of HGV count and HGV share across links: {y.all_HGVs.corr(y.hgv_share, method='spearman'):.2f}")
median_hgv median_share
road_category
PA 283.0 0.023
PM 1463.0 0.025
TA 1284.5 0.059
TM 5933.0 0.089
correlation of HGV count and HGV share across links: 0.71
A median trunk motorway link carries 5,933 lorries a day, 8.9% of its traffic; a median principal A road 283, 2.3%. Across links the lorry count and the lorry share rise together (rank correlation 0.71), but not in step: the share is what distinguishes freight roads from merely busy ones.
2. Articulated lorries are the long-distance trade
y["artic_of_hgv"] = y.artic / y.all_HGVs.replace(0, np.nan)
print(y.groupby("road_category").artic_of_hgv.median().round(2).to_string())
road_category
PA 0.24
PM 0.32
TA 0.54
TM 0.67
Articulated lorries — tractor units with trailers, the long-distance haulage fleet — are 67% of lorries on trunk motorways and 24% on principal A roads, where rigid lorries doing local deliveries dominate.
3. Lorry-kilometres by road
y["hgv_km_m"] = y.all_HGVs * y.link_length_km * 365 / 1e6
corr = y.groupby("road_name").hgv_km_m.sum().sort_values(ascending=False)
print(f"share of major-road lorry-km on the top 10 roads: {corr.head(10).sum() / corr.sum():.1%}")
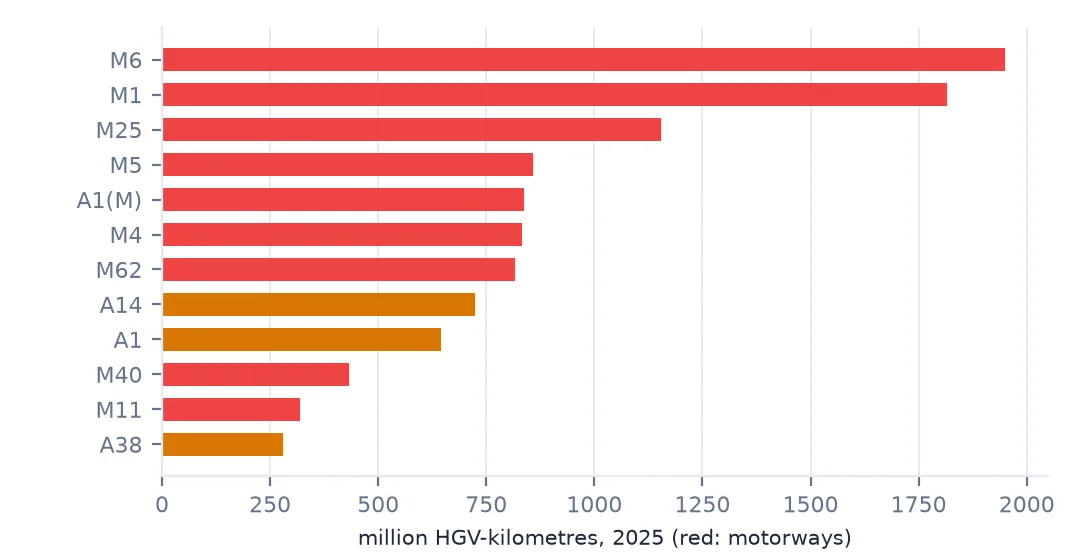
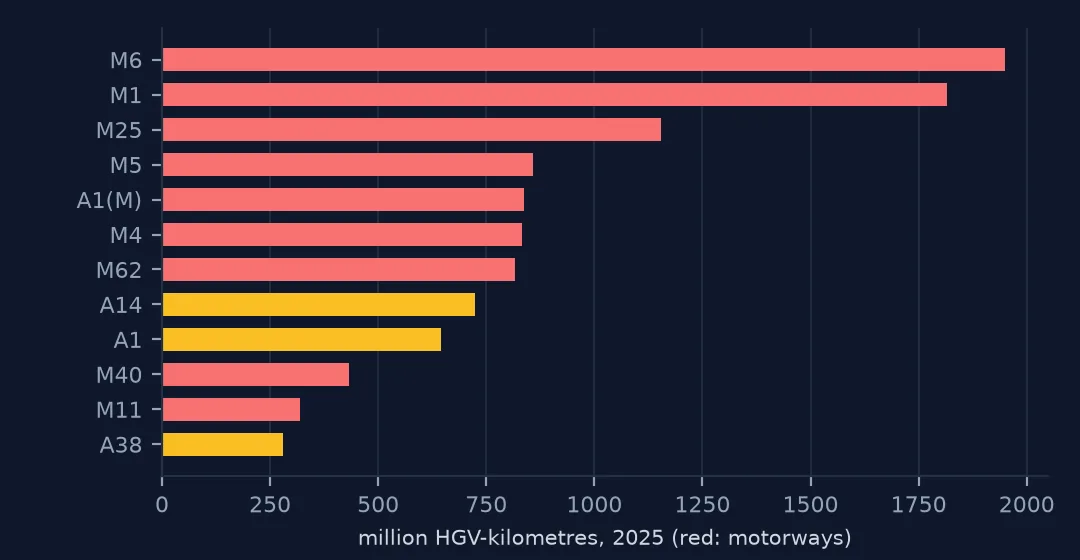
print(corr.head(10).round(0).to_string())
share of major-road lorry-km on the top 10 roads: 41.6%
road_name
M6 1951.0
M1 1817.0
M25 1154.0
M5 859.0
A1(M) 838.0
M4 832.0
M62 817.0
A14 723.0
A1 646.0
M40 434.0
Ten roads carry 41.6% of all lorry-kilometres on major roads. The M6 and M1 lead, at 1,951 and 1,817 million lorry-km a year, followed by the M25, M5, A1(M), M4 and M62; the A14 to Felixstowe is the only non-motorway route in the top eight.
4. Lorries over time
m = aadf[(aadf.road_type == "Major") & aadf.link_length_km.notna()]
hk = (m.all_HGVs * m.link_length_km * 365 / 1e9).groupby(m.year).sum()
lv = (m.LGVs * m.link_length_km * 365 / 1e9).groupby(m.year).sum()
print(pd.DataFrame({"HGV bn km": hk, "van bn km": lv}).loc[[2000, 2008, 2010, 2019, 2020, 2025]].round(1).to_string())
HGV bn km van bn km
year
2000 24.5 31.9
2008 25.0 40.7
2010 23.4 40.3
2019 25.5 53.2
2020 23.7 47.4
2025 24.2 61.1
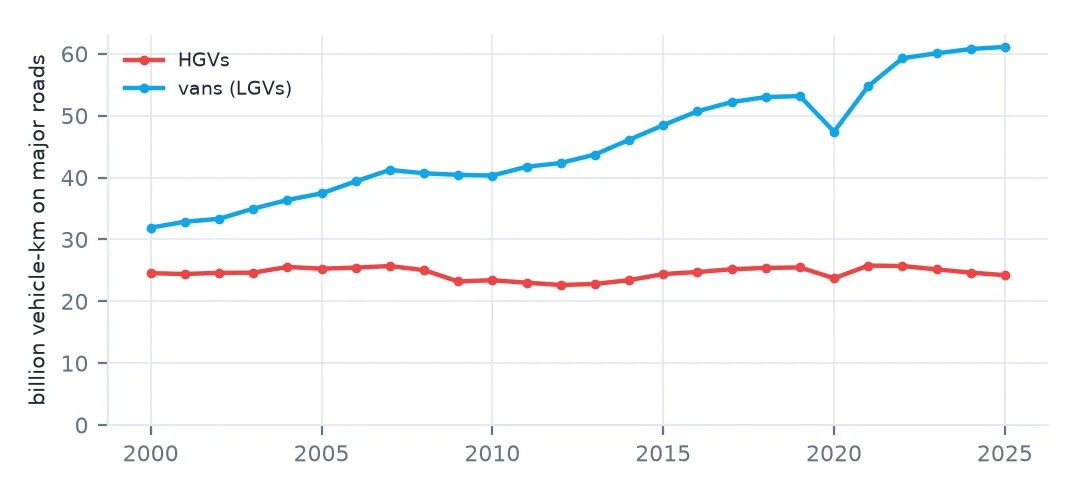
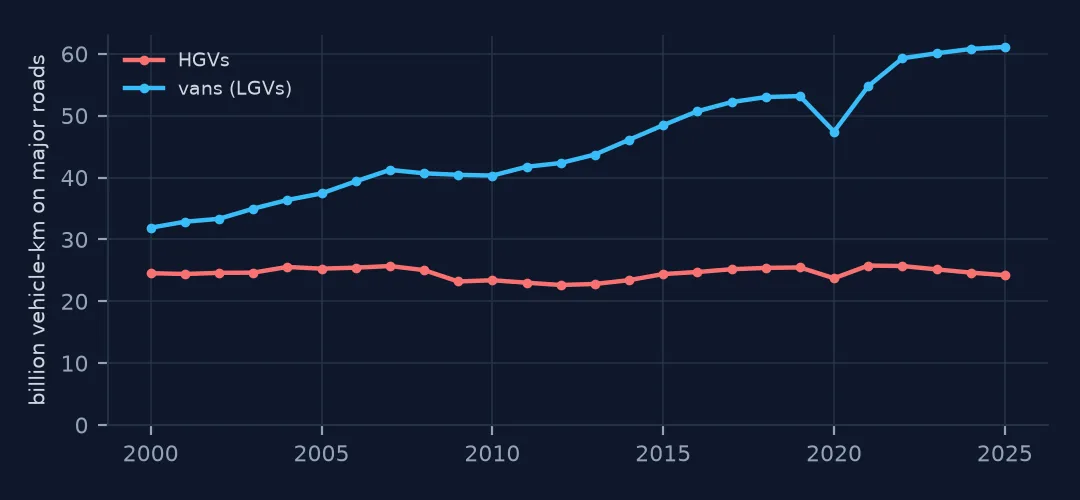
Lorry travel on major roads has been flat for 25 years — 24.5 billion km in 2000, 25.5 billion in 2019, 24.2 billion in 2025 — while van travel nearly doubled, from 31.9 to 61.1 billion km. Freight has not shrunk; more of it moves in vans.
Port roads and motorways
The data used on this page
The Department for Transport's road traffic statistics: annual average daily flows (AADF) for every count point in Great Britain, 2000–2025, in the release of 2 June 2026, saved on this site because DfT revises earlier years with each release. Contains public sector information licensed under the Open Government Licence v3.0.
from pathlib import Path

import numpy as np
import pandas as pd
import requests

Path("data").mkdir(exist_ok=True)
# DfT republishes the counts every June and revises earlier years; this is the release of 2 June 2026
# (live: https://storage.googleapis.com/dft-statistics/road-traffic/downloads/data-gov-uk/dft_traffic_counts_aadf.zip).
AADF = "dft-traffic-counts-aadf-2026-06-02.zip"
if not Path(f"data/{AADF}").exists():
    Path(f"data/{AADF}").write_bytes(requests.get(f"https://data.spatialworkflow.io/{AADF}", timeout=600).content)
aadf = pd.read_csv(f"data/{AADF}", low_memory=False)
print(f"{len(aadf):,} rows, {aadf.count_point_id.nunique():,} count points, {aadf.year.min()}-{aadf.year.max()}")
600,551 rows, 46,754 count points, 2000-2025
Example 1: where the lorries are a third of traffic
hi = y[(y.hgv_share >= 0.3) & (y.all_motor_vehicles >= 5000)]
print(f"{len(hi)} major-road links with 30%+ lorries and 5,000+ vehicles a day")
print(hi.sort_values("hgv_share", ascending=False)[["road_name", "local_authority_name", "all_motor_vehicles", "hgv_share"]].head(6).round(3).to_string(index=False))
9 major-road links with 30%+ lorries and 5,000+ vehicles a day
road_name local_authority_name all_motor_vehicles hgv_share
A160 North Lincolnshire 17532 0.485
A160 North Lincolnshire 12210 0.484
A160 North East Lincolnshire 17338 0.484
A154 Suffolk 8472 0.394
A1053 Redcar and Cleveland 5585 0.366
A1089 Thurrock 19505 0.322
Only nine major-road links with 5,000 or more vehicles a day carry 30% or more lorries, and they are port roads: the A160 to Immingham, where lorries are 48.5% of traffic, the A154 at Felixstowe, the A1053 at Teesside and the A1089 to Tilbury. A map of lorry shares is a map of where freight meets the sea.
Example 2: motorways against A roads
print(f"median HGV share on motorways: {y[y.road_category.isin(['TM', 'PM'])].hgv_share.median():.1%}; "
      f"on A roads: {y[y.road_category.isin(['TA', 'PA'])].hgv_share.median():.1%}")
median HGV share on motorways: 8.8%; on A roads: 2.6%
The median lorry share is 8.8% on motorways and 2.6% on A roads. These are all-day averages; hourly profiles show lorries concentrated in the middle of the day, so at 11:00 the share on a motorway is higher still.
Three maps of freight
A count, a share and a distance answer different questions. The count answers "where would a lorry ban or a toll affect most lorries?", and picks the busiest motorways. The share answers "where does freight shape the road?", and picks port roads and a few rural trunk roads. Lorry-kilometres answer "where does freight travel?", weighting each link by its length, and pick the long national corridors. A single freight map has to choose one, and say which.
Axle classes add a fourth dimension. Articulated lorries mark long-distance trunking between ports, distribution centres and cities; rigid lorries mark local distribution. The file's six classes allow the split without any knowledge of what the lorries carry, which the count data does not record.
Pitfalls with lorry counts
- Count, share and lorry-km pick different roads. Choose one per question.
- Shares are all-day averages; lorries are concentrated in daytime hours.
- Major roads only have link lengths for lorry-km.
- Vans are not HGVs. Light goods vehicles are their own class, and the fastest-growing.
- Classes are rounded separately; use
all_HGVsfor totals.
Internal links
- How to turn traffic counts into vehicle-kilometres by region — the same arithmetic for all traffic
- How to build hour-of-day traffic profiles — when lorries run
- How to read UK road traffic counts — the vehicle classes
- How to build an airline route network — freight's other network
FAQ
Which UK motorway carries the most lorries?
By median count across its links in 2025, the M62 (14,987 HGVs a day); by total lorry-kilometres, the M6 (1,951 million a year).
Has lorry traffic in Britain increased?
Not on major roads: 24.5 billion lorry-km in 2000 and 24.2 billion in 2025, while van travel grew from 31.9 to 61.1 billion km.