
Why Is Connecticut Missing From My County Map?
On this page
Problem statement
You join a county health dataset to current county boundaries and Connecticut comes out blank: every one of its polygons empty, and eight rows of data left over. Nothing is wrong with the join. In 2022 the Census Bureau replaced Connecticut's eight historical counties, which have had no government since 1960, with its nine planning regions as county equivalents. Boundary files and population estimates from 2022 onwards use the planning regions (FIPS 09110 to 09190); many health datasets still report by the old counties (09001 to 09015). The two sets of areas do not nest, so the codes cannot simply be renamed.
This page shows the mismatch with 2024 CDC county overdose data, Census boundaries and CDC PLACES, and converts the old-county counts to planning regions through the towns, which nest in both.
Quick answer
Every Connecticut town lies wholly inside one old county and one planning region. Split each old county's count between regions in proportion to the population of its towns in each:
xw = XWALK.merge(TOWNS, on="NEW_COUSUB_GEOID")
xw["share"] = xw.pop2023 / xw.groupby("OLD_COUNTYFP").pop2023.transform("sum")
W = xw.groupby(["OLD_COUNTYFP", "NEW_COUNTYFP"]).share.sum().unstack(fill_value=0)   # 8 old × 9 new
deaths_old = CT_OD.set_index("county_fp").deaths
deaths_new = deaths_old @ W.loc[deaths_old.index]
print(f"{deaths_old.sum():.0f} deaths in the 8 old counties → {deaths_new.sum():.1f} in the 9 planning regions")
print(deaths_new.round(1).rename(REGION_NAMES).sort_values(ascending=False).to_string())
926 deaths in the 8 old counties → 926.0 in the 9 planning regions
NEW_COUNTYFP
Capitol 276.5
South Central Connecticut 178.2
Naugatuck Valley 127.9
Western Connecticut 106.1
Southeastern Connecticut 96.0
Greater Bridgeport 55.8
Lower Connecticut River Valley 42.6
Northeastern Connecticut 22.5
Northwest Hills 20.4
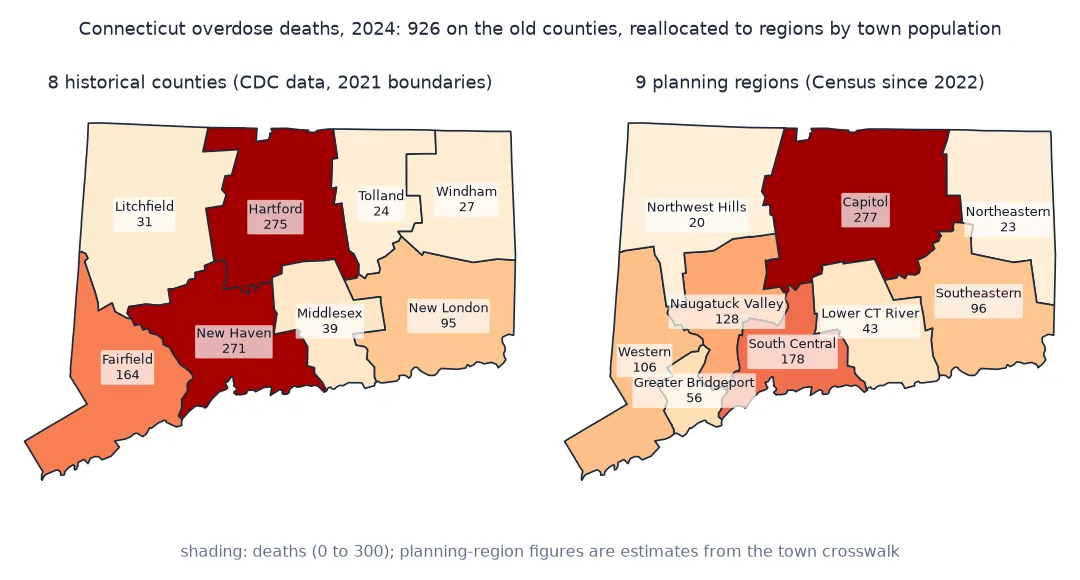
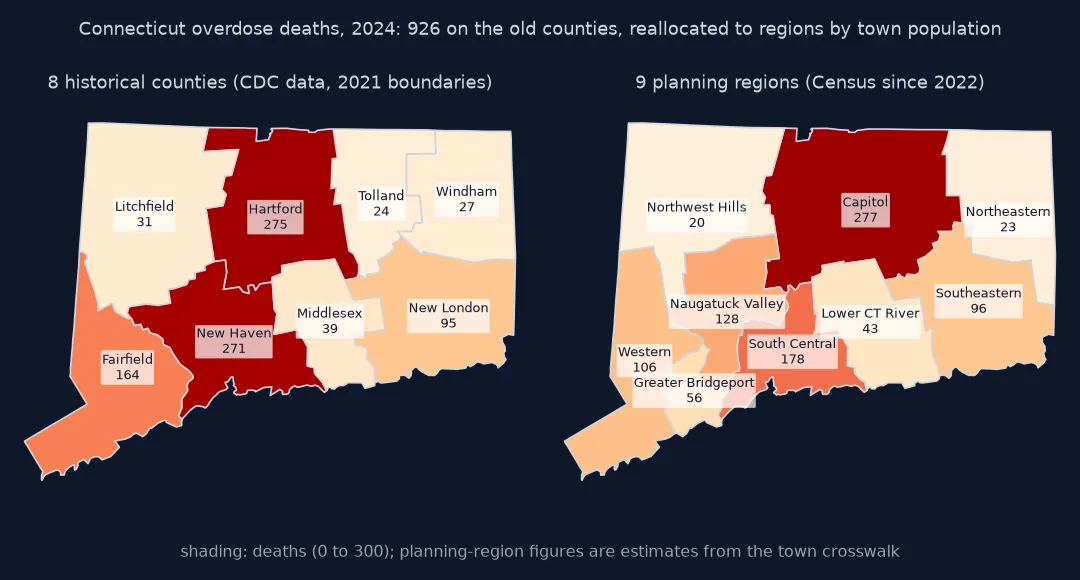
See the mismatch, find each geography, check the overlaps
1. See the mismatch
Join the CDC's 2024 overdose data to the 2023 county boundary file:
ct23 = C2023[C2023.STATEFP == "09"]
print(f"2023 boundaries: {len(ct23)} Connecticut areas, {ct23.GEOID.min()}–{ct23.GEOID.max()}; "
      f"CDC data: {len(CT_OD)} areas, {CT_OD.geoid.min()}–{CT_OD.geoid.max()}")
print(f"matched by GEOID: {ct23.GEOID.isin(CT_OD.geoid).sum()} of {len(ct23)}")
2023 boundaries: 9 Connecticut areas, 09110–09190; CDC data: 8 areas, 09001–09015
matched by GEOID: 0 of 9
2. Find out which geography each dataset uses
Before combining any two county datasets, check Connecticut's codes in each:
places = requests.get("https://data.cdc.gov/resource/swc5-untb.json", timeout=120, params={
    "$where": "stateabbr = 'CT' AND measureid = 'DEPRESSION' AND datavaluetypeid = 'AgeAdjPrv'", "$select": "locationid, locationname, data_value", "$limit": 50}).json()
print("CDC overdose (2024):", sorted(CT_OD.geoid)[:3], "...")
print("CDC PLACES county (2025 release):", sorted(r["locationid"] for r in places)[:3], "...")
print("Census population estimates (Vintage 2024):", sorted(POPEST.GEOID[POPEST.GEOID.str.startswith("09")])[:3], "...")
CDC overdose (2024): ['09001', '09003', '09005'] ...
CDC PLACES county (2025 release): ['09110', '09120', '09130'] ...
Census population estimates (Vintage 2024): ['09110', '09120', '09130'] ...
3. Check how the two sets of areas overlap
Only one old county lies wholly inside a single region:
print((W > 0).sum(axis=1).rename(OLD_NAMES).rename("regions per old county").to_string())
print(f"largest share of one old county in one region: {W.max(axis=1).max():.0%}")
OLD_COUNTYFP
Fairfield County 3
Hartford County 3
Litchfield County 3
Middlesex County 1
New Haven County 2
New London County 3
Tolland County 2
Windham County 2
largest share of one old county in one region: 100%
Rates for the planning regions
The data used on this page
The Census Bureau's Connecticut county-to-county-subdivision crosswalk, which lists every town with its old county and its planning region, town population estimates (Vintage 2024), Census county boundary files for 2021 (old counties) and 2023 (planning regions), CDC county overdose deaths for 2024 and CDC PLACES county estimates.
from pathlib import Path

import geopandas as gpd
import numpy as np
import pandas as pd
import requests

Path("data").mkdir(exist_ok=True)
SRC = {"ct_cou_to_cousub_crosswalk.txt": "https://www2.census.gov/geo/docs/reference/ct_change/ct_cou_to_cousub_crosswalk.txt",
       "sub-est2024_9.csv": "https://www2.census.gov/programs-surveys/popest/datasets/2020-2024/cities/totals/sub-est2024_9.csv",
       "cb_2021_us_county_5m.zip": "https://www2.census.gov/geo/tiger/GENZ2021/shp/cb_2021_us_county_5m.zip",
       "cb_2023_us_county_5m.zip": "https://www2.census.gov/geo/tiger/GENZ2023/shp/cb_2023_us_county_5m.zip",
       "co-est2024-alldata.csv": "https://www2.census.gov/programs-surveys/popest/datasets/2020-2024/counties/totals/co-est2024-alldata.csv"}
for name, url in SRC.items():
    if not Path("data", name).exists():
        Path("data", name).write_bytes(requests.get(url, timeout=300).content)

XWALK = pd.read_csv("data/ct_cou_to_cousub_crosswalk.txt", sep="|", dtype=str, encoding="utf-8-sig")
XWALK.columns = [c.split("\n")[0] for c in XWALK.columns]               # headers carry a second line, "(INCITS31)"
XWALK = XWALK.dropna(subset=["NEW_COUSUB_GEOID"])                       # the file ends with lines of notes
t = pd.read_csv("data/sub-est2024_9.csv", encoding="latin-1", dtype=str).query("SUMLEV == '061'")
TOWNS = pd.DataFrame({"NEW_COUSUB_GEOID": t.STATE + t.COUNTY + t.COUSUB, "pop2023": t.POPESTIMATE2023.astype(int)})
OLD_NAMES = XWALK.drop_duplicates("OLD_COUNTYFP").set_index("OLD_COUNTYFP").OLD_COUNTY_NAMELSAD
REGION_NAMES = XWALK.drop_duplicates("NEW_COUNTYFP").set_index("NEW_COUNTYFP").NEW_COUNTY_NAMELSAD.str.replace(" Planning Region", "")

C2021, C2023 = gpd.read_file("data/cb_2021_us_county_5m.zip"), gpd.read_file("data/cb_2023_us_county_5m.zip")
c = pd.read_csv("data/co-est2024-alldata.csv", encoding="latin-1", dtype={"STATE": str, "COUNTY": str})
POPEST = c[c.SUMLEV == 50].assign(GEOID=lambda d: d.STATE + d.COUNTY)[["GEOID", "CTYNAME", "POPESTIMATE2023"]]
CT_OD = pd.DataFrame(requests.get("https://data.cdc.gov/resource/psx4-wq38.json", timeout=120, params={
    "$where": "intent = 'Drug_OD' AND period = '2024' AND st_geoid = '09'", "$select": "geoid, name, count_sup, rate"}).json())
CT_OD["deaths"] = CT_OD.count_sup.astype(int)
CT_OD["county_fp"] = CT_OD.geoid.str[2:]
print(f"crosswalk: {len(XWALK)} rows, {XWALK.COUSUB_NAMELSAD.str.endswith('town').sum()} towns; "
      f"{len(TOWNS)} town estimates; {len(CT_OD)} Connecticut rows in the overdose data")
crosswalk: 174 rows, 169 towns; 169 town estimates; 8 Connecticut rows in the overdose data
Example 1: rates for the planning regions
With the deaths on planning regions, divide by the regions' own population estimates:
reg = POPEST.set_index("GEOID").loc[["09" + f for f in deaths_new.index]]
rate = deaths_new.values / reg.POPESTIMATE2023.values * 1e5
print(pd.Series(rate, index=reg.CTYNAME.str.replace(" Planning Region", "")).round(1).sort_values(ascending=False).to_string())
CTYNAME
Southeastern Connecticut 34.2
South Central Connecticut 31.1
Capitol 28.1
Naugatuck Valley 27.9
Lower Connecticut River Valley 24.1
Northeastern Connecticut 23.3
Northwest Hills 18.0
Greater Bridgeport 16.8
Western Connecticut 16.8
Example 2: now the datasets join
pl = pd.DataFrame(places).assign(data_value=lambda d: d.data_value.astype(float)).set_index("locationid")
joined = pl.join(pd.Series(rate, index=reg.index, name="od_rate"), how="inner")
print(f"{len(joined)} of 9 planning regions have both a PLACES estimate and an overdose rate")
9 of 9 planning regions have both a PLACES estimate and an overdose rate
Why Connecticut changed its statistical counties
Connecticut abolished county government in 1960, but the eight counties stayed in federal statistics for another six decades. Its planning regions, councils of governments that do the regional work, became the official county equivalents for Census purposes from 2022, so every Census product since uses them. Agencies switch at different speeds: the CDC's PLACES has moved to planning regions in its county data, while the CDC's injury and overdose data still report by the old counties.
Because the towns nest in both sets of areas, a town-based crosswalk converts counts exactly as far as the towns allow, and the only assumption is that deaths are spread over each old county's towns in proportion to population. Converting rates directly is not valid: convert counts, then divide by the new areas' populations, as in Example 1.
Mapping only, suppressed counts and water
- Mapping only: to draw old-county data, use a boundary file from 2021 or earlier, which still has the eight counties.
- Direction: the same town table converts planning-region data back to old counties.
- Suppressed counts: allocating a range such as 1–9 is not possible; convert where counts are known, or allocate the bounds.
- Water: the crosswalk lists five "county subdivisions not defined", water areas with no population; they get no weight.
- Other states: Alaska's Valdez-Cordova split in 2019 is the same kind of change on a smaller scale.
Internal links
- How to map county drug overdose death rates — the data on old-county boundaries
- How to join health data across tract vintages — the same problem for census tracts
FAQ
Why does Connecticut have no counties in Census data?
Since 2022 the Census Bureau has used Connecticut's nine planning regions as county equivalents in place of its eight historical counties.
What are the new Connecticut county FIPS codes?
09110 to 09190, one for each planning region: Capitol, Greater Bridgeport, Lower Connecticut River Valley, Naugatuck Valley, Northeastern, Northwest Hills, South Central, Southeastern and Western Connecticut.
How do I convert Connecticut county data to planning regions?
Use the Census crosswalk of towns to old counties and planning regions, split each county's counts by town population, and sum by region.
Which boundary file has the old Connecticut counties?
Census cartographic and TIGER boundary files for 2021 and earlier.