
Fixing GHCN Temperatures in Tenths of a Degree and -9999 Values
On this page
Problem statement
You plot NOAA GHCN-Daily temperatures and summer days reach 350 degrees, or a mean comes out at a few hundred below zero. GHCN stores values as integers: temperatures in tenths of °C, precipitation in tenths of mm, snowfall and snow depth in whole mm. The fixed-width .dly files mark missing values with -9999. Neither is a bug, but forgetting either produces numbers that are wrong by a factor of ten or by thousands, and the second kind can hide inside an average.
This page reads the Washington Reagan National Airport record in both GHCN formats, the CSV access file and the fixed-width .dly file. It shows what the raw values look like, converts them correctly, catches the -9999 sentinel, and adds range checks that would have flagged either mistake.
Quick answer
Divide temperatures and precipitation by ten, and turn -9999 into missing before anything else:
D = read_dly(DLY)
D = D.replace(-9999, np.nan)
for el in ("TMAX", "TMIN", "PRCP"):
    D[el] = D[el] / 10
print(f"days {len(D):,}; TMAX {D.TMAX.min():.1f} to {D.TMAX.max():.1f} °C; PRCP max {D.PRCP.max():.1f} mm; SNOW max {D.SNOW.max():.0f} mm")
days 31,168; TMAX -13.3 to 40.6 °C; PRCP max 155.2 mm; SNOW max 417 mm
Converted, the .dly gives 31,168 days, with maxima from −13.3 to 40.6 °C, a wettest day of 155.2 mm and a deepest one-day snowfall of 417 mm.
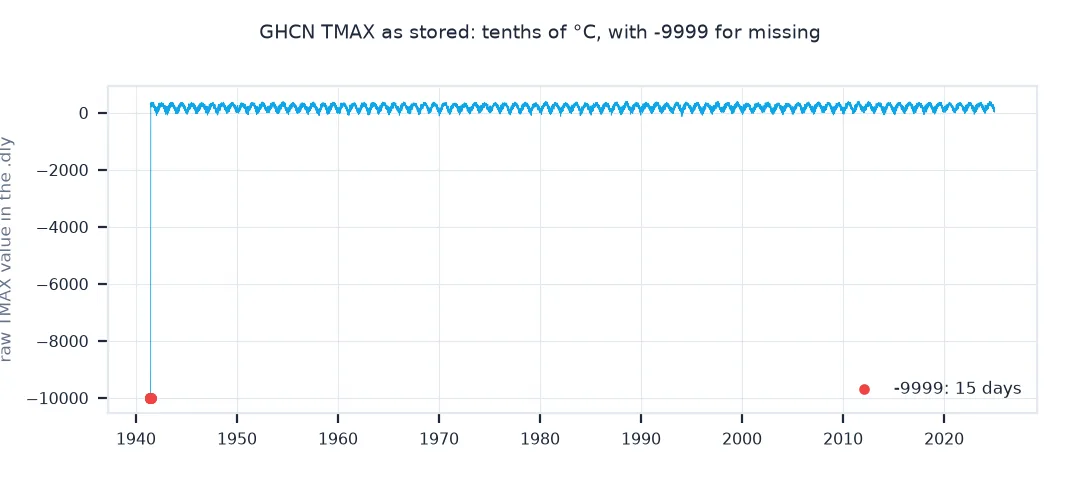
The raw values, what each omission does, range checks
1. The raw values
raw = read_dly(DLY)
print(f"raw TMAX on 2024-07-15: {raw.loc['2024-07-15', 'TMAX']}; raw PRCP: {raw.loc['2024-07-15', 'PRCP']}")
print(f"-9999 values in the raw .dly: TMAX {int((raw.TMAX == -9999).sum())}, TMIN {int((raw.TMIN == -9999).sum())}, PRCP {int((raw.PRCP == -9999).sum())}")
raw TMAX on 2024-07-15: 389; raw PRCP: 0
-9999 values in the raw .dly: TMAX 16, TMIN 16, PRCP 17
The raw file stores 389 for 38.9 °C. TMAX and TMIN each have 16 -9999 values and PRCP 17.
2. What forgetting each step does
t_raw = raw.TMAX.loc["1937":"2024"]
print(f"mean TMAX with -9999 left in and no scaling: {t_raw.mean():.1f}")
print(f"mean TMAX with -9999 removed but no scaling: {t_raw.replace(-9999, np.nan).mean():.1f}")
print(f"mean TMAX done right: {t_raw.replace(-9999, np.nan).mean() / 10:.2f} °C")
mean TMAX with -9999 left in and no scaling: 189.7
mean TMAX with -9999 removed but no scaling: 194.7
mean TMAX done right: 19.47 °C
The three versions of the long-term mean maximum: 189.7 with the sentinels left in and no scaling, 194.7 with the sentinels removed but no scaling, and 19.47 °C done right. Sixteen -9999 values out of tens of thousands shift the mean by 5 tenths, or half a degree once scaled, an error easy to miss in a converted series.
3. Range checks that catch it
Plausible limits catch scale and sentinel errors before they reach a result:
def check(df):
    problems = {}
    if df.TMAX.max() > 60 or df.TMIN.min() < -90: problems["temperature"] = (float(df.TMIN.min()), float(df.TMAX.max()))
    if df.PRCP.max() > 1000: problems["precipitation"] = float(df.PRCP.max())
    return problems or "all within plausible ranges"
print("raw:", check(raw))
print("converted:", check(D))
raw: {'temperature': (-9999.0, 406.0), 'precipitation': 1552.0}
converted: all within plausible ranges
The range checks flag the raw data on both counts, a minimum of −9999 and precipitation of 1,552, and pass the converted data.
The CSV keeps the scale but not the sentinel
The data used on this page
The GHCN-Daily record for USW00013743, Washington Reagan National Airport, as the fixed-width .dly file from NOAA's archive and the CSV access file.
from pathlib import Path

import numpy as np
import pandas as pd
import requests

Path("data").mkdir(exist_ok=True)
def cached(path, url):
    p = Path(path)
    if not p.exists():
        r = requests.get(url, timeout=600); r.raise_for_status(); p.write_bytes(r.content)
    return p
DLY = cached("data/USW00013743.dly", "https://www.ncei.noaa.gov/pub/data/ghcn/daily/all/USW00013743.dly")
CSV = cached("data/USW00013743.csv", "https://www.ncei.noaa.gov/data/global-historical-climatology-network-daily/access/USW00013743.csv")

def read_dly(path, elements=("TMAX", "TMIN", "PRCP", "SNOW")):
    """Parse a GHCN .dly file: one line per station-month-element, 31 fixed-width day fields."""
    rows = []
    for line in Path(path).read_text().splitlines():
        el = line[17:21]
        if el not in elements:
            continue
        y, m = int(line[11:15]), int(line[15:17])
        for d in range(31):
            v = int(line[21 + d * 8: 26 + d * 8])
            rows.append((y, m, d + 1, el, v))
    df = pd.DataFrame(rows, columns=["y", "m", "d", "el", "v"])
    df["date"] = pd.to_datetime(dict(year=df.y, month=df.m, day=df.d), errors="coerce")
    return df.dropna(subset=["date"]).pivot_table(index="date", columns="el", values="v", aggfunc="first")
print(f"{DLY.name}: {DLY.stat().st_size / 1e6:.1f} MB")
USW00013743.dly: 5.1 MB
The fixed-width file is 5.1 MB.
Example 1: the CSV has no sentinel, but the same scale
The CSV access file leaves missing values empty instead of -9999, but keeps the tenths:
c = pd.read_csv(CSV, usecols=["DATE", "TMAX"], parse_dates=["DATE"]).set_index("DATE").TMAX
print(f"CSV TMAX on 2024-07-15: {c.loc['2024-07-15']}; minimum value in the CSV {c.min()}; same as the .dly converted back: {c.loc['2024-07-15'] / 10 == D.loc['2024-07-15', 'TMAX']}")
CSV TMAX on 2024-07-15: 389.0; minimum value in the CSV -133.0; same as the .dly converted back: True
The CSV has the same 389 for 15 July, but its lowest value is −133, −13.3 °C: no sentinel. Converted, both formats agree.
Punched-card conventions
GHCN-Daily goes back to formats designed for punched cards and fixed-width files, where integers were cheaper and safer than decimals. Temperatures are therefore stored in tenths of a degree Celsius, precipitation in tenths of a millimetre, and snowfall and snow depth in millimetres. In the .dly format, each line holds one element for one month, with 31 day fields of 8 characters: a 5-character value and three 1-character flags. Days that did not happen, such as 31 February, or were not observed hold -9999. The newer CSV access files keep the integer scale but leave missing values blank, which pandas reads as NaN.
Both conventions are documented in the GHCN readme, and both are easy to forget when the data is read by hand. The resulting errors differ in visibility. A factor of ten is obvious in a plot, while a few -9999 values among thousands of real ones drag a mean down by a few degrees and pass unnoticed. Range checks against physically plausible limits catch both, and belong in any pipeline that reads raw station data.
Fahrenheit products, traces and invalid dates
- Fahrenheit products: NOAA's normals and Climate Data Online exports can be in °F and inches; check the units of each product.
- Trace precipitation: stored as 0 with the measurement flag
T, not as a small number. - Other elements:
AWND(average wind) is in tenths of m/s,TAVGin tenths of °C; check the readme for each element. - Invalid dates: 31-day fields exist for every month; the extra days are
-9999and must not become dates.
Internal links
- How to get NOAA GHCN daily weather station data in Python — the CSV route
- Fixing gaps and missing values in weather station data — sentinels and gaps
- Fixing ERA5 temperature in kelvin — the unit trap in reanalysis
FAQ
Why are GHCN temperatures ten times too big?
They are stored in tenths of °C; divide by 10.
What does -9999 mean in GHCN data?
A missing value, or a day that does not exist in that month, in the fixed-width .dly files; replace it with NaN.
What units is GHCN precipitation in?
Tenths of a millimetre for PRCP; millimetres for SNOW and SNWD.
How do I read a GHCN .dly file in Python?
Parse it as fixed width: station ID, year, month and element, then 31 day groups of 8 characters (value plus three flags).