
Climate Normals Explained: What "Normal" Weather Means
On this page
Problem statement
"Warmer than normal", "below-normal rainfall": weather reports measure everything against normals, and most people read them as what the weather should be. A climate normal is something narrower: the average of 30 years of observations at one place, for a defined period, recomputed every decade. It is not the most likely value, not a forecast, and not a fixed property of a place, since each new period is warmer than the last. Misreading what it is leads to misreading every anomaly built on it.
This page explains what climate normals are and how they are made, using the record of Washington Reagan National Airport. It compares three normal periods, measures how often a July day is actually close to the July normal, and shows how wide the spread around a normal is for temperature and for rain.
Quick answer
A normal is a 30-year average. For July maximum temperature at Reagan National, by period:
for a, b in PERIODS:
    x = G.loc[a:b]
    jul = x[x.index.month == 7].TMAX
    print(f"{a}-{b}: July mean maximum {jul.mean():.1f} °C (standard deviation of daily values {jul.std():.1f} °C)")
1961-1990: July mean maximum 31.2 °C (standard deviation of daily values 3.1 °C)
1981-2010: July mean maximum 31.4 °C (standard deviation of daily values 3.3 °C)
1991-2020: July mean maximum 31.7 °C (standard deviation of daily values 3.3 °C)
The July normal maximum rose from 31.2 °C for 1961-1990 to 31.4 °C for 1981-2010 and 31.7 °C for 1991-2020. Individual July days scatter about 3 °C either side of it.
Normal is not typical, rain is skewed, normals move
1. Normal is not typical
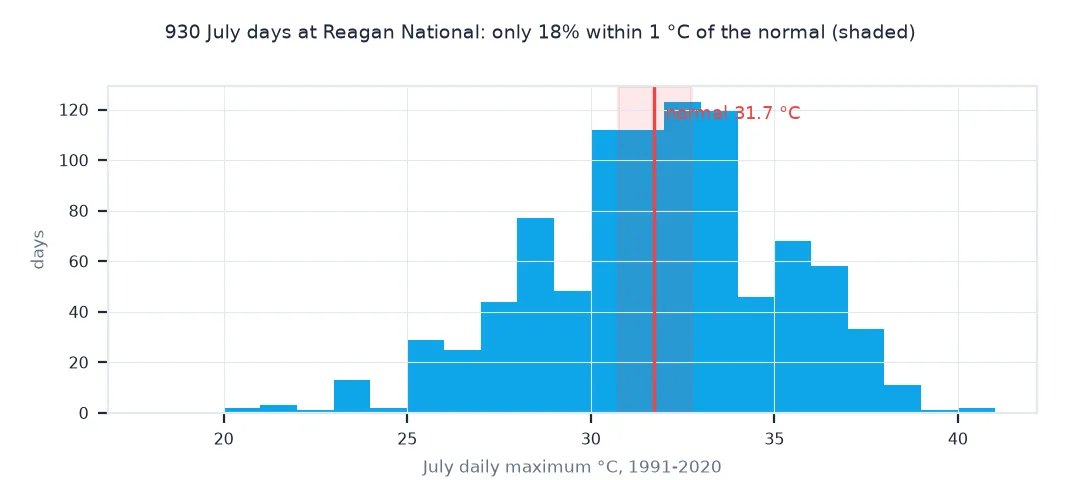
How many July days in 1991-2020 were within 1 °C of the July normal?
base = G.loc["1991":"2020"]
jul = base[base.index.month == 7].TMAX
n = jul.mean()
print(f"July normal maximum {n:.1f} °C; days within ±1 °C: {((jul - n).abs() <= 1).mean():.0%}; within ±3 °C: {((jul - n).abs() <= 3).mean():.0%}")
print(f"10th to 90th percentile of July maxima: {jul.quantile(0.1):.1f} to {jul.quantile(0.9):.1f} °C")
July normal maximum 31.7 °C; days within ±1 °C: 18%; within ±3 °C: 64%
10th to 90th percentile of July maxima: 27.8 to 36.1 °C
Only 18% of July days in 1991-2020 came within 1 °C of the July normal, and 64% within 3 °C. Eight July days in ten fell between 27.8 and 36.1 °C. The normal is the centre of a wide spread, not a forecast for any particular day.
2. Rain is skewed
For precipitation the mean is pulled up by wet months; the median month is drier than the normal:
mp = base.PRCP.resample("MS").sum()
jul_p = mp[mp.index.month == 7]
print(f"July precipitation 1991-2020: normal (mean) {jul_p.mean():.0f} mm, median {jul_p.median():.0f} mm, range {jul_p.min():.0f} to {jul_p.max():.0f} mm")
print(f"Julys below the normal: {(jul_p < jul_p.mean()).sum()} of {len(jul_p)}")
July precipitation 1991-2020: normal (mean) 110 mm, median 107 mm, range 26 to 247 mm
Julys below the normal: 15 of 30
July's normal precipitation is 110 mm, but individual Julys ranged from 26 to 247 mm, and half of them fell below the normal.
3. Normals move
for a, b in PERIODS:
    x = G.loc[a:b]
    print(f"{a}-{b}: annual mean {((x.TMAX + x.TMIN) / 2).mean():.2f} °C; days at or above 35 °C per year {(x.TMAX >= 35).sum() / 30:.1f}")
1961-1990: annual mean 14.35 °C; days at or above 35 °C per year 7.5
1981-2010: annual mean 14.61 °C; days at or above 35 °C per year 11.0
1991-2020: annual mean 14.99 °C; days at or above 35 °C per year 12.2
Normals move. The annual mean rose from 14.35 °C for 1961-1990 to 14.99 °C for 1991-2020, and days of 35 °C or more from 7.5 to 12.2 a year.
A normal year against real years
The data used on this page
The GHCN-Daily record for USW00013743, Washington Reagan National Airport, from NOAA, converted from tenths, for the WMO normal periods 1961-1990, 1981-2010 and 1991-2020.
from pathlib import Path

import pandas as pd
import requests

Path("data").mkdir(exist_ok=True)
CSV = Path("data/USW00013743.csv")
if not CSV.exists():
    r = requests.get("https://www.ncei.noaa.gov/data/global-historical-climatology-network-daily/access/USW00013743.csv", timeout=600); r.raise_for_status(); CSV.write_bytes(r.content)
G = pd.read_csv(CSV, usecols=["DATE", "TMAX", "TMIN", "PRCP"], parse_dates=["DATE"]).set_index("DATE").loc[:"2024-12-31"] / 10
PERIODS = (("1961", "1990"), ("1981", "2010"), ("1991", "2020"))
print(f"record to {G.index.max():%Y-%m-%d}")
record to 2024-12-31
The record used runs to the end of 2024.
Example 1: how a normal year compares with real years
Count how many years from 1991 to 2020 had an annual mean within 0.3 °C of the period's normal:
yr = ((base.TMAX + base.TMIN) / 2).groupby(base.index.year).mean()
print(f"annual means 1991-2020: {yr.min():.2f} to {yr.max():.2f} °C around a normal of {yr.mean():.2f}; years within ±0.3 °C: {((yr - yr.mean()).abs() <= 0.3).sum()} of 30")
annual means 1991-2020: 13.61 to 16.42 °C around a normal of 14.99; years within ±0.3 °C: 8 of 30
Within 1991-2020 itself, annual means ranged from 13.61 to 16.42 °C around the normal of 14.99 °C, and only 8 of the 30 years were within 0.3 °C of it.
The WMO definition
Climate normals are defined by the World Meteorological Organization as averages over 30-year periods, updated every 10 years. The current standard period is 1991-2020, which replaced 1981-2010 in 2021, and 1961-1990 is kept as a fixed reference for long-term change. National services compute them for each station, with corrections for gaps and station changes, for temperature, precipitation, snowfall, degree days and more, as monthly, daily and annual values. Thirty years is long enough to average out most year-to-year variation, and short enough to describe the recent climate.
Two points follow from the definition. A normal is an average, not a typical value. Daily temperatures scatter widely around it, and for skewed variables such as rainfall most months fall below the mean. "Normal" therefore does not mean "expected" or "usual" in everyday terms, and a month a degree above normal is not necessarily unusual. And normals move. Each new period is warmer than the last at most stations, so the bar for "above normal" rises every decade. An anomaly against an old period overstates recent change compared with the current baseline, and one against the current period understates warming since the mid-20th century. Stating the period is not optional.
Fixed references, short records and percentiles
- Fixed reference: climate-change studies often keep 1961-1990 or 1951-1980 as a stable baseline instead of the moving current normal.
- Short records: stations with fewer than 30 years get normals estimated from neighbours, flagged as such.
- Percentiles: for variability, quintiles or terciles of the normal period are more informative than the mean alone.
- Gridded normals: PRISM (US) and WorldClim (global) interpolate normals between stations.
Internal links
- How to calculate climate normals in Python — computing them
- How to calculate temperature anomalies in Python — anomalies against a normal
- Reanalysis vs station data explained — where normals come from
FAQ
What is a climate normal?
The 30-year average of a weather variable at a place, currently over 1991-2020, used as the baseline for "normal" weather.
Why are climate normals 30 years?
Thirty years is the WMO standard: long enough to smooth year-to-year variation, recent enough to describe the current climate.
Does normal mean typical?
No; it is an average. Daily values scatter widely around it, and for rainfall most months are below the mean.
How often are climate normals updated?
Every 10 years; 1991-2020 replaced 1981-2010 in 2021, and 2001-2030 will follow.