
Weather Data Sources for Python, Explained: Stations, Reanalysis and APIs
On this page
Problem statement
Ask for "the weather in Washington in July 2024" and Python offers half a dozen answers: NOAA's GHCN station archive, Meteostat's merged station data, the Open-Meteo archive in its default blend or pinned to ERA5, the ERA5 grid itself, and forecasts archived after the fact. They differ in what they measure, how complete and how local they are, how far back they go, and what it takes to get them. Choosing well means knowing what each source is, not just how to call it.
This page puts four sources side by side for the same place and month: GHCN, Meteostat, Open-Meteo's ERA5 series and Open-Meteo's default blend. It compares their July 2024 temperatures and rainfall at Washington Reagan National Airport, measures their completeness, and summarises what each is good for.
Quick answer
Collect July 2024 daily maximum temperature and precipitation from each source into one table:
T = pd.DataFrame({"GHCN": G.TMAX, "Meteostat": M.tmax, "Open-Meteo ERA5": E.temperature_2m_max, "Open-Meteo default": B.temperature_2m_max})
P = pd.DataFrame({"GHCN": G.PRCP, "Meteostat": M.prcp, "Open-Meteo ERA5": E.precipitation_sum, "Open-Meteo default": B.precipitation_sum})
summary = pd.DataFrame({"mean tmax °C": T.mean(), "hottest °C": T.max(), "precip mm": P.sum(min_count=1), "days with precip value": P.notna().sum()})
print(summary.round(1).to_string())
mean tmax °C hottest °C precip mm days with precip value
GHCN 33.6 40.0 122.5 31
Meteostat 33.6 40.0 122.5 31
Open-Meteo ERA5 32.4 38.6 82.6 31
Open-Meteo default 31.6 36.7 117.2 31
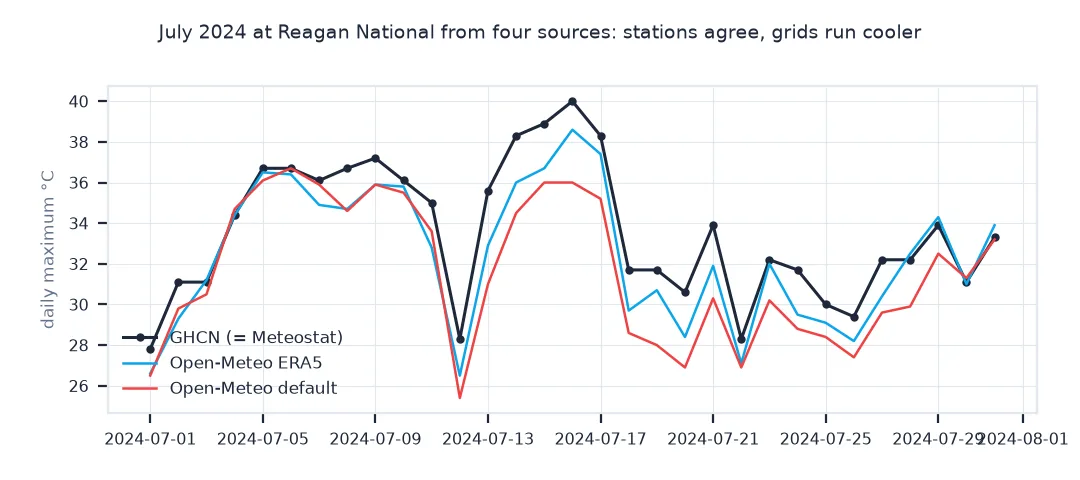
For July 2024, GHCN and Meteostat agree exactly: a mean maximum of 33.6 °C, a hottest day of 40.0 °C and 122.5 mm of rain. For this month Meteostat reproduces the official record exactly. Open-Meteo's ERA5 series is 1.2 °C cooler, with 82.6 mm. Its default blend is cooler still at 31.6 °C, but has 117.2 mm, close to the gauge.
Agreement with the station record, wettest days, what each is
1. Day-by-day agreement with the station record
Take GHCN, the official record, as the reference:
for col in ("Meteostat", "Open-Meteo ERA5", "Open-Meteo default"):
    d = (T[col] - T.GHCN).dropna()
    print(f"{col:>18}: tmax mean difference {d.mean():+.2f} °C, mean absolute {d.abs().mean():.2f} °C")
Meteostat: tmax mean difference +0.00 °C, mean absolute 0.00 °C
Open-Meteo ERA5: tmax mean difference -1.14 °C, mean absolute 1.23 °C
Open-Meteo default: tmax mean difference -1.95 °C, mean absolute 1.99 °C
Against the official record, Meteostat is identical day for day. The ERA5 series is off by 1.23 °C a day on average, and the default blend by 1.99 °C, nearly all of it a cool bias.
2. Rain on the wettest days
wet = P.GHCN.nlargest(3).index
print(P.loc[wet].round(1).to_string())
GHCN Meteostat Open-Meteo ERA5 Open-Meteo default
2024-07-22 39.9 39.9 18.2 21.5
2024-07-25 32.5 32.5 3.0 8.2
2024-07-31 14.5 14.5 1.2 7.1
On the wettest day, 22 July, the gauge caught 39.9 mm. ERA5 gave 18.2 mm and the blend 21.5 mm. On 25 July the gauge's 32.5 mm became 3.0 and 8.2 mm. Gridded rainfall misses the local intensity of summer storms.
3. What each source is
sources = pd.DataFrame([
    ("GHCN-Daily", "station", "1936 here", "none", "official daily values, tenths"),
    ("Meteostat", "stations merged", "varies", "none", "hourly and daily, metric, gaps"),
    ("Open-Meteo ERA5", "reanalysis, 0.25°", "1940", "none (non-commercial)", "complete, cell average"),
    ("Open-Meteo default", "blend of models", "1940", "none (non-commercial)", "complete, model mix"),
], columns=["source", "type", "from", "key", "notes"])
print(sources.to_string(index=False))
source type from key notes
GHCN-Daily station 1936 here none official daily values, tenths
Meteostat stations merged varies none hourly and daily, metric, gaps
Open-Meteo ERA5 reanalysis, 0.25° 1940 none (non-commercial) complete, cell average
Open-Meteo default blend of models 1940 none (non-commercial) complete, model mix
The four sources differ in kind as much as in values: two are station data, two are modelled grids, and none needs a key for non-commercial use.
The spread of sources on one hot day
The data used on this page
July 2024 daily data for Washington Reagan National Airport from NOAA GHCN-Daily (USW00013743), Meteostat (station 72405, CC BY 4.0), and the Open-Meteo archive, both with models=era5 and with its default, in local days.
import hashlib
import json
from datetime import date
from pathlib import Path

import meteostat as ms
import pandas as pd
import requests

Path("data").mkdir(exist_ok=True)
CSV = Path("data/USW00013743.csv")
if not CSV.exists():
    r = requests.get("https://www.ncei.noaa.gov/data/global-historical-climatology-network-daily/access/USW00013743.csv", timeout=600); r.raise_for_status(); CSV.write_bytes(r.content)
G = pd.read_csv(CSV, usecols=["DATE", "TMAX", "PRCP"], parse_dates=["DATE"]).set_index("DATE").loc["2024-07"] / 10
M = ms.daily("72405", date(2024, 7, 1), date(2024, 7, 31)).fetch()

def om(model=None):
    params = {"latitude": 38.8472, "longitude": -77.0345, "start_date": "2024-07-01", "end_date": "2024-07-31",
              "daily": "temperature_2m_max,precipitation_sum", "timezone": "America/New_York"}
    if model: params["models"] = model
    f = Path("data/om_" + hashlib.md5(json.dumps(params, sort_keys=True).encode()).hexdigest() + ".json")
    if not f.exists():
        r = requests.get("https://archive-api.open-meteo.com/v1/archive", params=params, timeout=300); r.raise_for_status(); f.write_text(r.text)
    return pd.DataFrame(json.loads(f.read_text())["daily"]).assign(time=lambda d: pd.to_datetime(d.time)).set_index("time")
E, B = om("era5"), om()
print(f"rows: GHCN {len(G)}, Meteostat {len(M)}, ERA5 {len(E)}, default {len(B)}")
rows: GHCN 31, Meteostat 31, ERA5 31, default 31
Each source returns 31 days for July 2024.
Example 1: the temperature spread on one hot day
On the hottest day by the station record, how far apart are the sources?
d = T.GHCN.idxmax()
print(f"{d:%d %b %Y}: {T.loc[d].round(1).to_dict()}; spread {T.loc[d].max() - T.loc[d].min():.1f} °C")
16 Jul 2024: {'GHCN': 40.0, 'Meteostat': 40.0, 'Open-Meteo ERA5': 38.6, 'Open-Meteo default': 36.0}; spread 4.0 °C
On 16 July, the hottest day, the sources span 4.0 °C, from the station's 40.0 °C to the default blend's 36.0 °C. That spread is large enough to change any statement about records or heat thresholds.
Three families of weather data
Weather data sources fall into three families. Station archives such as GHCN-Daily are the measurements themselves, quality-controlled and long, with the gaps and local character of real instruments. They are the reference for official statistics and records. Station aggregators such as Meteostat merge several station feeds into one convenient interface with consistent units. What they deliver can be no better than the feeds behind them, and a variable merged from incomplete sources can look complete when it is not. In July 2024 Meteostat matched GHCN exactly at this station, but its annual precipitation here is badly incomplete, as the Meteostat guide shows. Reanalysis and model archives such as ERA5, served directly or through Open-Meteo, are complete and consistent everywhere and back to 1940, but as grid-cell averages, with modelled rather than measured precipitation.
The right source follows from the question. Local extremes, records and anything compared with official numbers need station data, preferably the national archive. Consistent series for many places, places without stations, and maps need gridded reanalysis. Quick work at a single location suits an API such as Open-Meteo. Whichever is used, record which source and which model: the same month at the same place differs between sources by a degree in temperature and by more than half in rainfall.
Licences, latency and other regions
- Licences: GHCN is public domain; Meteostat is CC BY 4.0; Open-Meteo's free tier is non-commercial and its data carries the underlying providers' licences.
- Latency: GHCN updates daily; the Open-Meteo archive lags by days; ERA5 final data by a couple of months, with preliminary data sooner.
- Other regions: national services publish their own archives, such as DWD in Germany, the Met Office's MIDAS in the UK and Environment Canada.
- Satellite products: for rainfall without gauges, GPM IMERG and similar products fill the gap between stations and reanalysis.
Internal links
- Reanalysis vs station data explained — the core distinction
- How to get NOAA GHCN daily weather station data in Python — the station archive
- How to get historical weather data in Python — Open-Meteo
FAQ
What is the best source of historical weather data for Python?
For official station values in the US, NOAA GHCN-Daily; for complete series anywhere, ERA5 through Open-Meteo or the Copernicus CDS; for quick station data, Meteostat, checked for completeness.
Is Meteostat data the same as NOAA data?
Partly; Meteostat merges NOAA and other feeds, and the merged series can differ from or be less complete than the national archive.
Why do weather sources disagree?
They measure different things: a point, a merge of points, or a grid-cell average from a model.
Which weather API needs no key?
Open-Meteo (non-commercial), NOAA's GHCN files and Meteostat need no key.