
Reanalysis vs Weather Station Data, Explained
On this page
Problem statement
Historical weather comes in two very different forms. Station data is what an instrument measured at one place: precise, local, and full of gaps and changes. Reanalysis, such as ERA5, is a weather model re-run over the past with every observation fed in, giving complete, consistent values on a grid, as averages over cells tens of kilometres wide. Both are called "historical weather", both answer in °C and mm, and they can disagree by several degrees or several centimetres of rain on a given day. Choosing between them depends on the question.
This page compares a year of daily weather at Washington Reagan National Airport from both sources: the station's GHCN-Daily record and ERA5 from the Open-Meteo archive. It measures how far they differ on average, on extremes and on rainfall, and draws out when each is the right tool.
Quick answer
Compare the two daily series directly:
J = pd.DataFrame({"sta_tmax": G.TMAX, "era_tmax": E.temperature_2m_max, "sta_tmin": G.TMIN, "era_tmin": E.temperature_2m_min,
                  "sta_prcp": G.PRCP, "era_prcp": E.precipitation_sum}).dropna()
for v in ("tmax", "tmin"):
    d = J[f"era_{v}"] - J[f"sta_{v}"]
    print(f"{v}: ERA5 minus station mean {d.mean():+.2f} °C, mean absolute difference {d.abs().mean():.2f} °C, correlation {J[f'era_{v}'].corr(J[f'sta_{v}']):.3f}")
print(f"days compared: {len(J)}")
tmax: ERA5 minus station mean -0.70 °C, mean absolute difference 0.94 °C, correlation 0.996
tmin: ERA5 minus station mean -0.98 °C, mean absolute difference 1.36 °C, correlation 0.987
days compared: 365
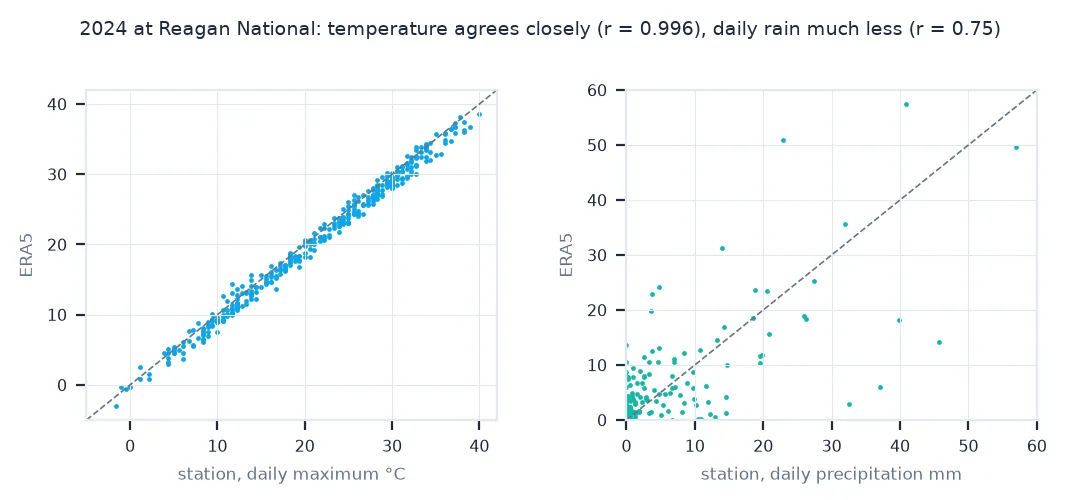
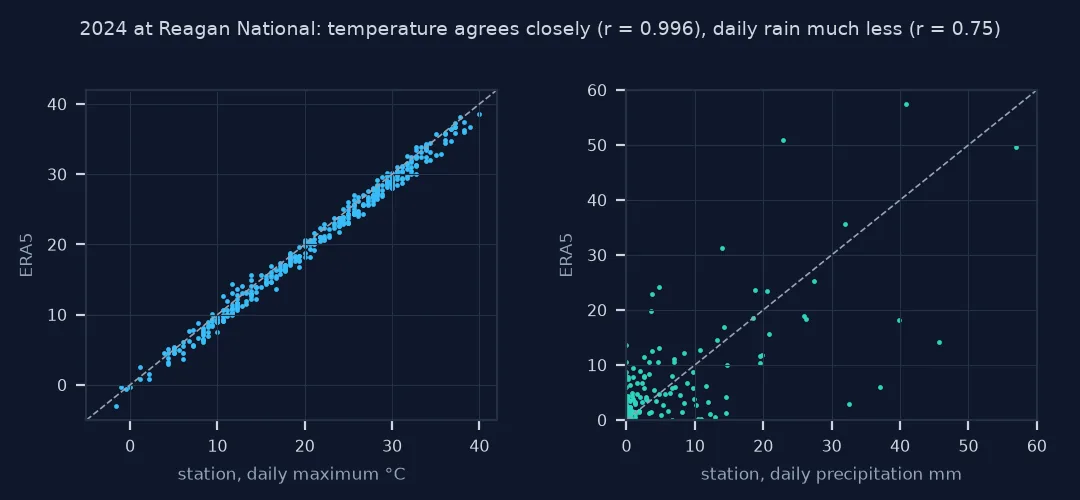
Day to day the two track each other closely, with correlations of 0.996 for the maximum and 0.987 for the minimum. ERA5 is consistently cooler, by 0.70 °C in the maximum and 0.98 °C in the minimum, and differs by about 1 °C on a typical day.
Extremes, rainfall, unusual stations
1. Extremes
Reanalysis is a cell average, so it should damp extremes. Compare the hottest and coldest days:
print(f"hottest day: station {J.sta_tmax.max():.1f} °C, ERA5 {J.era_tmax.max():.1f} °C; days at or above 35 °C: station {(J.sta_tmax >= 35).sum()}, ERA5 {(J.era_tmax >= 35).sum()}")
print(f"coldest night: station {J.sta_tmin.min():.1f} °C, ERA5 {J.era_tmin.min():.1f} °C; nights at or below 0 °C: station {(J.sta_tmin <= 0).sum()}, ERA5 {(J.era_tmin <= 0).sum()}")
hottest day: station 40.0 °C, ERA5 38.6 °C; days at or above 35 °C: station 20, ERA5 15
coldest night: station -8.8 °C, ERA5 -9.4 °C; nights at or below 0 °C: station 37, ERA5 49
At the extremes the gap widens. The station's hottest day was 40.0 °C, ERA5's 38.6 °C, and the station had 20 days of 35 °C or more against ERA5's 15. In winter ERA5 is colder, with 49 freezing nights against the station's 37, consistent with an urban airport that stays warmer at night than the cell average.
2. Rainfall
Precipitation is where the two differ most, because reanalysis models rain rather than measuring it:
print(f"annual total: station {J.sta_prcp.sum():.0f} mm, ERA5 {J.era_prcp.sum():.0f} mm")
print(f"wet days (>= 1 mm): station {(J.sta_prcp >= 1).sum()}, ERA5 {(J.era_prcp >= 1).sum()}; daily correlation {J.sta_prcp.corr(J.era_prcp):.2f}")
big = J.sta_prcp.nlargest(3)
print("station's wettest days and ERA5 on those days:", {d.strftime('%d %b'): (round(float(v), 1), round(float(J.era_prcp[d]), 1)) for d, v in big.items()})
annual total: station 955 mm, ERA5 1044 mm
wet days (>= 1 mm): station 91, ERA5 123; daily correlation 0.75
station's wettest days and ERA5 on those days: {'09 Jan': (56.9, 49.7), '09 Aug': (45.7, 14.1), '23 Mar': (40.9, 57.5)}
ERA5 put down 1,044 mm against the gauge's 955 mm, spread over many more wet days, 123 against 91, which is typical of models that drizzle too often. Daily totals correlate at only 0.75. On the station's three wettest days, ERA5 was close on 9 January, 49.7 against 56.9 mm, far too low on 9 August, 14.1 against 45.7 mm, and too high on 23 March.
3. Where the station is unusual
The airport sits on the river in a city. The diurnal range shows how the cell differs from that spot:
print(f"mean daily range: station {(J.sta_tmax - J.sta_tmin).mean():.1f} °C, ERA5 {(J.era_tmax - J.era_tmin).mean():.1f} °C")mean daily range: station 9.4 °C, ERA5 9.7 °C
The mean daily range is similar, 9.4 °C at the station and 9.7 °C in ERA5. The cell is cooler at both ends of the day, not flatter.
Monthly means agree better than days
The data used on this page
The 2024 daily record of Washington Reagan National Airport from NOAA's GHCN-Daily (USW00013743), and ERA5 daily values for the same coordinates from the Open-Meteo archive with models=era5, in local days.
import hashlib
import json
from pathlib import Path

import pandas as pd
import requests

Path("data").mkdir(exist_ok=True)
CSV = Path("data/USW00013743.csv")
if not CSV.exists():
    r = requests.get("https://www.ncei.noaa.gov/data/global-historical-climatology-network-daily/access/USW00013743.csv", timeout=600); r.raise_for_status(); CSV.write_bytes(r.content)
G = pd.read_csv(CSV, usecols=["DATE", "TMAX", "TMIN", "PRCP"], parse_dates=["DATE"]).set_index("DATE").loc["2024"] / 10
params = {"latitude": 38.8472, "longitude": -77.0345, "start_date": "2024-01-01", "end_date": "2024-12-31", "models": "era5",
          "daily": "temperature_2m_max,temperature_2m_min,precipitation_sum", "timezone": "America/New_York"}
f = Path("data/om_" + hashlib.md5(json.dumps(params, sort_keys=True).encode()).hexdigest() + ".json")
if not f.exists():
    r = requests.get("https://archive-api.open-meteo.com/v1/archive", params=params, timeout=300); r.raise_for_status(); f.write_text(r.text)
E = pd.DataFrame(json.loads(f.read_text())["daily"]).assign(time=lambda d: pd.to_datetime(d.time)).set_index("time")
print(f"station days {len(G)}, ERA5 days {len(E)}")
station days 366, ERA5 days 366
Both series cover all 366 days of 2024.
Example 1: monthly means agree better than days
Averaging removes much of the day-to-day disagreement:
Mo = J.resample("MS").mean()
print(f"monthly tmax: mean absolute difference {(Mo.era_tmax - Mo.sta_tmax).abs().mean():.2f} °C (daily: {(J.era_tmax - J.sta_tmax).abs().mean():.2f} °C)")
Ms = J.resample("MS").sum()
print(f"monthly precipitation: mean absolute difference {(Ms.era_prcp - Ms.sta_prcp).abs().mean():.0f} mm; correlation {Ms.era_prcp.corr(Ms.sta_prcp):.2f}")
monthly tmax: mean absolute difference 0.70 °C (daily: 0.94 °C)
monthly precipitation: mean absolute difference 21 mm; correlation 0.83
Averaged by month, the maximum-temperature difference falls from 0.94 to 0.70 °C, and monthly precipitation agrees to within 21 mm on average, with a correlation of 0.83: much better than day by day.
A point measurement against a cell average
A weather station measures a point: air temperature in a shelter 2 m above a particular patch of ground, rain in a particular gauge. Its strength is that it is a direct measurement. Its weaknesses are the gaps, the changes when instruments or surroundings change, and that one point represents itself, not the region. A reanalysis starts from a weather model and continuously corrects it with observations from stations, balloons, aircraft and satellites, so the result fills every hour and every grid cell consistently. Its values are cell averages, about 25 km across for ERA5. They cannot reproduce what makes one spot special, a city's warmth, a river's cooling, a hill's shelter, and they model precipitation rather than observing it.
So the two agree best where the question is large-scale and averaged, such as monthly temperatures, trends and the pattern of a heat wave, and worst where it is local and extreme, such as the hottest afternoon at an airport or the rain in one storm. Use stations for local records, extremes, compliance and anything that must match official statistics. Use reanalysis for places without stations, for complete and consistent series, for gridded maps, and as the common reference when comparing regions. When both are available, the difference between them is itself informative: a persistent offset often says more about the station's surroundings than about either dataset's quality.
Representativeness, station changes and bias correction
- Representativeness: a 0.25° cell over a coast mixes land and sea; prefer ERA5-Land or check the cell's land fraction.
- Station changes: reanalysis assimilates stations, so a station error can leak in, but it is diluted by everything else.
- Bias correction: impact studies often correct reanalysis against stations, for example by quantile mapping.
- Higher resolution: regional reanalyses (CERRA in Europe, NARR in North America) and ERA5-Land reduce the scale gap.
Internal links
- How to get ERA5 reanalysis data in Python — the reanalysis
- How to get NOAA GHCN daily weather station data in Python — the station
- Weather data sources explained — the wider choice
FAQ
What is the difference between reanalysis and station data?
Station data is a direct measurement at one point; reanalysis is a model run over the past, constrained by observations, giving complete grid-cell averages.
Is ERA5 accurate?
For temperature on large scales and averages, very; for local extremes and daily precipitation at a point, much less.
When should I use station data instead of ERA5?
For local records and extremes, official statistics, and anything that must match measurements at a site.
Why does ERA5 differ from my local weather station?
ERA5 averages a 25 km cell and models rain; the station measures one spot with its own surroundings.