
How to Calculate Temperature Anomalies in Python
On this page
Problem statement
"This July was 1.5 °C warmer than normal" is a temperature anomaly: the difference between an observed value and a baseline average for the same place and time of year. Anomalies remove the seasonal cycle, so a warm January and a warm July can be compared, and they let places with very different climates be put on one map. Computing them is simple arithmetic, but the result depends on choices that are easy to leave unstated: the baseline period, daily or monthly resolution, and whether the baseline is smooth.
This page computes daily and monthly temperature anomalies for Washington, D.C. from the GHCN-Daily record at Reagan National Airport against a 1991-2020 baseline. It finds the most anomalous days and months of 2024, shows how much the choice of baseline period moves the numbers, and builds the year-by-year anomaly series back to 1940.
Quick answer
Build a day-of-year baseline from 1991-2020, then subtract it:
tavg = (G.TMAX + G.TMIN) / 2
base = tavg.loc["1991":"2020"]
clim = base.groupby(base.index.dayofyear).mean().rolling(31, center=True, min_periods=1).mean()      # smoothed daily normal
anom = tavg - clim.reindex(tavg.index.dayofyear).values
a24 = anom.loc["2024"]
print(f"2024 mean anomaly {a24.mean():+.2f} °C; days above normal {(a24 > 0).mean():.0%}")
print(f"warmest relative to normal: {a24.idxmax():%d %b} ({a24.max():+.1f} °C); coldest: {a24.idxmin():%d %b} ({a24.min():+.1f} °C)")
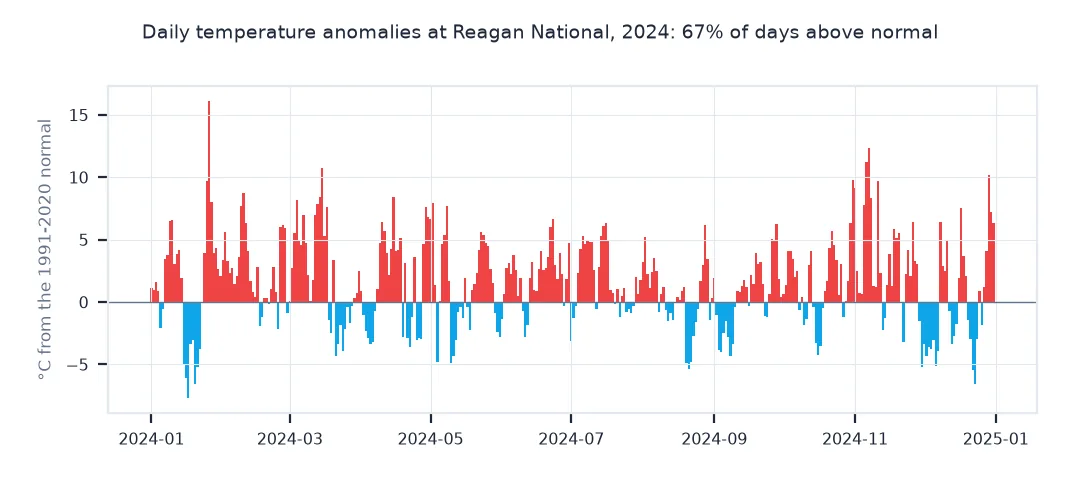
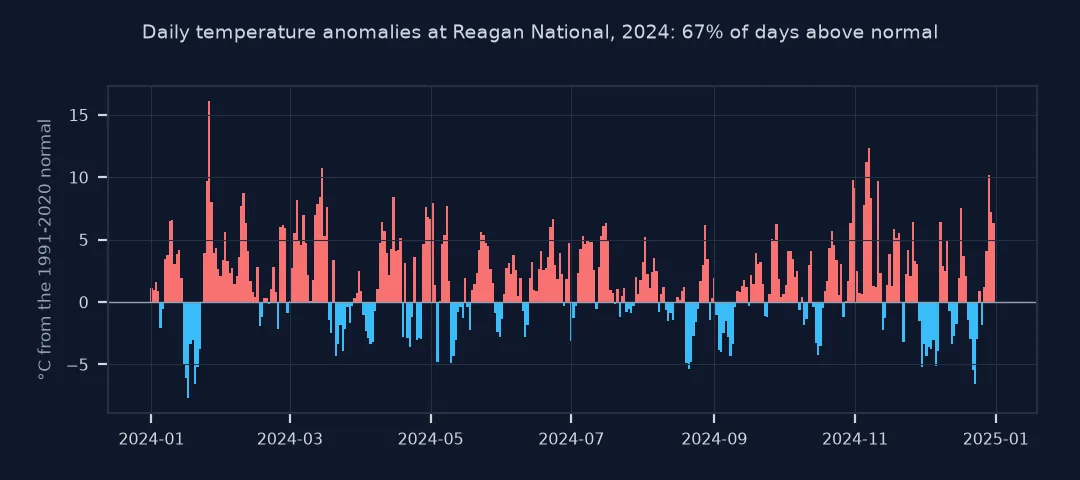
2024 mean anomaly +1.60 °C; days above normal 67%
warmest relative to normal: 26 Jan (+16.1 °C); coldest: 17 Jan (-7.7 °C)
2024 averaged 1.60 °C above the 1991-2020 normal, and 67% of its days were warmer than normal. The largest positive anomaly was 26 January, 16.1 °C above normal for the date. The largest negative one came nine days earlier, 17 January, at 7.7 °C below.
Monthly anomalies, baseline effects, the series since 1940
1. Monthly anomalies
monthly = anom.loc["2024"].resample("MS").mean()
monthly.index = monthly.index.strftime("%b")
print(monthly.round(2).to_dict())
print(f"warmest month relative to normal: {monthly.idxmax()} ({monthly.max():+.2f} °C)")
{'Jan': 1.47, 'Feb': 2.56, 'Mar': 2.37, 'Apr': 1.47, 'May': 1.37, 'Jun': 2.12, 'Jul': 1.89, 'Aug': 0.42, 'Sep': 0.53, 'Oct': 1.63, 'Nov': 3.27, 'Dec': 0.16}
warmest month relative to normal: Nov (+3.27 °C)
Every month of 2024 was above normal. November was the most anomalous at +3.27 °C, while August (+0.42 °C) and December (+0.16 °C) were close to normal.
2. The baseline changes the answer
Recompute the 2024 anomaly against three 30-year baselines:
for a, b in (("1951", "1980"), ("1961", "1990"), ("1991", "2020")):
    bb = tavg.loc[a:b]
    c = bb.groupby(bb.index.dayofyear).mean().rolling(31, center=True, min_periods=1).mean()
    print(f"baseline {a}-{b}: 2024 anomaly {(tavg.loc['2024'] - c.reindex(tavg.loc['2024'].index.dayofyear).values).mean():+.2f} °C")
baseline 1951-1980: 2024 anomaly +2.36 °C
baseline 1961-1990: 2024 anomaly +2.23 °C
baseline 1991-2020: 2024 anomaly +1.60 °C
The same year is +2.36 °C against 1951-1980, +2.23 °C against 1961-1990 and +1.60 °C against 1991-2020. The baseline alone moves the headline number by three quarters of a degree.
3. The anomaly series since 1940
yearly = anom.loc["1940":"2024"].groupby(anom.loc["1940":"2024"].index.year).agg(["mean", "count"])
yearly = yearly[yearly["count"] >= 360]["mean"]
print(f"years: {len(yearly)}; warmest {yearly.idxmax()} ({yearly.max():+.2f} °C), coldest {yearly.idxmin()} ({yearly.min():+.2f} °C)")
print(f"years above the 1991-2020 normal: 1940-1979 {(yearly.loc[:1979] > 0).sum()} of {len(yearly.loc[:1979])}; 2000-2024 {(yearly.loc[2000:] > 0).sum()} of {len(yearly.loc[2000:])}")
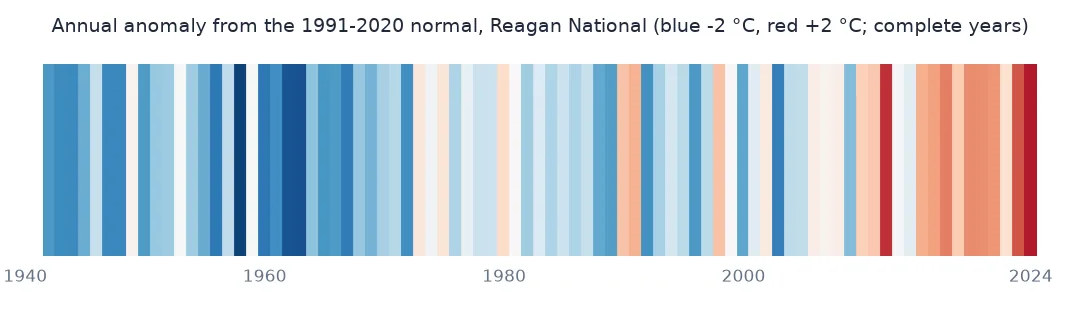
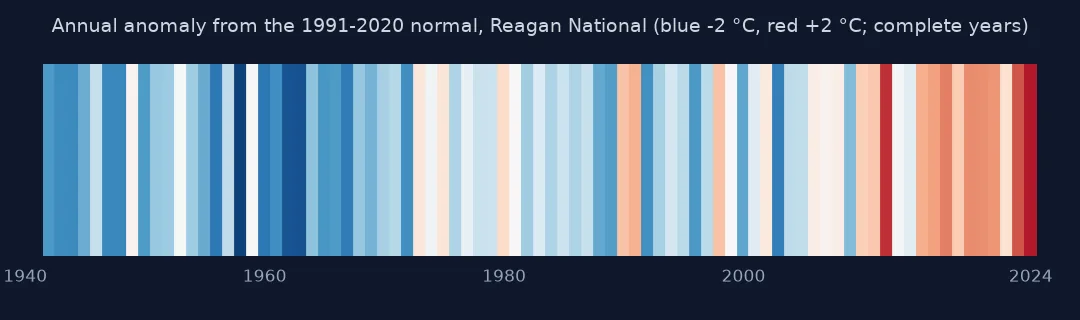
years: 83; warmest 2024 (+1.60 °C), coldest 1958 (-1.87 °C)
years above the 1991-2020 normal: 1940-1979 3 of 38; 2000-2024 17 of 25
Of 83 complete years, 2024 is the warmest, at +1.60 °C, and 1958 the coldest, at −1.87 °C. Only 3 of the 38 complete years from 1940 to 1979 were above the 1991-2020 normal, against 17 of the 25 years since 2000.
Smoothing the baseline
The data used on this page
The GHCN-Daily record for USW00013743, Washington Reagan National Airport, from NOAA's National Centers for Environmental Information, converted from tenths of °C. Daily mean temperature is taken as the average of the maximum and minimum.
from pathlib import Path

import numpy as np
import pandas as pd
import requests

Path("data").mkdir(exist_ok=True)
CSV = Path("data/USW00013743.csv")
if not CSV.exists():
    r = requests.get("https://www.ncei.noaa.gov/data/global-historical-climatology-network-daily/access/USW00013743.csv", timeout=600)
    r.raise_for_status()
    CSV.write_bytes(r.content)
G = pd.read_csv(CSV, usecols=["DATE", "TMAX", "TMIN"], parse_dates=["DATE"]).set_index("DATE").loc[:"2024-12-31"] / 10
print(f"{len(G):,} days, {G.index.min():%Y} to {G.index.max():%Y}")
32,264 days, 1936 to 2024
The record has 32,264 days from 1936 to 2024.
Example 1: smoothing the baseline
Without smoothing, the 30-year mean for each calendar day is noisy. Measure how much the 31-day smoothing changes it:
raw = base.groupby(base.index.dayofyear).mean()
print(f"day-to-day change in the raw daily normal: mean {raw.diff().abs().mean():.2f} °C, largest {raw.diff().abs().max():.2f} °C")
print(f"after 31-day smoothing: mean {clim.diff().abs().mean():.2f} °C, largest {clim.diff().abs().max():.2f} °C")
day-to-day change in the raw daily normal: mean 0.49 °C, largest 2.04 °C
after 31-day smoothing: mean 0.13 °C, largest 0.26 °C
Unsmoothed, the daily normal jumps by 0.49 °C from one day to the next on average, and by up to 2.04 °C. After 31-day smoothing the steps are 0.13 °C on average, and at most 0.26 °C.
A departure from a reference climate
An anomaly is a departure from a reference climate. For temperature, the reference is usually the mean for the same place and calendar day or month over a 30-year baseline, and the anomaly is the observed value minus that mean. Subtracting the seasonal cycle turns a series dominated by summer and winter into one where warm and cold spells stand out at any time of year. That is also why anomalies average well across places: a mountain station and a coastal city have very different temperatures, but similar anomalies when the same air mass covers both.
The baseline has to be stated, because it changes the number. A warming climate makes recent baselines warmer, so the same year has a smaller anomaly against 1991-2020 than against 1951-1980. Global climate reports have used different baselines, 1951-1980, 1981-2010 and 1850-1900 for "pre-industrial", and their headline numbers differ for that reason alone. A daily baseline also needs smoothing, since 30 values per calendar day leave noise that would otherwise appear as spurious daily anomalies.
Leap days, incomplete baselines and daily means
- Leap days: day 366 has a quarter of the data; smoothing by day of year handles it, or drop 29 February.
- Incomplete baselines: if the baseline years have gaps, the climatology inherits a bias toward the seasons that were observed.
- Daily mean: (Tmax + Tmin) / 2 is the US convention; an average of hourly values differs slightly.
- Relative anomalies: for precipitation, express anomalies as a percentage of normal rather than a difference.
Internal links
- How to calculate climate normals in Python — the baseline in detail
- How to get NOAA GHCN daily weather station data in Python — the record used here
- How to make a sea surface temperature anomaly map in Python — anomalies on a grid
FAQ
How do I calculate a temperature anomaly in Python?
Compute a baseline mean for each calendar day or month over 30 years, smooth it, and subtract it from the observed values.
What baseline period should I use?
1991-2020 is the current WMO standard; state the baseline, since older ones give larger anomalies.
Why smooth the daily climatology?
Thirty values per calendar day are noisy; smoothing removes day-to-day noise that would show up as false anomalies.
What is the difference between an anomaly and an absolute temperature?
An anomaly is the difference from the place's normal, which removes the seasonal cycle and makes places and seasons comparable.