
How to Calculate Climate Normals in Python
On this page
Problem statement
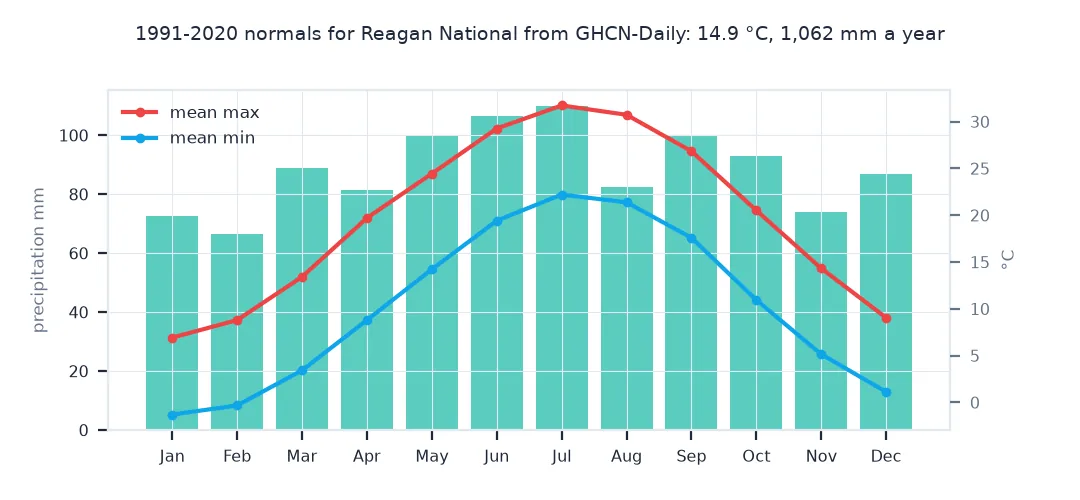
Reagan National Airport's GHCN-Daily record is a maximum, a minimum and a rainfall total for each day. Turning thirty of those years, 1991 to 2020, into a station's normals means averaging by month while skipping months with too many missing days, summing rain rather than averaging it, and fitting a smooth curve through the daily values for a normal of each day — then checking the result against the normals NOAA publishes for the same station, which fill gaps, adjust for station changes and come in °F and inches.
This page computes 1991-2020 normals for Washington Reagan National Airport from the station's GHCN-Daily record: monthly means and totals, and a smoothed daily curve. It compares them with NOAA's official 1991-2020 normals for the same station, and shows how the previous normal period, 1981-2010, differs.
Quick answer
Average 30 years of daily values by month, requiring enough days in each month:
base = G.loc["1991":"2020"]
monthly = base.groupby([base.index.year, base.index.month]).agg(tmax=("TMAX", "mean"), tmin=("TMIN", "mean"), prcp=("PRCP", "sum"), n=("TMAX", "count"))
ok = monthly[monthly.n >= 25]                                       # skip badly incomplete months
N = ok.groupby(level=1)[["tmax", "tmin", "prcp"]].mean()
N["tavg"] = (N.tmax + N.tmin) / 2
N.index = pd.to_datetime(N.index, format="%m").strftime("%b")
print(N.round(1).to_string())
print(f"annual: mean {N.tavg.mean():.1f} °C, precipitation {N.prcp.sum():.0f} mm; months used {len(ok)} of {len(monthly)}")
tmax tmin prcp tavg
DATE
Jan 6.9 -1.3 72.8 2.8
Feb 8.8 -0.3 66.4 4.2
Mar 13.4 3.4 88.9 8.4
Apr 19.7 8.8 81.5 14.3
May 24.5 14.2 100.2 19.3
Jun 29.3 19.4 106.7 24.3
Jul 31.7 22.2 109.9 27.0
Aug 30.7 21.4 82.6 26.1
Sep 26.8 17.6 99.8 22.2
Oct 20.5 10.9 92.9 15.7
Nov 14.3 5.1 73.8 9.7
Dec 9.0 1.1 86.7 5.1
annual: mean 14.9 °C, precipitation 1062 mm; months used 360 of 360
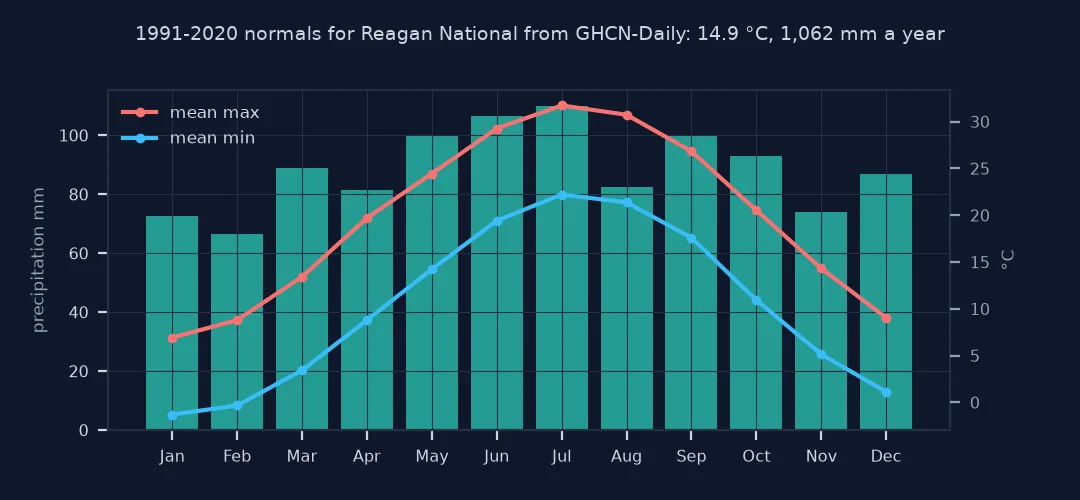
The 1991-2020 normal year at Reagan National runs from a January mean of 2.8 °C to a July mean of 27.0 °C, with 1,062 mm of precipitation. All 360 months of the period are complete enough to use.
The official normals, daily normals, changing normals
1. The official normals
NOAA's 1991-2020 normals for the station are a CSV in °F and inches. Convert and compare:
O = pd.read_csv(NORMALS_M)
O = O.assign(tavg=(O["MLY-TAVG-NORMAL"] - 32) * 5 / 9, tmax=(O["MLY-TMAX-NORMAL"] - 32) * 5 / 9, prcp=O["MLY-PRCP-NORMAL"] * 25.4)
cmp = pd.DataFrame({"ours tavg": N.tavg.values, "NOAA tavg": O.tavg.values, "ours prcp": N.prcp.values, "NOAA prcp": O.prcp.values}, index=N.index)
print(cmp.round(1).to_string())
print(f"largest difference: tavg {(cmp['ours tavg'] - cmp['NOAA tavg']).abs().max():.2f} °C, precipitation {(cmp['ours prcp'] - cmp['NOAA prcp']).abs().max():.1f} mm")
ours tavg NOAA tavg ours prcp NOAA prcp
DATE
Jan 2.8 3.1 72.8 72.6
Feb 4.2 4.4 66.4 66.5
Mar 8.4 8.7 88.9 88.9
Apr 14.3 14.6 81.5 81.5
May 19.3 19.6 100.2 100.1
Jun 24.3 24.6 106.7 106.7
Jul 27.0 27.2 109.9 110.0
Aug 26.1 26.3 82.6 82.6
Sep 22.2 22.4 99.8 99.8
Oct 15.7 16.0 92.9 93.0
Nov 9.7 9.9 73.8 73.9
Dec 5.1 5.4 86.7 86.6
largest difference: tavg 0.30 °C, precipitation 0.1 mm
Our precipitation normals match NOAA's to 0.1 mm in every month. Our temperatures run 0.2 to 0.3 °C below NOAA's in every month. An offset this consistent points to method rather than chance, such as NOAA's adjustments for the station's history.
2. Daily normals
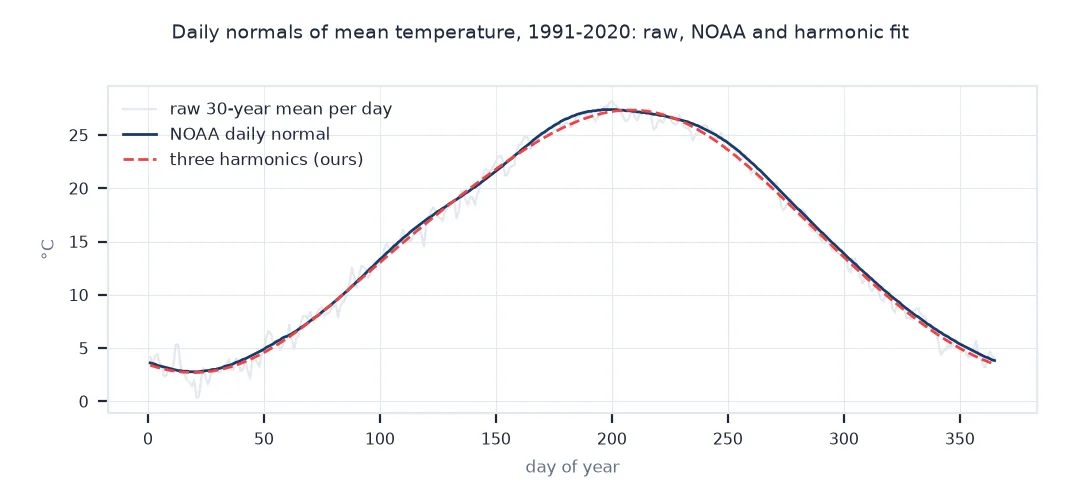
Daily averages over 30 years are noisy. Smooth them with harmonics of the annual cycle:
doy = base.index.dayofyear.values
tavg_day = ((base.TMAX + base.TMIN) / 2).values
mask = ~np.isnan(tavg_day)
t = 2 * np.pi * doy[mask] / 365.25
X = np.column_stack([np.ones(mask.sum())] + [f(k * t) for k in (1, 2, 3) for f in (np.sin, np.cos)])
coef, *_ = np.linalg.lstsq(X, tavg_day[mask], rcond=None)
tt = 2 * np.pi * np.arange(1, 366) / 365.25
curve = np.column_stack([np.ones(365)] + [f(k * tt) for k in (1, 2, 3) for f in (np.sin, np.cos)]) @ coef
print(f"smoothed daily normal: coldest day {curve.min():.1f} °C on day {curve.argmin() + 1}, warmest {curve.max():.1f} °C on day {curve.argmax() + 1}")
D = pd.read_csv(NORMALS_D)
noaa_daily = ((D["DLY-TAVG-NORMAL"] - 32) * 5 / 9).values[:365]
print(f"NOAA daily normal: coldest {noaa_daily.min():.1f} °C, warmest {noaa_daily.max():.1f} °C; mean absolute difference from ours {np.abs(curve - noaa_daily).mean():.2f} °C")
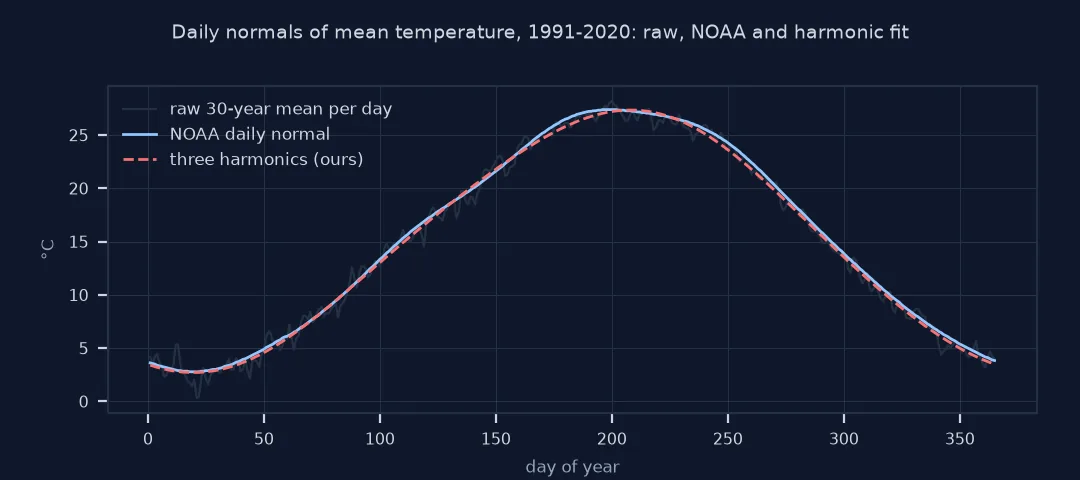
smoothed daily normal: coldest day 2.7 °C on day 20, warmest 27.3 °C on day 208
NOAA daily normal: coldest 2.8 °C, warmest 27.4 °C; mean absolute difference from ours 0.29 °C
The smoothed curve has its coldest day on 20 January at 2.7 °C, and its warmest on day 208, 27 July, at 27.3 °C. NOAA's daily normals give 2.8 and 27.4 °C, and differ from ours by 0.29 °C on average.
3. Normals change
Compare with the previous normal period:
def normal(a, b):
    x = G.loc[a:b]
    return ((x.TMAX + x.TMIN) / 2).mean(), x.PRCP.groupby(x.index.year).sum().mean()
for a, b in (("1961", "1990"), ("1981", "2010"), ("1991", "2020")):
    t, p = normal(a, b)
    print(f"{a}-{b}: mean {t:.2f} °C, precipitation {p:.0f} mm a year")
1961-1990: mean 14.35 °C, precipitation 981 mm a year
1981-2010: mean 14.61 °C, precipitation 1009 mm a year
1991-2020: mean 14.99 °C, precipitation 1062 mm a year
Each normal is warmer and wetter than the last: 14.35 °C and 981 mm for 1961-1990, 14.61 °C and 1,009 mm for 1981-2010, and 14.99 °C and 1,062 mm for 1991-2020.
How unusual 2024 was
The data used on this page
The GHCN-Daily record for USW00013743, Washington Reagan National Airport, and NOAA's U.S. Climate Normals 1991-2020, monthly and daily, for the same station, from NCEI.
from pathlib import Path

import numpy as np
import pandas as pd
import requests

Path("data").mkdir(exist_ok=True)
def cached(path, url):
    p = Path(path)
    if not p.exists():
        r = requests.get(url, timeout=600)
        r.raise_for_status()
        p.write_bytes(r.content)
    return p
CSV = cached("data/USW00013743.csv", "https://www.ncei.noaa.gov/data/global-historical-climatology-network-daily/access/USW00013743.csv")
NORMALS_M = cached("data/normals_monthly_USW00013743.csv", "https://www.ncei.noaa.gov/data/normals-monthly/1991-2020/access/USW00013743.csv")
NORMALS_D = cached("data/normals_daily_USW00013743.csv", "https://www.ncei.noaa.gov/data/normals-daily/1991-2020/access/USW00013743.csv")
G = pd.read_csv(CSV, usecols=["DATE", "TMAX", "TMIN", "PRCP"], parse_dates=["DATE"]).set_index("DATE").loc[:"2024-12-31"]
G[["TMAX", "TMIN", "PRCP"]] = G[["TMAX", "TMIN", "PRCP"]] / 10
print(f"GHCN record {G.index.min():%Y-%m-%d} to {G.index.max():%Y-%m-%d}")
GHCN record 1936-09-01 to 2024-12-31
The record used runs from 1 September 1936 to the end of 2024.
Example 1: how unusual was 2024?
Compare each month of 2024 with the normal we computed:
y = G.loc["2024"]
m24 = y.groupby(y.index.month).agg(tmax=("TMAX", "mean"), tmin=("TMIN", "mean"), prcp=("PRCP", "sum"))
anom = pd.DataFrame({"tavg anomaly °C": ((m24.tmax + m24.tmin) / 2).values - N.tavg.values, "precip % of normal": 100 * m24.prcp.values / N.prcp.values}, index=N.index)
print(anom.round(1).to_string())
print(f"2024 mean anomaly {anom['tavg anomaly °C'].mean():+.2f} °C; precipitation {m24.prcp.sum() / N.prcp.sum():.0%} of normal")
tavg anomaly °C precip % of normal
DATE
Jan 1.5 205.2
Feb 2.6 54.0
Mar 2.6 139.7
Apr 1.6 64.6
May 1.4 109.2
Jun 2.2 27.6
Jul 1.8 111.5
Aug 0.2 140.9
Sep 0.3 58.8
Oct 1.5 40.5
Nov 3.1 62.6
Dec 0.4 84.4
2024 mean anomaly +1.61 °C; precipitation 90% of normal
Every month of 2024 was warmer than the new normal, by 1.61 °C over the year. Precipitation swung from 205% of normal in January to 28% in June, and the year as a whole received 90% of the normal total.
Thirty-year averages, updated every ten
A climate normal is a 30-year average of a weather variable at a place, updated every ten years by convention of the World Meteorological Organization: 1991-2020 is the current standard period, replacing 1981-2010. Normals describe the climate a place has had, set the baseline for anomalies, and feed planning from heating-degree days to crop calendars. NOAA's official US normals are computed carefully. Missing values are estimated from neighbours, inhomogeneities from station moves and instrument changes are accounted for, precipitation normals use all available data in a defined way, and daily normals are smoothed with harmonic curves.
Normals computed straight from a station's daily file are close to the official ones where the record is complete, as Reagan National's is. Differences of a few tenths of a degree come from gap handling and adjustments, and precipitation differs more because totals are sensitive to missing days. The choice of period matters more. Each newer normal period is warmer than the last, so "above normal" against 1991-2020 is a higher bar than against 1981-2010, and any anomaly should state its baseline.
Incomplete months, precipitation and grids
- Incomplete months: require a minimum number of days (WMO guidance allows a few missing days per month) before including a month.
- Precipitation: never average monthly totals that are missing days; one missing wet day changes a total.
- Units: NOAA's normals files use °F and inches; GHCN uses tenths of °C and mm.
- Gridded normals: PRISM (US) and WorldClim (global) provide normals on grids for places without stations.
Internal links
- Climate normals explained — what normals are for
- How to calculate temperature anomalies in Python — anomalies against these normals
- How to get NOAA GHCN daily weather station data in Python — the daily record
FAQ
How do I calculate climate normals in Python?
Take 30 years of daily data (1991-2020), compute monthly means or totals for each year, skip badly incomplete months, and average each calendar month across the years.
What period are climate normals based on?
The current WMO standard period is 1991-2020; the previous one was 1981-2010.
Where can I download official climate normals?
NOAA publishes US normals by station on the NCEI website, as CSV files per station.
Why do my normals differ from the official ones?
Official normals fill gaps, adjust for station changes and smooth daily values; raw averages differ slightly, precipitation most.