
How to Get NOAA GHCN Daily Weather Station Data in Python
On this page
Problem statement
The Global Historical Climatology Network Daily (GHCN-Daily) from NOAA is the largest open archive of daily station observations: over 100,000 stations, some with records from the 19th century, with daily maximum and minimum temperature, precipitation, snowfall and snow depth. Every station has its own CSV file on NOAA's server, so no API key or download form is needed. The files have quirks, though. Values are stored in tenths of a unit, each value carries a three-part flag string, and the columns vary from station to station.
This page reads the GHCN-Daily file for Washington Reagan National Airport, converts the values to °C and mm, decodes the quality flags, and summarises a record that starts in 1936: the hottest days, the wettest year and the warming trend.
Quick answer
Read the station's CSV, keep the core elements and divide by ten:
G = pd.read_csv(CSV, usecols=["DATE", "TMAX", "TMIN", "PRCP", "SNOW", "TMAX_ATTRIBUTES", "PRCP_ATTRIBUTES"], parse_dates=["DATE"], low_memory=False).set_index("DATE").loc[:"2024-12-31"]
for col in ("TMAX", "TMIN", "PRCP"):
    G[col] = G[col] / 10                                             # tenths of °C and tenths of mm
print(f"{len(G):,} days from {G.index.min():%Y-%m-%d} to {G.index.max():%Y-%m-%d}")
print(f"record high {G.TMAX.max():.1f} °C on {G.TMAX.idxmax():%d %b %Y}; record low {G.TMIN.min():.1f} °C on {G.TMIN.idxmin():%d %b %Y}")
32,264 days from 1936-09-01 to 2024-12-31
record high 40.6 °C on 17 Aug 1997; record low -20.6 °C on 17 Jan 1982
Up to the end of 2024 the record covers 32,264 days from 1 September 1936. The record high is 40.6 °C, on 17 August 1997, and the record low −20.6 °C, on 17 January 1982.
The units, the flags, a summary of the record
1. The units
GHCN stores temperature in tenths of °C and precipitation in tenths of mm; snowfall and snow depth are in whole millimetres. Check one day against the raw file:
raw = pd.read_csv(CSV, usecols=["DATE", "TMAX", "PRCP"], dtype={"TMAX": "Int64", "PRCP": "Int64"}).set_index("DATE")
print(f"raw values for 2024-07-15: TMAX {raw.loc['2024-07-15', 'TMAX']}, PRCP {raw.loc['2024-07-15', 'PRCP']}; converted {G.loc['2024-07-15', 'TMAX']} °C, {G.loc['2024-07-15', 'PRCP']} mm")
raw values for 2024-07-15: TMAX 389, PRCP 0; converted 38.9 °C, 0.0 mm
On 15 July 2024 the file stores 389 for the maximum, which is 38.9 °C, and 0 for precipitation.
2. The flags
Each _ATTRIBUTES value has three parts: measurement flag, quality flag and source flag. A non-empty quality flag means the value failed a check:
attr = G.TMAX_ATTRIBUTES.fillna(",,").str.split(",", expand=True)
attr.columns = ["measurement", "quality", "source"]
print("quality flags on TMAX:", attr.quality.replace("", "(none)").value_counts().head(5).to_dict())
print("source flags on TMAX:", attr.source.value_counts().head(5).to_dict())
quality flags on TMAX: {'(none)': 32264}
source flags on TMAX: {'0': 22794, 'W': 4293, 'X': 1932, '': 1749, 'Z': 1496}
None of the 32,264 TMAX values carries a quality flag in this file. The source flags show where the values came from: mostly 0, US cooperative summaries of the day, then W, WBAN/ASOS daily summaries, and X, first-order station summaries.
3. A summary of the record
full = G.loc["1937":"2024"]
yearly = full.groupby(full.index.year).agg(tmax=("TMAX", "mean"), tmin=("TMIN", "mean"), prcp=("PRCP", "sum"), days=("TMAX", "count"))
ok = yearly[yearly.days >= 360]
print(f"complete years: {len(ok)} of {len(yearly)}; wettest {ok.prcp.idxmax()} ({ok.prcp.max():.0f} mm), driest {ok.prcp.idxmin()} ({ok.prcp.min():.0f} mm)")
print(f"days at or above 35 °C per year: 1940s {(full.loc['1940':'1949'].TMAX >= 35).sum() / 10:.1f}, 2015-2024 {(full.loc['2015':'2024'].TMAX >= 35).sum() / 10:.1f}")
slope = np.polyfit(ok.index, (ok.tmax + ok.tmin) / 2, 1)[0]
print(f"trend in annual mean of daily max and min: {slope * 10:+.2f} °C per decade")
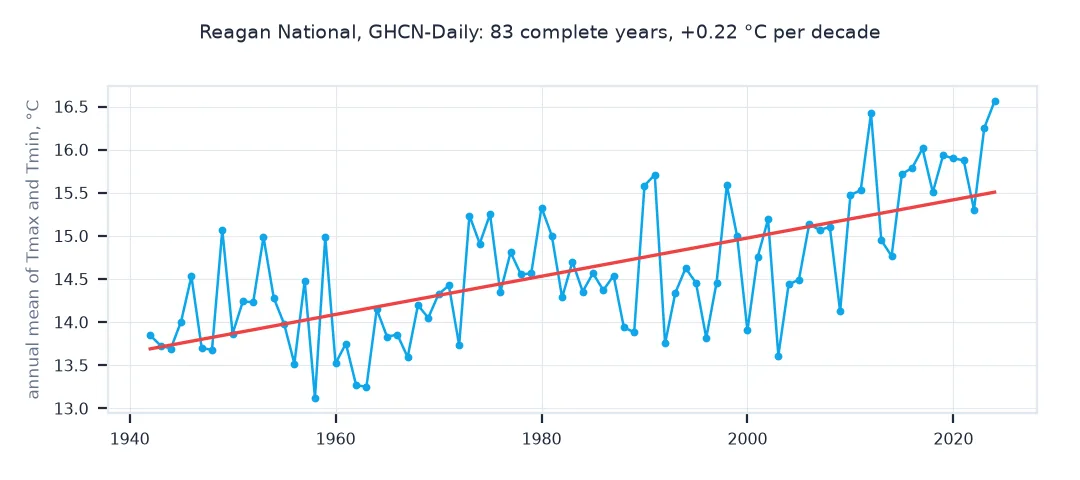
complete years: 83 of 88; wettest 2018 (1684 mm), driest 1965 (685 mm)
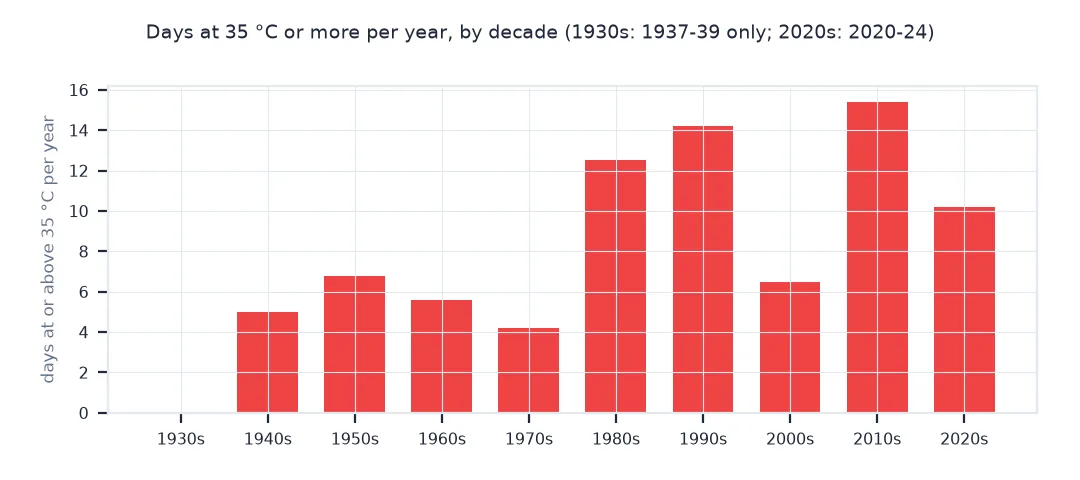
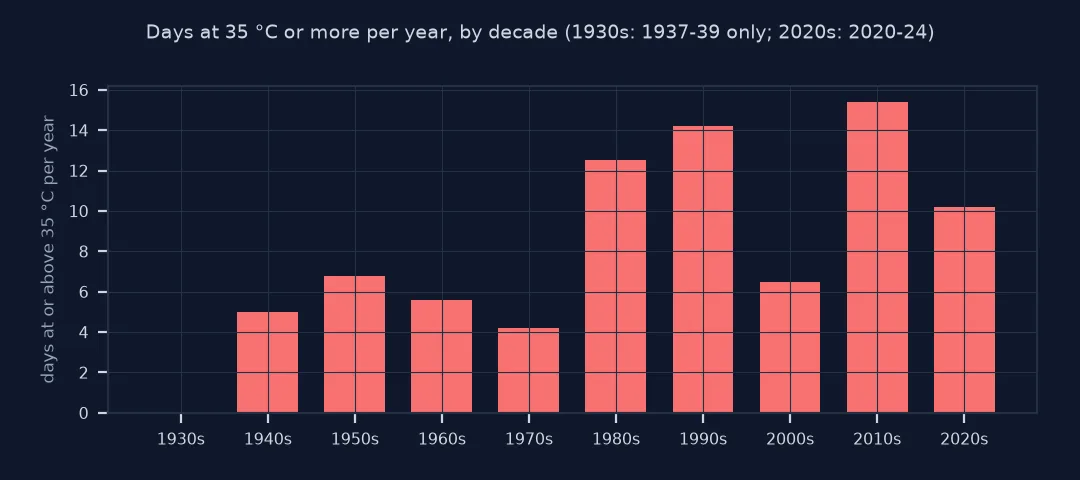
days at or above 35 °C per year: 1940s 5.0, 2015-2024 11.2
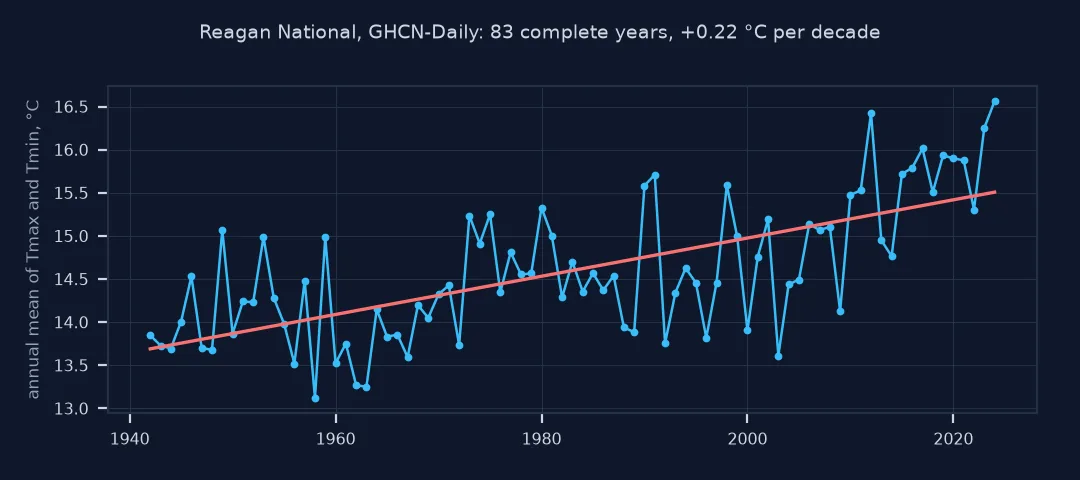
trend in annual mean of daily max and min: +0.22 °C per decade
83 of the 88 years from 1937 to 2024 are complete. The wettest was 2018 with 1,684 mm, and the driest 1965 with 685 mm. Days of 35 °C or more have more than doubled, from 5.0 a year in the 1940s to 11.2 in 2015-2024, and the annual mean temperature has risen by 0.22 °C per decade.
The hottest days at Washington Reagan
The data used on this page
The GHCN-Daily access file for station USW00013743, Washington Reagan National Airport, from NOAA's National Centers for Environmental Information. The file is updated daily; this page uses the record up to 31 December 2024.
from pathlib import Path

import numpy as np
import pandas as pd
import requests

Path("data").mkdir(exist_ok=True)
CSV = Path("data/USW00013743.csv")
if not CSV.exists():
    r = requests.get("https://www.ncei.noaa.gov/data/global-historical-climatology-network-daily/access/USW00013743.csv", timeout=600)
    r.raise_for_status()
    CSV.write_bytes(r.content)
head = pd.read_csv(CSV, nrows=1)
print(f"station {head.STATION[0]}: {head.NAME[0]}; {head.shape[1]} columns in the file")
station USW00013743: WASHINGTON REAGAN NATIONAL AIRPORT, VA US; 114 columns in the file
The file names the station, Washington Reagan National Airport, and has 114 columns, most of them elements recorded only some of the time.
Example 1: the hottest days
top = G.loc[:"2024"].TMAX.nlargest(5)
print(top.to_string())
print(f"days at or above 37.8 °C (100 °F) since 1937: {(G.loc['1937':'2024'].TMAX >= 37.8).sum()}")
DATE
1997-08-17 40.6
2012-07-07 40.6
1988-07-16 40.0
2011-07-29 40.0
2012-06-29 40.0
days at or above 37.8 °C (100 °F) since 1937: 81
The two hottest days, 17 August 1997 and 7 July 2012, both reached 40.6 °C. 81 days have reached 100 °F (37.8 °C) since 1937.
NOAA's integrated daily archive
GHCN-Daily is NOAA's integrated archive of daily station data, assembled from national networks such as the US Cooperative Observer Program and the first-order stations at airports, and from international exchanges. It passes the data through an automated quality-control system. Each station's record is published as a CSV with one row per day and one column per element. TMAX, TMIN, PRCP, SNOW and SNWD are the core elements, and others such as average wind or weather types appear only where they were observed. Values are integers to avoid decimals in the original fixed-width format, so temperatures and precipitation are in tenths. The three flags record how a value was measured, whether it failed a quality check, and which source it came from.
That design makes GHCN reliable and easy to download, but the conversions must be done by hand. Forgetting to divide by ten makes a summer day 350 °C. Ignoring quality flags lets known-bad values into a record. Treating every year as complete hides gaps. With those handled, a single file gives a long daily history of a place, the basis for climate normals, records and trends.
Station inventories, bulk access and moves
- Station inventory:
ghcnd-stations.txtandghcnd-inventory.txtlist every station, its location and which elements it has for which years. - Bulk access: the full archive is also on AWS as open data (
noaa-ghcn-pds), as yearly and per-station files. - Station moves: airport stations moved several times in the early record; a move can shift a series without a flag.
- Units differ by product: the NOAA climate normals products use °F and inches, not GHCN's tenths of °C.
Internal links
- Fixing GHCN temperatures in tenths of a degree — the unit trap in detail
- How to calculate climate normals in Python — normals from the same station
- How to get weather station data with Meteostat in Python — a library that wraps GHCN and more
FAQ
How do I download NOAA weather station data in Python?
Read the station's CSV directly from https://www.ncei.noaa.gov/data/global-historical-climatology-network-daily/access/<STATION>.csv with pandas.
Why are GHCN temperatures so large?
They are stored in tenths of °C; divide by 10.
What do the GHCN attributes mean?
Three comma-separated flags: measurement, quality and source; a non-empty quality flag marks a value that failed quality control.
How do I find GHCN station IDs?
Search ghcnd-stations.txt on the NOAA server by name or location; airport first-order stations begin with USW.