
Fixing Gaps and Missing Values in Weather Station Data
On this page
Problem statement
Weather station records are never complete. Instruments fail, reports are lost and stations close, and the gaps appear in data as empty cells, NaN, sentinel values such as -9999, or days and hours that are simply absent. Code that ignores them produces totals that are too low, means biased toward the seasons that were observed, and plots that silently draw straight lines across months of nothing. Some variables, such as sunshine or snow depth, are missing at some stations for their entire history.
This page measures the gaps in a year of hourly and daily data for stations around Washington, D.C. from Meteostat. It counts what is missing in each variable, finds the runs of missing precipitation hours, compares how complete each variable is at four stations, and sets rules for when a day or a month is complete enough to use.
Quick answer
Reindex to the full expected time axis first, so absent rows become visible, then count what is missing in each variable:
full = pd.date_range("2024-01-01 00:00", "2024-12-31 23:00", freq="h")
h = H.reindex(full)
print(f"rows returned {len(H):,}; hours in the year {len(full):,}")
print("missing hours by variable:", h.isna().sum().to_dict())
rows returned 8,784; hours in the year 8,784
missing hours by variable: {'temp': 0, 'rhum': 0, 'prcp': 622, 'wspd': 0}
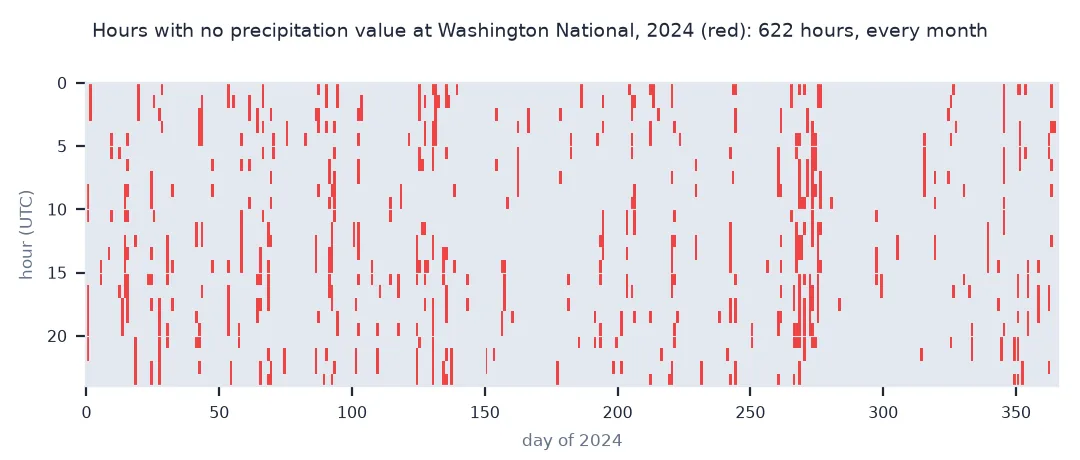
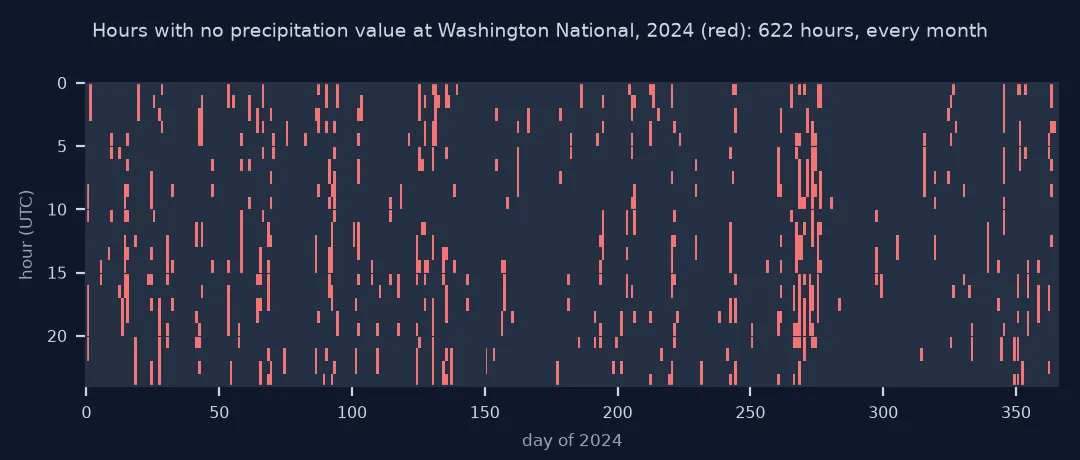
Every hour of the leap year is present as a row, and temperature, humidity and wind are complete. Precipitation is missing in 622 hours.
Gap lengths, missing variables, rules for complete days
1. The length of the gaps
Short gaps can sometimes be interpolated, long ones cannot. Find every run of missing precipitation hours:
miss = h.prcp.isna()
runs = (miss != miss.shift()).cumsum()[miss]
lengths = runs.value_counts()
print(f"precipitation gaps: {len(lengths)}; of 1 hour {(lengths == 1).sum()}, 2-3 hours {lengths.between(2, 3).sum()}, longer {(lengths > 3).sum()}; longest {lengths.max()} hours")
print(f"temperature, which changes smoothly, could be interpolated across short gaps: {h.temp.interpolate(limit=3, limit_area='inside').isna().sum()} hours would remain missing")
precipitation gaps: 335; of 1 hour 184, 2-3 hours 114, longer 37; longest 12 hours
temperature, which changes smoothly, could be interpolated across short gaps: 0 hours would remain missing
The 622 missing precipitation hours fall in 335 gaps: 184 of one hour, 114 of two or three, and 37 longer, the longest 12 hours. Temperature has nothing to fill. Rain cannot be interpolated whatever the gap length, since it falls in bursts.
2. Which variables are missing
Compare variable completeness across nearby stations for daily data:
rows = {}
for sid, name in STATIONS.items():
    d = ms.daily(sid, date(2024, 1, 1), date(2024, 12, 31)).fetch().reindex(pd.date_range("2024-01-01", "2024-12-31"))
    rows[name] = d.notna().mean().mul(100).round(0)
print(pd.DataFrame(rows).T[["tmin", "tmax", "prcp", "snwd", "wspd", "pres", "tsun"]].fillna(0).astype(int).to_string())
tmin tmax prcp snwd wspd pres tsun
Washington National 100 100 65 17 100 100 0
Andrews 100 100 59 0 100 100 0
Dulles 100 100 100 100 100 100 0
Baltimore-Washington 100 100 100 100 100 100 0
At all four stations, temperature, wind and pressure are complete and sunshine is absent. Precipitation is complete at Dulles and Baltimore-Washington but only 65% and 59% complete at Washington National and Andrews. Snow depth runs from complete to entirely missing.
3. Rules for complete days
Aggregate only days with every hour present:
hours = h.prcp.resample("D").count()
print(f"days with all 24 hours of precipitation: {(hours == 24).sum()} of {len(hours)}; days with none: {(hours == 0).sum()}")
monthly_ok = (hours == 24).resample("MS").sum()
print(f"months in which every day is complete: {(monthly_ok == monthly_ok.index.days_in_month).sum()} of 12")
days with all 24 hours of precipitation: 208 of 366; days with none: 0
months in which every day is complete: 0 of 12
Only 208 of 366 days have all 24 hours of precipitation, and not one month has every day complete. Yet no day is missing entirely, so a daily total looks plausible while silently omitting hours.
Missing is not zero
The data used on this page
Hourly and daily 2024 data from Meteostat (CC BY 4.0) for Washington National Airport (72405), Andrews (74594), Dulles (72403) and Baltimore-Washington (72406).
from datetime import date, datetime

import meteostat as ms
import pandas as pd

STATIONS = {"72405": "Washington National", "74594": "Andrews", "72403": "Dulles", "72406": "Baltimore-Washington"}
H = ms.hourly("72405", datetime(2024, 1, 1), datetime(2024, 12, 31, 23)).fetch()[["temp", "rhum", "prcp", "wspd"]]
print(f"{len(H):,} hourly rows for Washington National, 2024")
8,784 hourly rows for Washington National, 2024
Meteostat returns 8,784 hourly rows for 2024.
Example 1: missing is not zero
Precipitation is where gaps do the most damage. Compare a total that treats missing hours as dry with one restricted to complete days:
p = h.prcp
naive = p.sum()
day_ok = p.resample("D").count() == 24
complete_total = p.resample("D").sum()[day_ok].sum()
print(f"hours with no precipitation value: {p.isna().sum()}; naive annual sum {naive:.0f} mm; sum over the {day_ok.sum()} complete days {complete_total:.0f} mm")
hours with no precipitation value: 622; naive annual sum 825 mm; sum over the 208 complete days 39 mm
Treating the missing hours as dry gives 825 mm for the year. The 208 complete days hold only 39 mm. The missing hours fall mainly on rainy days, so leaving them out removes most of the year's rain. The official daily total for 2024, from GHCN, is 955 mm.
The forms missing data takes
Missing data in weather records comes in several forms. Values can be empty within a row, rows can be absent altogether when a report never arrived, and a variable can be missing for the whole record because the station never measured it. Older formats add sentinel values, such as -9999 in GHCN's fixed-width files or 9999 in ISD, that look like numbers until they wreck a mean. Absent rows are the most dangerous, because pandas never sees them: a resample or a plot just joins the neighbours. Reindexing to the full expected time axis turns them into explicit NaN values that can be counted.
What to do with the gaps depends on their length and on the variable. Temperature changes smoothly, so gaps of an hour or two can be interpolated with little error. Gaps of days cannot, and precipitation can never be interpolated, because rain is intermittent. The standard approach is to fill only short temperature gaps, and to require a minimum of data before aggregating, such as 20 hours for a day and every day for a monthly precipitation total. Reporting the completeness alongside the result lets readers judge it.
Sentinels, unmeasured variables and neighbours
- Sentinels: replace
-9999,9999or999.9withNaNbefore anything else; check each source's documentation for its codes. - Variables never measured: a column that is 100% missing at a station says nothing about the weather; drop it.
- Neighbour filling: long gaps can be filled from a nearby station with a regression, but mark the filled values.
- Accumulations: a missing precipitation report may be followed by an accumulated value covering several periods.
Internal links
- How to calculate monthly rainfall totals in Python — completeness for totals
- How to convert hourly weather data to daily in Python — minimum hours per day
- Fixing snow depth gaps and zeros — the same problem for snow
FAQ
How do I find missing hours in weather data?
Reindex the data to a complete hourly range with pd.date_range; absent hours become NaN and can be counted.
Should I interpolate missing weather data?
Only short temperature gaps (an hour or two); never precipitation, and never long gaps.
How many missing days make a month unusable?
For precipitation totals, any; for temperature means, a common rule allows only a few missing days.
Why does a station have no data for some variables?
Not every station measures everything; sunshine, snow depth and gusts are often never observed.