
How to Read NOAA's Storm Events Database in Python
On this page
Problem statement
NOAA's Storm Events Database is the official US record of damaging and notable weather: every tornado, hail report, flash flood, heat wave and blizzard that a National Weather Service office documented, with times, places, deaths, injuries and damage estimates. The bulk CSV for 2025 has 72,360 rows and 51 columns, and it is not ready to analyse as it arrives. Times are local to each county with a two-digit year, two-fifths of the rows have no coordinates because they describe a forecast zone rather than a point, and damage is stored as text such as 10.00K. This page reads the 2025 file into pandas, converts the times to UTC, builds a point layer from the events that have positions, and compares 2025 with 2024.
Quick answer
Download the year's StormEvents_details file from NCEI's bulk CSV directory and read it with pd.read_csv(..., low_memory=False). Then parse BEGIN_DATE_TIME with format="%d-%b-%y %H:%M:%S", subtract the hour offset in CZ_TIMEZONE to get UTC, convert the damage strings with their K/M/B multipliers, and build points from BEGIN_LAT/BEGIN_LON where they exist. The setup's times() and dollars() functions do all of that.
raw = pd.read_csv("data/storm-events-details-2025-c20260819.csv.gz", low_memory=False)
print(f"{len(raw):,} rows x {raw.shape[1]} columns")
print(raw.EVENT_TYPE.value_counts().head(6).to_string())
72,360 rows x 51 columns
EVENT_TYPE
Thunderstorm Wind 21807
Hail 9205
Flash Flood 5393
High Wind 4603
Winter Weather 4436
Drought 3283
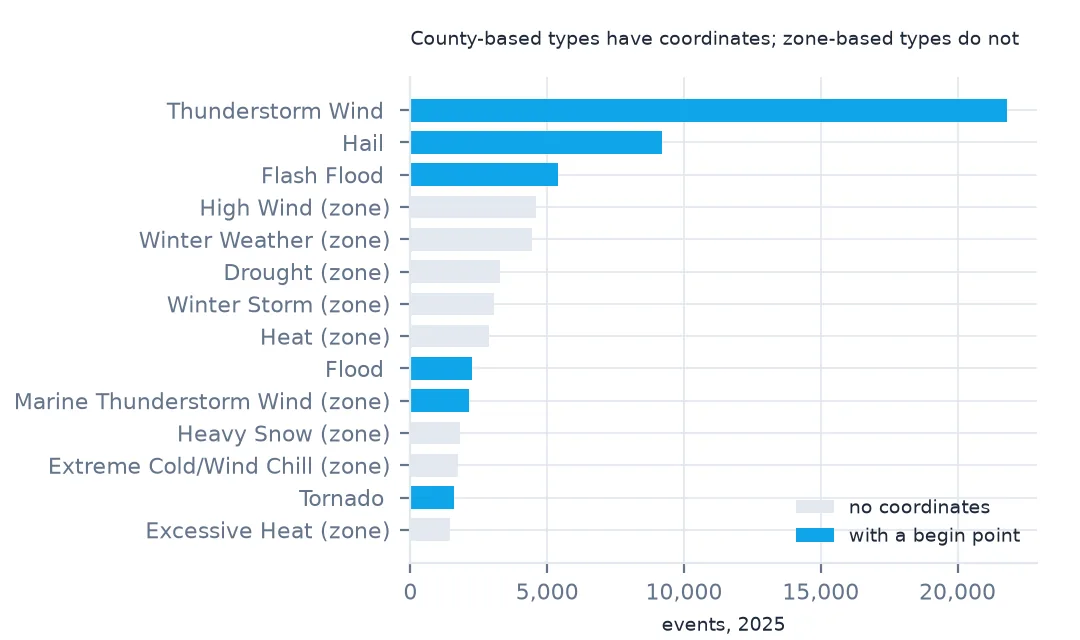
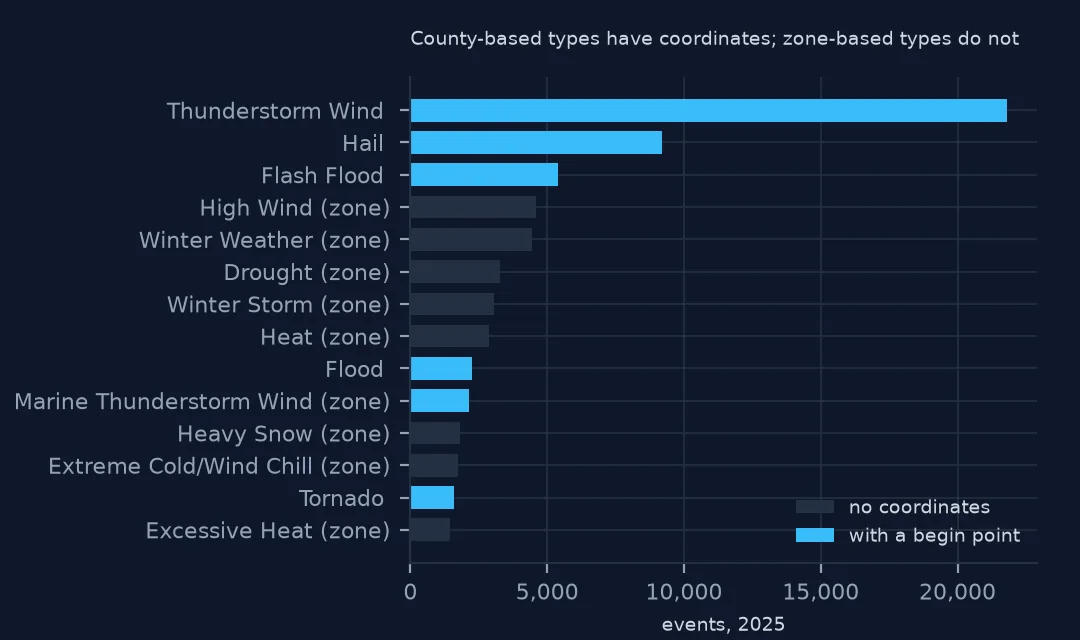
Thunderstorm wind is the most common event type, with 21,807 reports, ahead of hail (9,205) and flash floods (5,393). The list also includes drought and winter weather, which are reported by forecast zone and last for days or months.
Files, times, positions and damage
1. The files
fat = pd.read_csv("data/storm-events-fatalities-2025-c20260819.csv.gz")
print(f"details: {len(ev):,} events; fatalities: {len(fat):,} deaths, joined on EVENT_ID "
      f"({fat.EVENT_ID.isin(ev.EVENT_ID).mean():.0%} found)")
print("fields per event:", ", ".join(ev.columns[:12]), "...")
details: 72,360 events; fatalities: 895 deaths, joined on EVENT_ID (100% found)
fields per event: BEGIN_YEARMONTH, BEGIN_DAY, BEGIN_TIME, END_YEARMONTH, END_DAY, END_TIME, EPISODE_ID, EVENT_ID, STATE, STATE_FIPS, YEAR, MONTH_NAME ...
NCEI publishes three files per year. The details file holds one row per event. The fatalities file holds one row per death, with age, sex and where the person was, and every one of its 895 rows joins to a detail row through EVENT_ID. The locations file holds extra points along some events' paths. The details file is the one most analyses need.
2. Times are local, with a two-digit year
print(ev[["BEGIN_DATE_TIME", "CZ_TIMEZONE", "begin", "begin_utc"]].head(3).to_string(index=False))
print(ev.CZ_TIMEZONE.value_counts().to_dict())
BEGIN_DATE_TIME CZ_TIMEZONE begin begin_utc
31-MAR-25 11:04:00 EST-5 2025-03-31 11:04:00 2025-03-31 16:04:00
30-MAR-25 15:52:00 EST-5 2025-03-30 15:52:00 2025-03-30 20:52:00
05-JAN-25 18:00:00 EST-5 2025-01-05 18:00:00 2025-01-05 23:00:00
{'CST-6': 35400, 'EST-5': 24782, 'MST-7': 8601, 'PST-8': 2578, 'AST-4': 454, 'AKST-9': 253, 'HST-10': 126, 'SST-11': 93, 'GST10': 34, 'PDT-7': 30, 'EDT-4': 9}
31-MAR-25 11:04:00 is local standard time in the zone named beside it. EST-5 means five hours behind UTC, so the event began at 16:04 UTC. Eleven different zone labels appear, from SST-11 in American Samoa to GST10 on Guam, which is ten hours ahead of UTC and has no minus sign. A small number of rows are labelled with daylight time (PDT-7, EDT-4). Sort or bin by begin_utc when comparing places, and by the local begin for the hour of day.
3. Some events have coordinates, some only a zone
has_xy = ev.BEGIN_LAT.notna()
print(f"events with a begin point: {has_xy.mean():.1%}")
print(ev.groupby("CZ_TYPE").BEGIN_LAT.apply(lambda s: f"{s.notna().mean():.1%} with coordinates of {len(s):,}").to_string())
pts = gpd.GeoDataFrame(ev[has_xy], geometry=gpd.points_from_xy(ev.BEGIN_LON[has_xy], ev.BEGIN_LAT[has_xy]), crs=4326)
print(f"point layer: {len(pts):,} events")
events with a begin point: 60.7%
CZ_TYPE
C 99.7% with coordinates of 41,650
Z 7.8% with coordinates of 30,710
point layer: 43,917 events
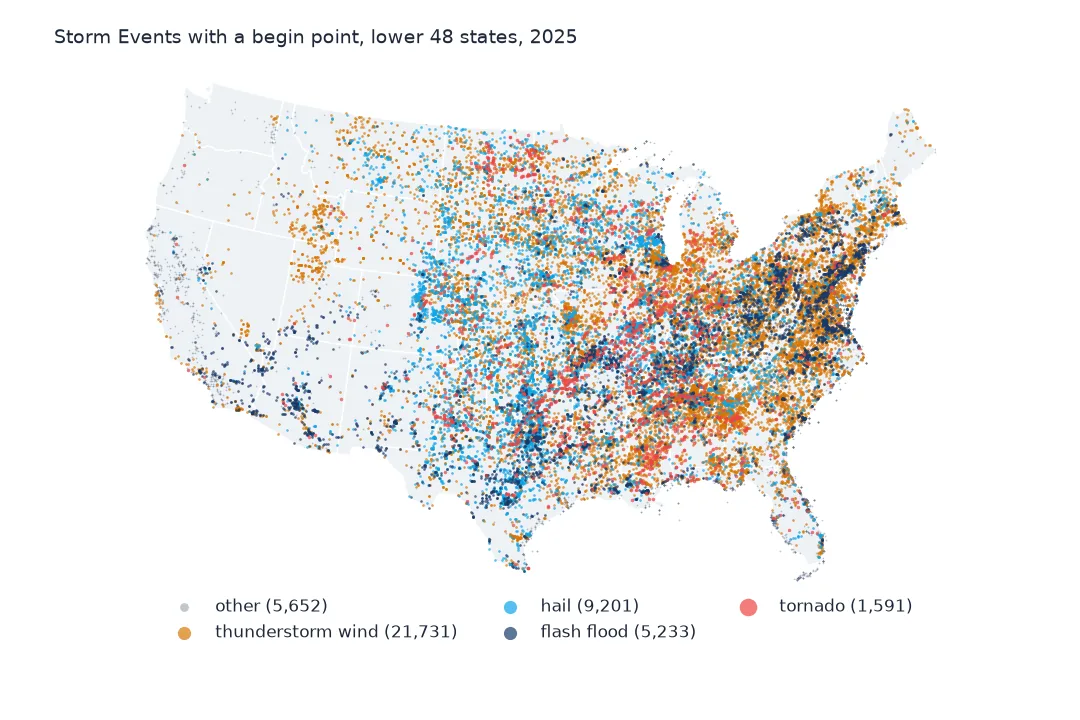
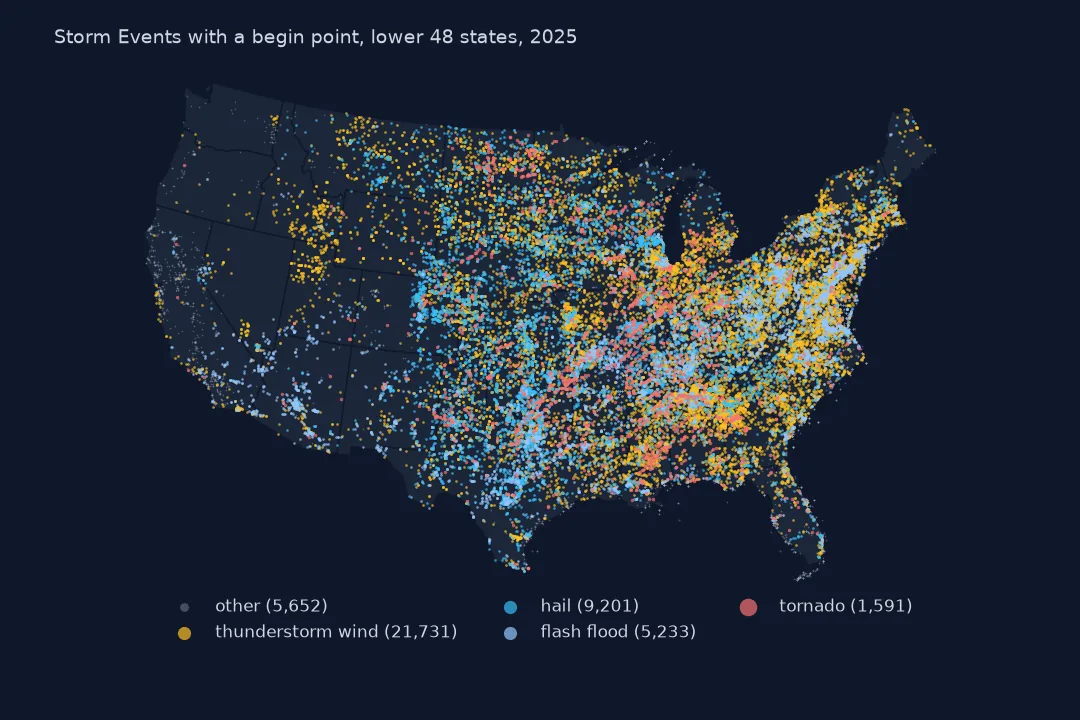
60.7% of events have a begin point. The split follows CZ_TYPE: 99.7% of county-based events (C: hail, tornadoes, thunderstorm wind, floods) carry coordinates, against 7.8% of zone-based ones (Z: heat, winter weather, high wind, drought). A point map of storm events is therefore a map of convective weather. Heat and snow appear only if you join the zone rows to zone boundaries.
4. Damage is text
print(ev.DAMAGE_PROPERTY.dropna().sample(5, random_state=1).tolist())
print(f"property damage reported: ${ev.prop.sum() / 1e9:.2f} billion; crops ${ev.crops.sum() / 1e9:.2f} billion; "
      f"blank property damage: {ev.DAMAGE_PROPERTY.isna().mean():.1%}")
['1.00K', '0.00K', '1.00K', '10.00K', '8.00K']
property damage reported: $4.50 billion; crops $0.27 billion; blank property damage: 22.7%
Damage arrives as strings such as 1.00K and must be parsed with its multiplier. Parsed, 2025 property damage sums to $4.50 billion and crop damage to $0.27 billion. 22.7% of rows have no property estimate at all, which is not the same as zero.
States, years and a point layer
The data used on this page
The National Centers for Environmental Information's Storm Events Database bulk CSV files for 2025 and 2024.
from pathlib import Path

import geopandas as gpd
import numpy as np
import pandas as pd
import requests

Path("data").mkdir(exist_ok=True)
# NOAA NCEI Storm Events Database: the 2025 details and fatalities files (revision c20260819) and the 2024 details file
# (revision c20260728), saved on this site on 15 October 2026 because NCEI replaces a year's files whenever it revises
# them and the old names disappear. Live: https://www.ncei.noaa.gov/pub/data/swdi/stormevents/csvfiles/
FILES = ["storm-events-details-2025-c20260819.csv.gz", "storm-events-fatalities-2025-c20260819.csv.gz",
         "storm-events-details-2024-c20260728.csv.gz"]
for name in FILES:
    if not Path(f"data/{name}").exists():
        Path(f"data/{name}").write_bytes(requests.get(f"https://data.spatialworkflow.io/{name}", timeout=600).content)
ev = pd.read_csv("data/storm-events-details-2025-c20260819.csv.gz", low_memory=False)


def dollars(s):
    """Damage is stored as text: '10.00K', '1.60B', '0' or blank. A blank means no estimate, not zero."""
    s = s.str.strip()
    return pd.to_numeric(s.str.rstrip("KMB"), errors="coerce") * s.str[-1].map({"K": 1e3, "M": 1e6, "B": 1e9}).fillna(1.0)


def times(df):
    """Event times are local to the county or zone ('CST-6'), with a two-digit year."""
    df["begin"] = pd.to_datetime(df.BEGIN_DATE_TIME, format="%d-%b-%y %H:%M:%S")
    df["end"] = pd.to_datetime(df.END_DATE_TIME, format="%d-%b-%y %H:%M:%S")
    df["utc_offset"] = df.CZ_TIMEZONE.str.extract(r"(-?\d+)$")[0].astype(int)
    df["begin_utc"] = df.begin - pd.to_timedelta(df.utc_offset, unit="h")
    df["prop"], df["crops"] = dollars(df.DAMAGE_PROPERTY), dollars(df.DAMAGE_CROPS)
    return df


ev = times(ev)
print(f"{len(ev):,} Storm Events records for 2025, {ev.EPISODE_ID.nunique():,} episodes, {ev.EVENT_TYPE.nunique()} event types")
72,360 Storm Events records for 2025, 9,846 episodes, 48 event types
Example 1: events by state
by_state = ev.groupby("STATE").agg(events=("EVENT_ID", "size"), deaths=("DEATHS_DIRECT", "sum"),
                                   damage_musd=("prop", lambda s: s.sum() / 1e6)).sort_values("events", ascending=False)
print(by_state.head(8).round(1).to_string())
events deaths damage_musd
STATE
TEXAS 5641 153 488.5
OKLAHOMA 2892 13 87.6
MISSOURI 2757 21 1765.2
ILLINOIS 2702 9 532.5
VIRGINIA 2632 7 24.8
SOUTH DAKOTA 2400 3 1.2
TENNESSEE 2343 17 53.6
ALABAMA 2302 11 21.8
Texas reported the most events (5,641) and the most direct deaths (153), most of them in the July floods. Missouri's $1,765.2 million of damage is almost all one event: the St. Louis tornado of 16 May. Report counts also reflect how many people are around to report: Virginia's 2,632 events produced $24.8 million of damage, and South Dakota's 2,400 produced $1.2 million.
Example 2: 2025 against 2024
ev24 = times(pd.read_csv("data/storm-events-details-2024-c20260728.csv.gz", low_memory=False))
cmp = pd.DataFrame({"2024": ev24.EVENT_TYPE.value_counts(), "2025": ev.EVENT_TYPE.value_counts()}).fillna(0).astype(int)
cmp["change"] = (cmp["2025"] / cmp["2024"] - 1).round(3)
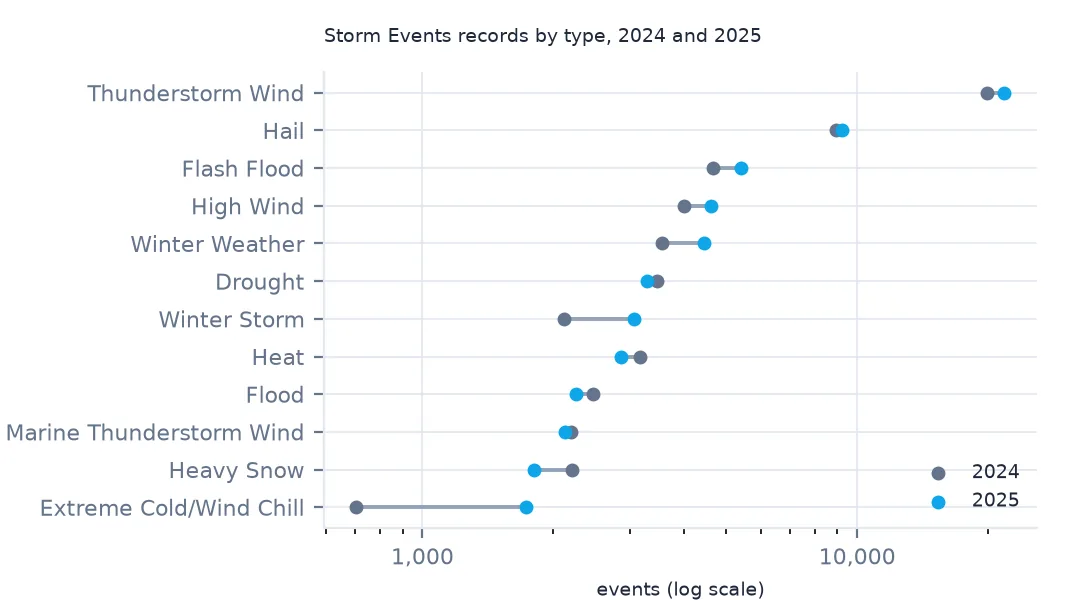
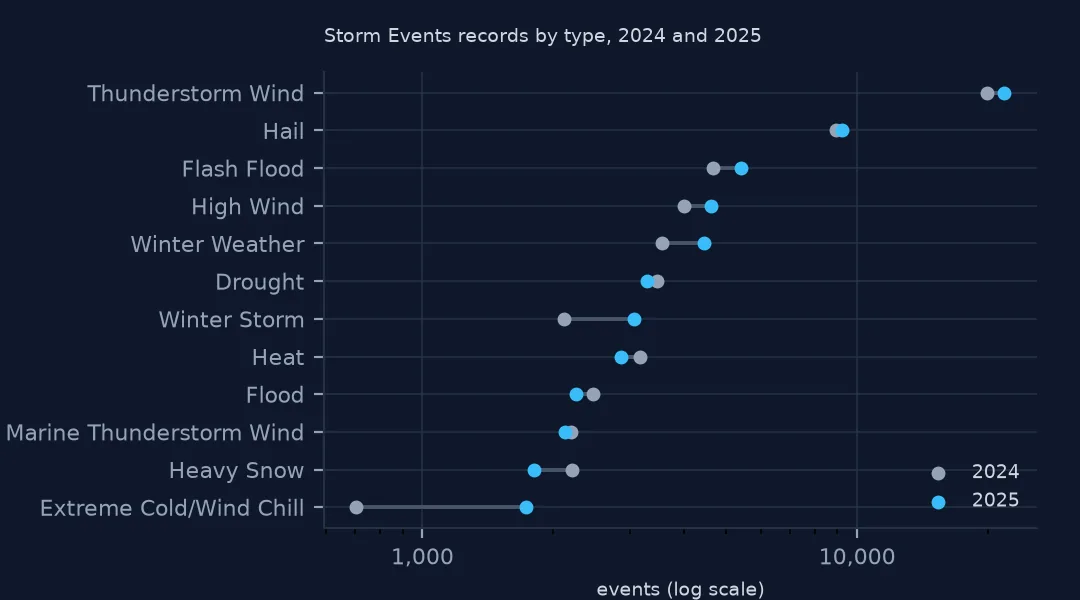
print(cmp.sort_values("2025", ascending=False).head(8).to_string())
2024 2025 change
EVENT_TYPE
Thunderstorm Wind 19940 21807 0.094
Hail 8941 9205 0.030
Flash Flood 4661 5393 0.157
High Wind 3994 4603 0.152
Winter Weather 3557 4436 0.247
Drought 3473 3283 -0.055
Winter Storm 2112 3070 0.454
Heat 3171 2864 -0.097
Year-on-year changes are large for the zone-based types. Winter storm events rose 45.4% from 2024 and heat events fell 9.7%. These are counts of county and zone segments, not of separate storms: one storm crossing ten zones is ten rows. The concept page on episodes covers what that does to counts.
Example 3: a clean point layer to keep
keep = pts[["EVENT_ID", "EPISODE_ID", "STATE", "EVENT_TYPE", "begin_utc", "MAGNITUDE", "DEATHS_DIRECT", "prop", "geometry"]]
keep.to_file("storm_events_2025.gpkg", layer="events", driver="GPKG")
print(f"wrote {len(keep):,} points, {Path('storm_events_2025.gpkg').stat().st_size / 1e6:.1f} MB")
wrote 43,917 points, 6.7 MB
The 43,917 positioned events fit in a 6.7 MB GeoPackage with UTC times and parsed damage, ready for QGIS or a web map. Keep EVENT_ID and EPISODE_ID so you can join back to the narratives and to the fatalities file.
Where the records come from
Each Weather Service forecast office compiles Storm Data for its own area every month, from spotter reports, emergency managers, media, damage surveys and its own radar analysis. NCEI publishes the result. It is a record of what offices documented, not an instrument record, which shows in three ways. Rural areas report less, and a quarter-sized hailstone in an empty county never becomes a row. Damage figures are office estimates, often rounded or left blank. And revisions keep arriving: the 2025 file was reissued in August 2026 (c20260819), and NCEI deletes the older revision when it does. That is why this page reads a dated copy saved on this site.
Things that trip up a first read
- The two-digit year.
%ymaps 69–99 to the 1900s and 00–68 to the 2000s, so in the database's early files a55becomes the 2050s. For files from before 1969, take the year from theYEARcolumn orBEGIN_YEARMONTH. - Marine and lake rows.
STATEis sometimesGULF OF MEXICOorLAKE MICHIGAN, with marine-zone codes that are not in any land boundary file. - Episode and event narratives are free text, sometimes thousands of characters long. Leave them out of a GeoPackage you intend to tile.
- The current year's file grows every month until about five months after the year ends, so record which revision you read.
Internal links
- Storm Events, episodes and county segments — what one row is
- Storm Events damage columns will not sum — the damage strings
- Storm Events will not join to counties — county and zone codes
- How to map tornado tracks — the begin and end points as lines
FAQ
Where do I download the NOAA Storm Events database?
The bulk CSV files are in NCEI's pub/data/swdi/stormevents/csvfiles/ directory, one details, fatalities and locations file per year, gzipped. The file name carries a revision date that changes when the file is reissued.
Are Storm Events times in UTC?
No. BEGIN_DATE_TIME is local standard time of the county or zone, named in CZ_TIMEZONE (for example CST-6). Subtract the offset to get UTC.