
How to Count Weather Deaths by Event Type, Place and Age
On this page
Problem statement
Which kinds of weather killed people in the United States in 2025, where were they, and how old were they? The Storm Events database answers that in two places: death counts on each event row, and a separate fatalities file with one row per person, giving age, sex and location such as "in a vehicle" or "mobile home". The two do not agree exactly. Event types split heat and cold across two names each, and one flood can dominate a whole year. This page counts 2025's weather deaths by type, place, age and month, and shows the choices that change the ranking.
Quick answer
Read the year's StormEvents_fatalities file and join it to the details file on EVENT_ID for the event type, state and date. Count FATALITY_TYPE == "D" (direct) separately from "I" (indirect), and merge Heat with Excessive Heat and the two cold types before ranking.
fat = pd.read_csv("data/storm-events-fatalities-2025-c20260819.csv.gz")
f = fat.merge(ev[["EVENT_ID", "EVENT_TYPE", "STATE", "CZ_NAME", "begin"]], on="EVENT_ID", how="left")
print(f"{len(f):,} deaths: {(f.FATALITY_TYPE == 'D').sum()} direct, {(f.FATALITY_TYPE == 'I').sum()} indirect")
print(f[f.FATALITY_TYPE == "D"].EVENT_TYPE.value_counts().head(6).to_string())
895 deaths: 632 direct, 263 indirect
EVENT_TYPE
Flash Flood 206
Tornado 64
Heat 62
Wildfire 61
Rip Current 38
Excessive Heat 37
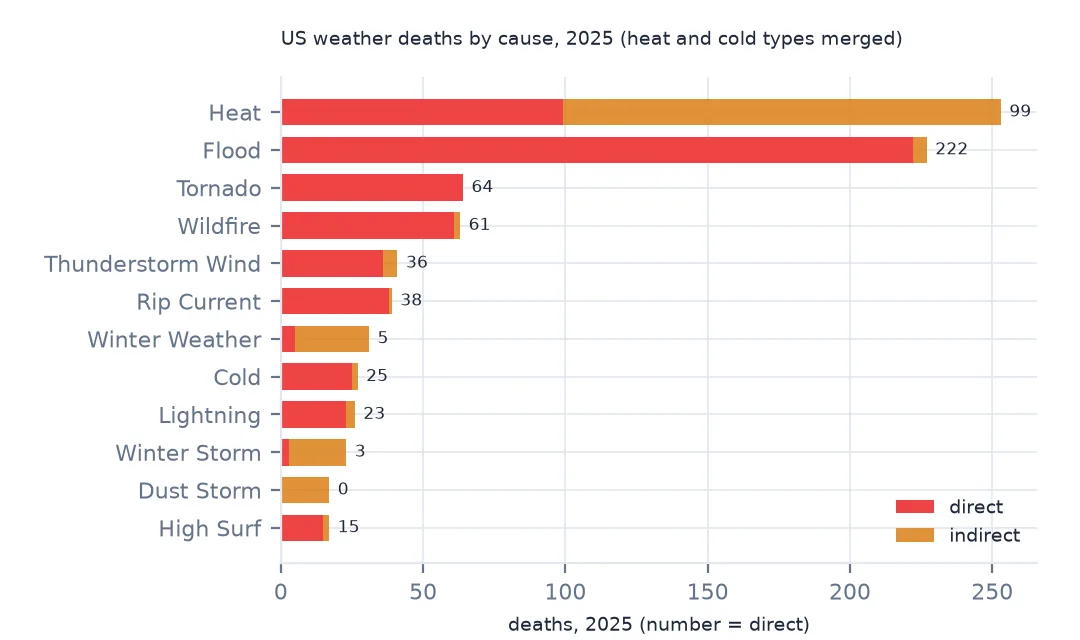
The fatalities file lists 895 deaths for 2025: 632 direct, caused by the weather itself, and 263 indirect, such as a crash on an icy road or a heart attack shovelling snow. Flash floods caused the most direct deaths (206). Tornadoes (64), heat (62) and wildfire (61) were close behind, followed by rip currents and excessive heat.
Counting deaths and grouping causes
1. Two places to count deaths
print(f"details file: {ev.DEATHS_DIRECT.sum()} direct + {ev.DEATHS_INDIRECT.sum()} indirect; "
      f"fatalities file: {(fat.FATALITY_TYPE == 'D').sum()} direct + {(fat.FATALITY_TYPE == 'I').sum()} indirect")
per_event = fat[fat.FATALITY_TYPE == "D"].groupby("EVENT_ID").size()
diff = ev.set_index("EVENT_ID").DEATHS_DIRECT.sub(per_event, fill_value=0)
print(f"events where the two disagree: {(diff != 0).sum()}")
details file: 628 direct + 261 indirect; fatalities file: 632 direct + 263 indirect
events where the two disagree: 4
The event rows sum to 628 direct and 261 indirect deaths, and the fatalities file has 632 and 263. Four events disagree. The files were revised at different moments, and a death added later did not always reach the event row. Use the fatalities file when you need people, and say which file you used.
2. Merge heat and cold types before ranking
group = {"Heat": "Heat", "Excessive Heat": "Heat", "Cold/Wind Chill": "Cold", "Extreme Cold/Wind Chill": "Cold",
         "Flash Flood": "Flood", "Flood": "Flood", "Coastal Flood": "Flood"}
f["group"] = f.EVENT_TYPE.map(group).fillna(f.EVENT_TYPE)
print(f[f.FATALITY_TYPE == "D"].group.value_counts().head(6).to_string())
group
Flood 222
Heat 99
Tornado 64
Wildfire 61
Rip Current 38
Thunderstorm Wind 36
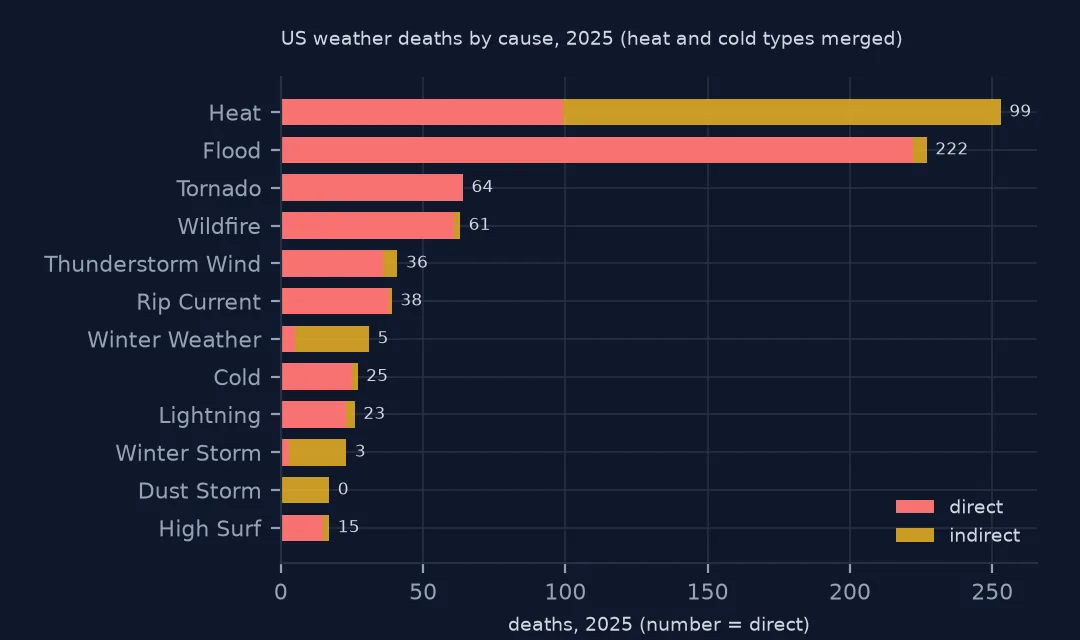
Merging the types changes the ranking. Floods (flash, river and coastal) account for 222 direct deaths, and heat rises to second with 99 once Heat and Excessive Heat are combined. Weather Service offices choose between the two names by local warning criteria, so splitting them understates heat. Tornadoes (64) and wildfire (61) follow.
3. Where people died
d = f[f.FATALITY_TYPE == "D"]
print(d.FATALITY_LOCATION.value_counts().head(6).to_string())
print("flood deaths in vehicles:", ((d.group == "Flood") & (d.FATALITY_LOCATION == "Vehicle/Towed Trailer")).sum(),
      "of", (d.group == "Flood").sum())
FATALITY_LOCATION
Unknown 111
Vehicle/Towed Trailer 99
Outside/Open Areas 98
Permanent Home 90
In Water 85
Camping 46
flood deaths in vehicles: 62 of 222
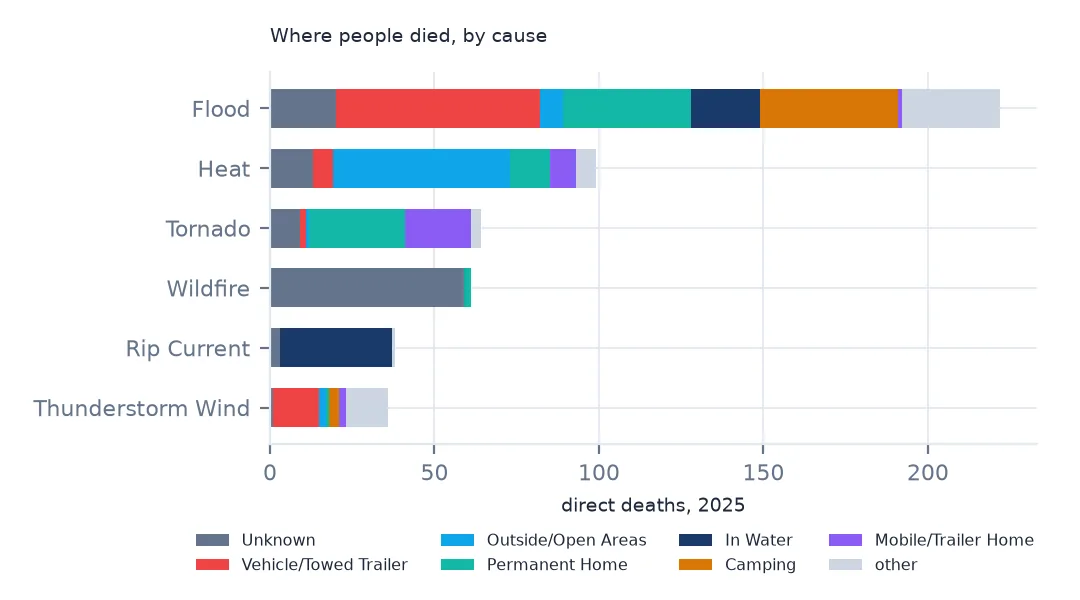
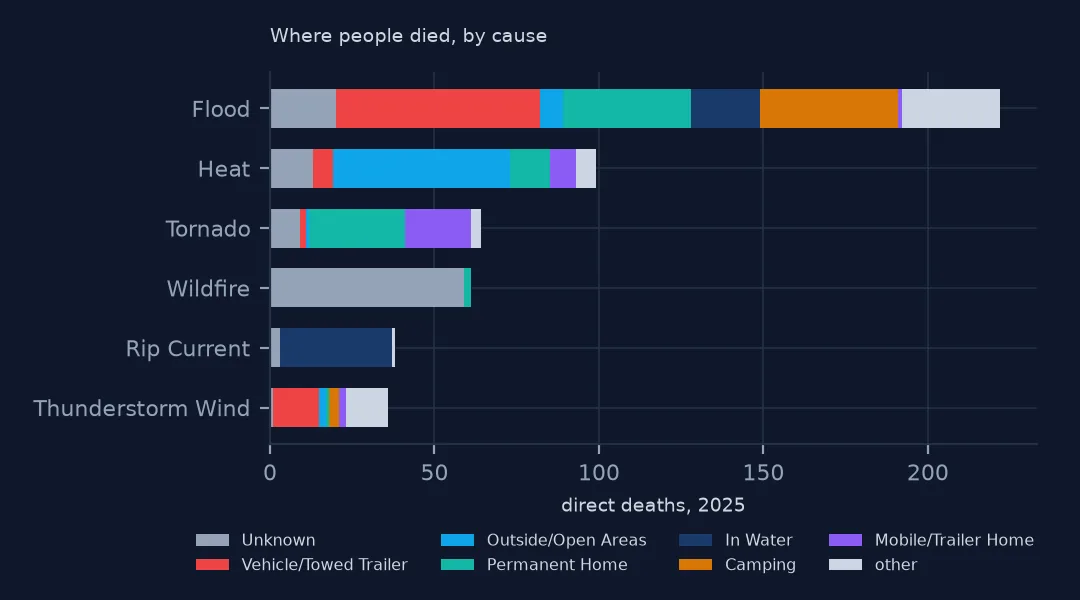
The location is unknown for 111 direct deaths. Of the rest, vehicles (99) are the most common place, followed by outdoors (98), at home (90) and in water (85). For floods, 62 of the 222 deaths were in vehicles, people who drove into flooded roads or whose cars were swept away. The 46 deaths while camping are almost all from the Texas flood of 4 July.
4. Age and sex
print(f"age known: {d.FATALITY_AGE.notna().mean():.0%}; median {d.FATALITY_AGE.median():.0f}; sex: {d.FATALITY_SEX.value_counts(dropna=False).to_dict()}")
print(d.groupby("group").FATALITY_AGE.median().loc[["Flood", "Heat", "Tornado", "Rip Current", "Cold"]].to_dict())
age known: 82%; median 50; sex: {'M': 337, 'F': 212, nan: 83}
{'Flood': 45.5, 'Heat': 61.0, 'Tornado': 62.0, 'Rip Current': 38.0, 'Cold': 59.0}
Age is known for 82% of direct deaths, and the median is 50. 337 of the dead were male and 212 female. The median age differs by cause: 38 for rip currents and 45.5 for floods, against 61 for heat and 62 for tornadoes. Heat and tornadoes kill older people, who are less able to cope with heat or to shelter quickly. Floods and surf kill younger people who are out in them.
The deadliest events and the yearly cycle
The data used on this page
The National Centers for Environmental Information's Storm Events Database details and fatalities files for 2025.
from pathlib import Path

import geopandas as gpd
import numpy as np
import pandas as pd
import requests

Path("data").mkdir(exist_ok=True)
# NOAA NCEI Storm Events Database: the 2025 details and fatalities files (revision c20260819) and the 2024 details file
# (revision c20260728), saved on this site on 15 October 2026 because NCEI replaces a year's files whenever it revises
# them and the old names disappear. Live: https://www.ncei.noaa.gov/pub/data/swdi/stormevents/csvfiles/
FILES = ["storm-events-details-2025-c20260819.csv.gz", "storm-events-fatalities-2025-c20260819.csv.gz",
         "storm-events-details-2024-c20260728.csv.gz"]
for name in FILES:
    if not Path(f"data/{name}").exists():
        Path(f"data/{name}").write_bytes(requests.get(f"https://data.spatialworkflow.io/{name}", timeout=600).content)
ev = pd.read_csv("data/storm-events-details-2025-c20260819.csv.gz", low_memory=False)


def dollars(s):
    """Damage is stored as text: '10.00K', '1.60B', '0' or blank. A blank means no estimate, not zero."""
    s = s.str.strip()
    return pd.to_numeric(s.str.rstrip("KMB"), errors="coerce") * s.str[-1].map({"K": 1e3, "M": 1e6, "B": 1e9}).fillna(1.0)


def times(df):
    """Event times are local to the county or zone ('CST-6'), with a two-digit year."""
    df["begin"] = pd.to_datetime(df.BEGIN_DATE_TIME, format="%d-%b-%y %H:%M:%S")
    df["end"] = pd.to_datetime(df.END_DATE_TIME, format="%d-%b-%y %H:%M:%S")
    df["utc_offset"] = df.CZ_TIMEZONE.str.extract(r"(-?\d+)$")[0].astype(int)
    df["begin_utc"] = df.begin - pd.to_timedelta(df.utc_offset, unit="h")
    df["prop"], df["crops"] = dollars(df.DAMAGE_PROPERTY), dollars(df.DAMAGE_CROPS)
    return df


ev = times(ev)
print(f"{len(ev):,} Storm Events records for 2025, {ev.EPISODE_ID.nunique():,} episodes, {ev.EVENT_TYPE.nunique()} event types")
72,360 Storm Events records for 2025, 9,846 episodes, 48 event types
Example 1: deadliest events
top = d.groupby(["EVENT_ID", "EVENT_TYPE", "STATE", "CZ_NAME"]).size().sort_values(ascending=False).head(6)
print(top.to_string())
kerr = d[(d.STATE == "TEXAS") & (d.begin.dt.strftime("%m-%d").between("07-03", "07-06")) & (d.group == "Flood")]
print(f"Texas floods of 3-6 July 2025: {len(kerr)} direct deaths, {kerr.FATALITY_AGE.lt(18).sum()} under 18")
EVENT_ID EVENT_TYPE STATE CZ_NAME
1287369 Flash Flood TEXAS KERR 61
1287451 Flash Flood TEXAS KERR 45
1292941 Tornado KENTUCKY LAUREL 17
1230303 Wildfire CALIFORNIA LOS ANGELES COUNTY SAN GABRIEL VALLEY 17
1230302 Wildfire CALIFORNIA EST SAN GABRIEL MOUNTAINS 17
1230301 Wildfire CALIFORNIA EST SANTA MONICA MOUNTAINS 12
Texas floods of 3-6 July 2025: 123 direct deaths, 40 under 18
Two Kerr County flash-flood events, 61 and 45 deaths, are the year's deadliest, and the Texas floods of 3–6 July killed 123 people in all, 40 of them under 18, many at summer camps on the Guadalupe River. The Laurel County, Kentucky segment of the 16 May tornado that struck London (17 deaths) and the January Los Angeles fires follow. The fires' deaths are split across three fire-weather zones, so a count by zone breaks each fire into pieces.
Example 2: deaths by month
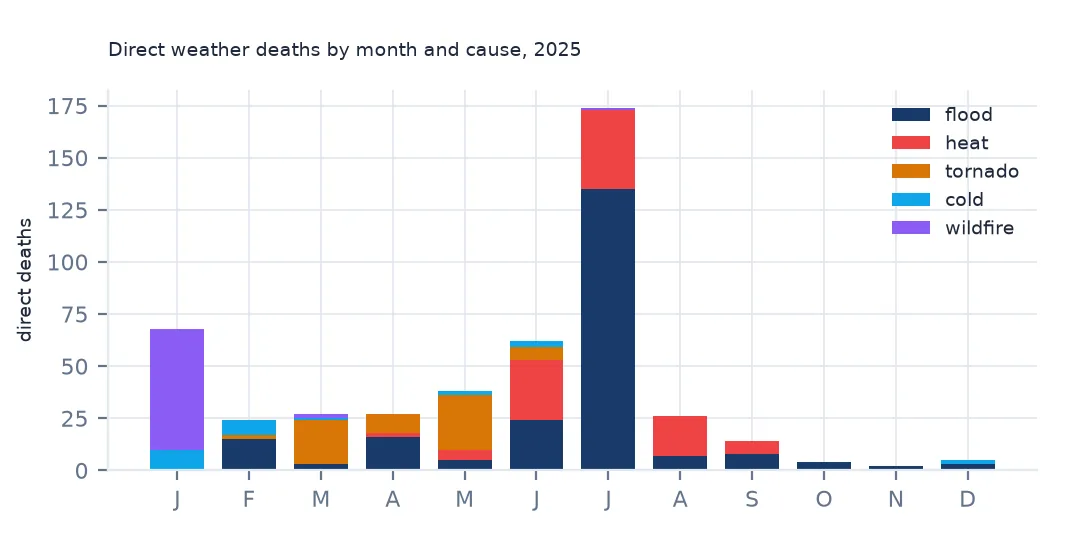
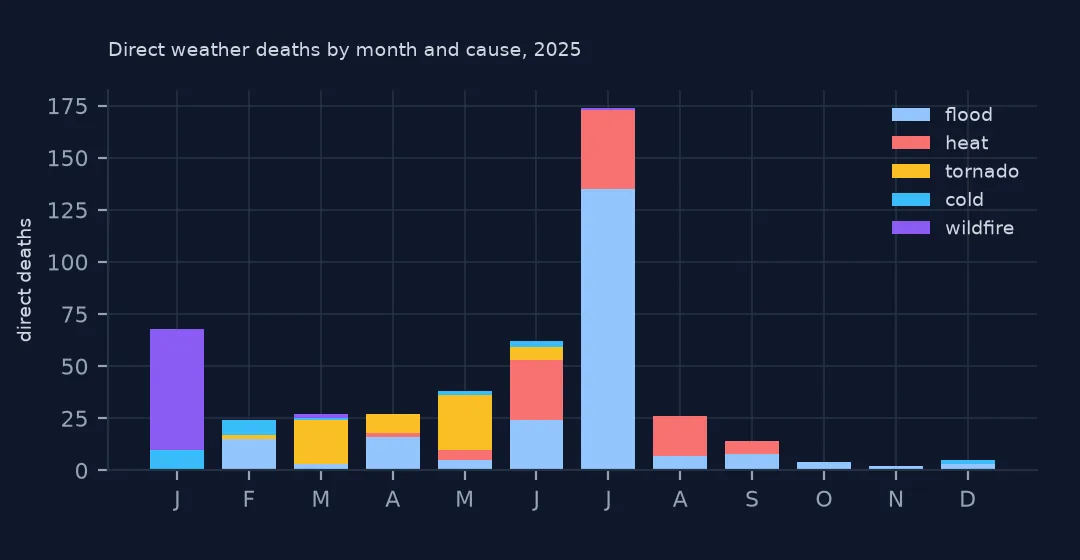
print(d.groupby([d.begin.dt.strftime("%m").rename("month"), "group"]).size().unstack(fill_value=0)[["Flood", "Heat", "Tornado", "Cold"]].to_string())group Flood Heat Tornado Cold
month
01 0 0 0 10
02 15 0 2 7
03 3 0 21 1
04 16 2 9 0
05 5 5 26 2
06 24 29 6 3
07 135 38 0 0
08 7 19 0 0
09 8 6 0 0
10 4 0 0 0
11 2 0 0 0
12 3 0 0 2
Each cause has its own season. Cold deaths come in January and February, tornado deaths from March to May, and heat deaths from June to August. July 2025 had 135 flood deaths, almost all in Texas. One event can change a year's ranking: without the Texas floods of early July, floods and heat would be level.
What counts as a weather death
Storm Data counts a death as direct when the weather itself caused it: drowning in flood water, being struck by debris or by lightning, or heat stroke. A death is indirect when the weather set up the circumstances, such as a car crash on ice, carbon monoxide from a generator, or a cardiac arrest during clean-up. Offices learn of deaths from medical examiners, the media and emergency managers, and heat deaths in particular are hard to attribute: public-health counts based on death certificates are several times higher than Storm Data's.
So the file is good for comparing causes within itself (who dies in floods, where tornado victims were) and weaker as a total of weather deaths. Heat is the cause it undercounts most.
Before publishing a death count
- Say direct or indirect. Mixing them changes totals by about 40%, and other sources mostly report direct deaths.
- Merge synonym event types, at least Heat/Excessive Heat and Cold/Wind Chill/Extreme Cold/Wind Chill.
- Late additions. The fatalities file is revised with the details file. A count read early in the following year can be short.
- Unknown age and sex are blanks, not zeros. Drop them before averaging.
Internal links
- How to read the Storm Events database — the files and fields
- Storm damage estimates explained — the other cost column
- Storm Events, episodes and county segments — what an event is
FAQ
What weather killed the most people in the US in 2025?
Floods, with 222 direct deaths in NOAA's Storm Events data (206 from flash floods), most in the Texas flood of 4 July. Heat was second with 99 once both heat types are combined.
What is an indirect weather death?
A death the weather contributed to but did not directly cause, such as a crash on an icy road. 2025 had 263 indirect deaths in the fatalities file.