
Storm Events, Episodes and County Segments: What One Row Means
On this page
Problem statement
Count "storms" in NOAA's Storm Events database and the answer depends on which column you count. A row is an event: one type of weather in one county or forecast zone, as documented by one Weather Service office. Rows are grouped into episodes: one office's account of one weather system. Neither unit is a storm in the everyday sense. A squall line crossing three states becomes dozens of episodes and hundreds of events, and a single tornado that crosses a county line becomes two rows. This page measures both units in the 2025 file, so you can choose the one that matches your question.
Quick answer
Count EVENT_ID for reports, EPISODE_ID for office-level weather systems, and distinct dates (or linked segments, for tornadoes) for storms. Episodes never span forecast offices, so a multi-state outbreak is always several episodes.
per_ep = ev.groupby("EPISODE_ID").agg(events=("EVENT_ID", "size"), types=("EVENT_TYPE", "nunique"),
                                      zones=("CZ_FIPS", "nunique"), wfo=("WFO", "nunique"))
print(f"{len(ev):,} events in {len(per_ep):,} episodes; events per episode: median {per_ep.events.median():.0f}, "
      f"max {per_ep.events.max()}; episodes with more than one event type: {(per_ep.types > 1).mean():.1%}")
print(f"episodes issued by more than one forecast office: {(per_ep.wfo > 1).sum()}")
72,360 events in 9,846 episodes; events per episode: median 3, max 412; episodes with more than one event type: 29.1%
episodes issued by more than one forecast office: 0
2025 has 72,360 events in 9,846 episodes. The median episode holds 3 events and the largest 412. 29.1% of episodes contain more than one event type, typically hail, wind and a tornado from the same line of storms. No episode was issued by more than one forecast office: the episode is an office's unit of work, not the atmosphere's.
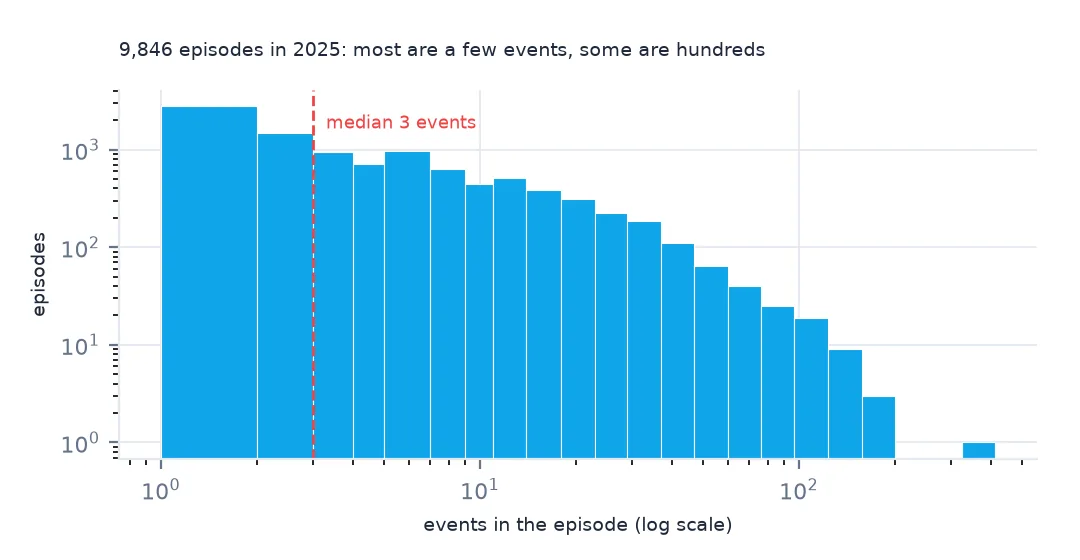
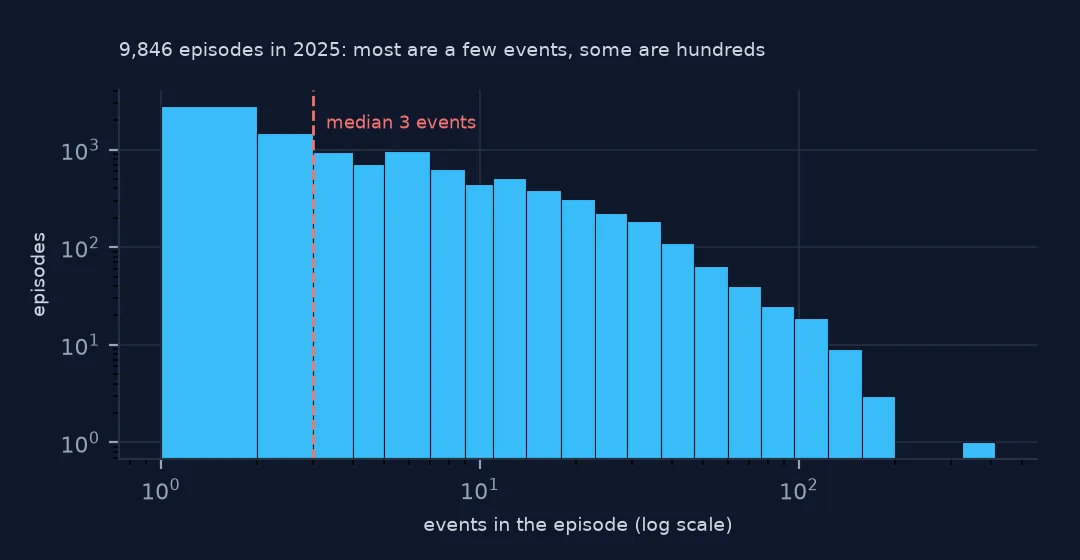
Events, episodes and outbreaks in the 2025 file
1. An event is one type of weather in one county or zone
k = ev.groupby(["EPISODE_ID", "EVENT_TYPE", "STATE", "CZ_TYPE", "CZ_FIPS"]).size()
print(f"(episode, type, county or zone) combinations: {len(k):,}; with more than one event: {(k > 1).sum():,}")
print(f"events with the same begin and end time: {(ev.begin == ev.end).mean():.1%}")
(episode, type, county or zone) combinations: 47,678; with more than one event: 9,842
events with the same begin and end time: 37.4%
An event is not unique per county either. 9,842 of the 47,678 combinations of episode, type and county or zone hold more than one event: separate wind reports from the same county as the line passed, each with its own time and point. 37.4% of events begin and end at the same minute, because they are point-in-time reports, such as a hailstone measured or a tree down.
2. An episode is one office's account of one weather system
big = per_ep.sort_values("events", ascending=False).head(5)
big = big.join(ev.groupby("EPISODE_ID").agg(state=("STATE", "first"), wfo_=("WFO", "first"),
                                            start=("begin", "min"), top=("EVENT_TYPE", lambda s: s.mode()[0])))
print(big.to_string())
events types zones wfo state wfo_ start top
EPISODE_ID
200143 412 2 10 1 ALABAMA HUN 2025-04-10 15:33:00 Thunderstorm Wind
202114 170 1 12 1 PENNSYLVANIA PBZ 2025-04-29 15:40:00 Thunderstorm Wind
199614 168 6 20 1 TENNESSEE OHX 2025-04-02 16:23:00 Thunderstorm Wind
206148 162 2 46 1 OKLAHOMA OUN 2025-08-15 11:00:00 Heat
205146 152 1 8 1 ALABAMA HUN 2025-06-07 11:50:00 Thunderstorm Wind
The largest episode, Huntsville's (HUN) account of storms on 10 April, holds 412 events, almost all thunderstorm wind. Oklahoma City's (OUN) heat episode of August is spread across 46 zones. Episode size reflects how an office documents its area as much as how severe the weather was: some offices log every downed tree as its own event, others summarise.
3. One weather system, many episodes
day = ev[(ev.begin.dt.date == pd.Timestamp("2025-03-15").date())]
print(f"15 March 2025: {len(day):,} events in {day.EPISODE_ID.nunique()} episodes from {day.WFO.nunique()} offices "
      f"in {day.STATE.nunique()} states")
print(day.groupby("WFO").EPISODE_ID.nunique().sort_values(ascending=False).head(6).to_dict())
15 March 2025: 586 events in 68 episodes from 41 offices in 31 states
{'FGF': 4, 'PAH': 4, 'MEG': 4, 'APX': 3, 'PHI': 3, 'LIX': 3}
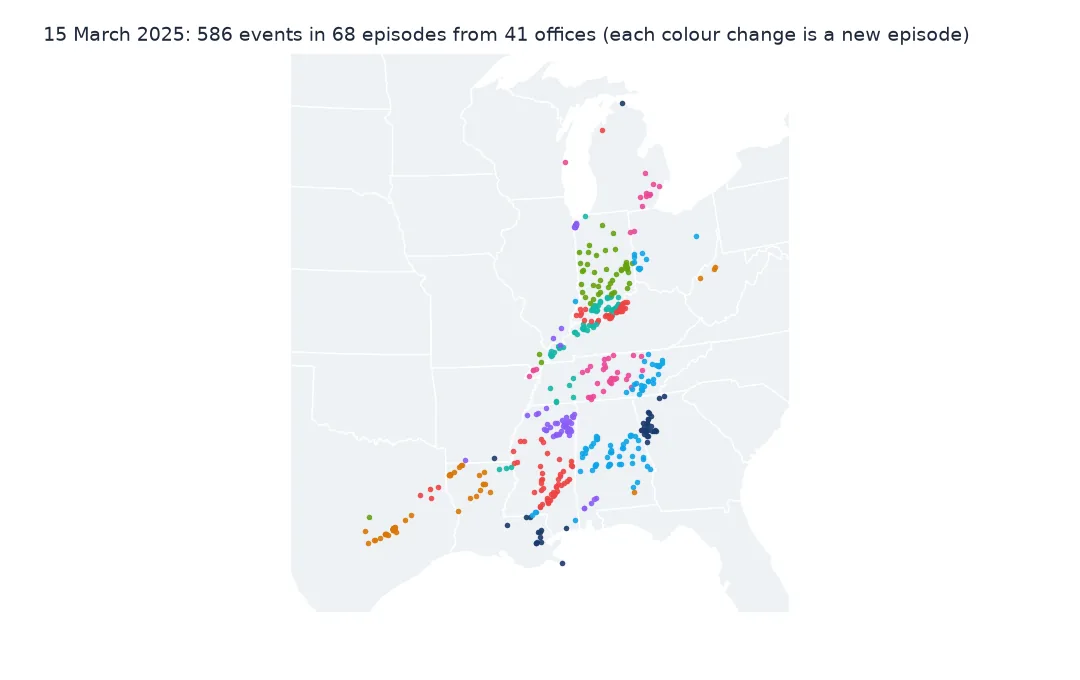
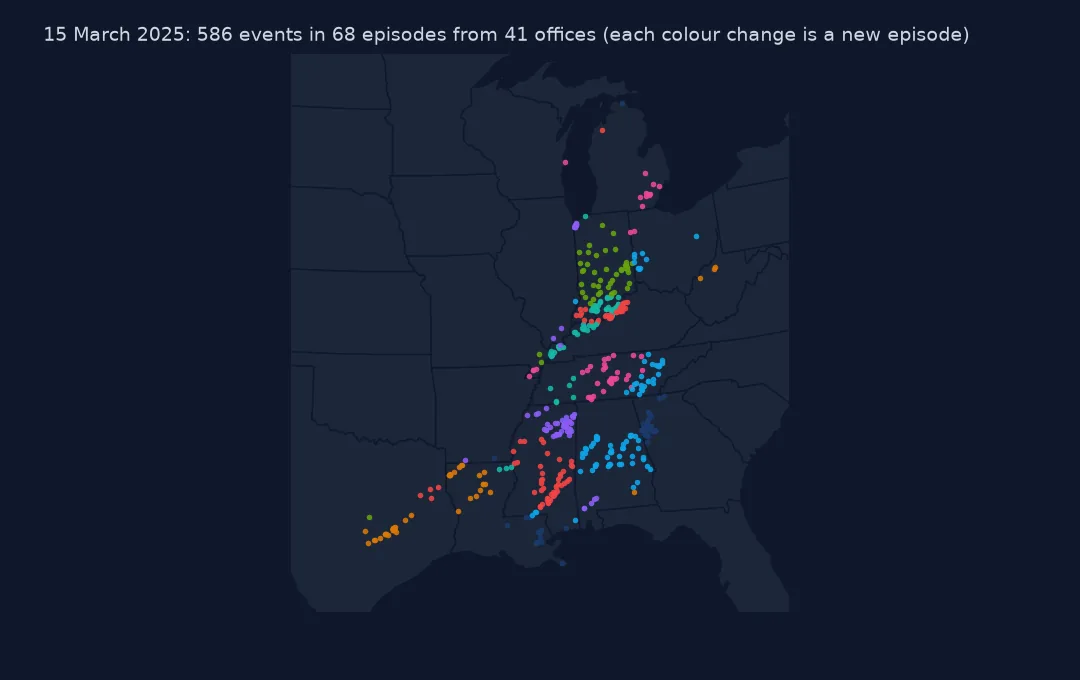
The outbreak of 14–16 March was one weather system. On 15 March alone it produced 586 events in 68 episodes from 41 offices in 31 states. Counting episodes says 68 storms, and counting events says 586. Neither is the number of storms. For questions about an outbreak, group by date and region rather than by episode.
4. Narratives belong to both levels
r = ev.loc[ev.EVENT_TYPE.eq("Tornado") & ev.TOR_F_SCALE.eq("EF5")].iloc[0]
print(f"episode narrative ({len(r.EPISODE_NARRATIVE)} chars): {r.EPISODE_NARRATIVE[:160]}...")
print(f"event narrative ({len(r.EVENT_NARRATIVE)} chars): {r.EVENT_NARRATIVE[:160]}...")
episode narrative (1030 chars): During the evening of Friday, June 20th into the early morning hours of June 21st, much of the region was affected by severe weather. Supercell thunderstorms de...
event narrative (3043 chars): This large and violent tornado began with minor damage to a few branches about 3 miles SSW Enderlin but within 2.5 miles of the track, the tornado gained intens...
Narratives come at both levels too. The Enderlin, North Dakota tornado of 20 June, the only EF5 in the file, carries a 1,030-character episode narrative describing the evening's supercells and a 3,043-character event narrative tracing the tornado itself. Repeating the episode narrative on every event row is what makes the file so large: drop EPISODE_NARRATIVE and keep a separate episodes table.
Counting hail, and how long things last
The data used on this page
The National Centers for Environmental Information's Storm Events Database details file for 2025.
from pathlib import Path

import geopandas as gpd
import numpy as np
import pandas as pd
import requests

Path("data").mkdir(exist_ok=True)
# NOAA NCEI Storm Events Database: the 2025 details and fatalities files (revision c20260819) and the 2024 details file
# (revision c20260728), saved on this site on 15 October 2026 because NCEI replaces a year's files whenever it revises
# them and the old names disappear. Live: https://www.ncei.noaa.gov/pub/data/swdi/stormevents/csvfiles/
FILES = ["storm-events-details-2025-c20260819.csv.gz", "storm-events-fatalities-2025-c20260819.csv.gz",
         "storm-events-details-2024-c20260728.csv.gz"]
for name in FILES:
    if not Path(f"data/{name}").exists():
        Path(f"data/{name}").write_bytes(requests.get(f"https://data.spatialworkflow.io/{name}", timeout=600).content)
ev = pd.read_csv("data/storm-events-details-2025-c20260819.csv.gz", low_memory=False)


def dollars(s):
    """Damage is stored as text: '10.00K', '1.60B', '0' or blank. A blank means no estimate, not zero."""
    s = s.str.strip()
    return pd.to_numeric(s.str.rstrip("KMB"), errors="coerce") * s.str[-1].map({"K": 1e3, "M": 1e6, "B": 1e9}).fillna(1.0)


def times(df):
    """Event times are local to the county or zone ('CST-6'), with a two-digit year."""
    df["begin"] = pd.to_datetime(df.BEGIN_DATE_TIME, format="%d-%b-%y %H:%M:%S")
    df["end"] = pd.to_datetime(df.END_DATE_TIME, format="%d-%b-%y %H:%M:%S")
    df["utc_offset"] = df.CZ_TIMEZONE.str.extract(r"(-?\d+)$")[0].astype(int)
    df["begin_utc"] = df.begin - pd.to_timedelta(df.utc_offset, unit="h")
    df["prop"], df["crops"] = dollars(df.DAMAGE_PROPERTY), dollars(df.DAMAGE_CROPS)
    return df


ev = times(ev)
print(f"{len(ev):,} Storm Events records for 2025, {ev.EPISODE_ID.nunique():,} episodes, {ev.EVENT_TYPE.nunique()} event types")
72,360 Storm Events records for 2025, 9,846 episodes, 48 event types
Example 1: counting the same storm three ways
hail = ev[ev.EVENT_TYPE == "Hail"]
print(f"hail: {len(hail):,} events, {hail.EPISODE_ID.nunique():,} episodes, "
      f"{hail.groupby(['STATE', 'CZ_FIPS']).ngroups:,} counties with any, {hail.begin.dt.date.nunique()} hail days")
hail: 9,205 events, 1,739 episodes, 1,842 counties with any, 234 hail days
Hail in 2025 is 9,205 events, 1,739 episodes, 1,842 counties or 234 hail days, depending on the unit. A map should normally use events per county. A climatology of how often hail happens should use days, which are much less sensitive to how many people were outside reporting.
Example 2: how long episodes and events last
ep = ev.groupby("EPISODE_ID").agg(start=("begin", "min"), stop=("end", "max"))
hours = (ep.stop - ep.start).dt.total_seconds() / 3600
ev_h = (ev.end - ev.begin).dt.total_seconds() / 3600
print(f"episode length: median {hours.median():.1f} h, 90th percentile {hours.quantile(0.9):.1f} h")
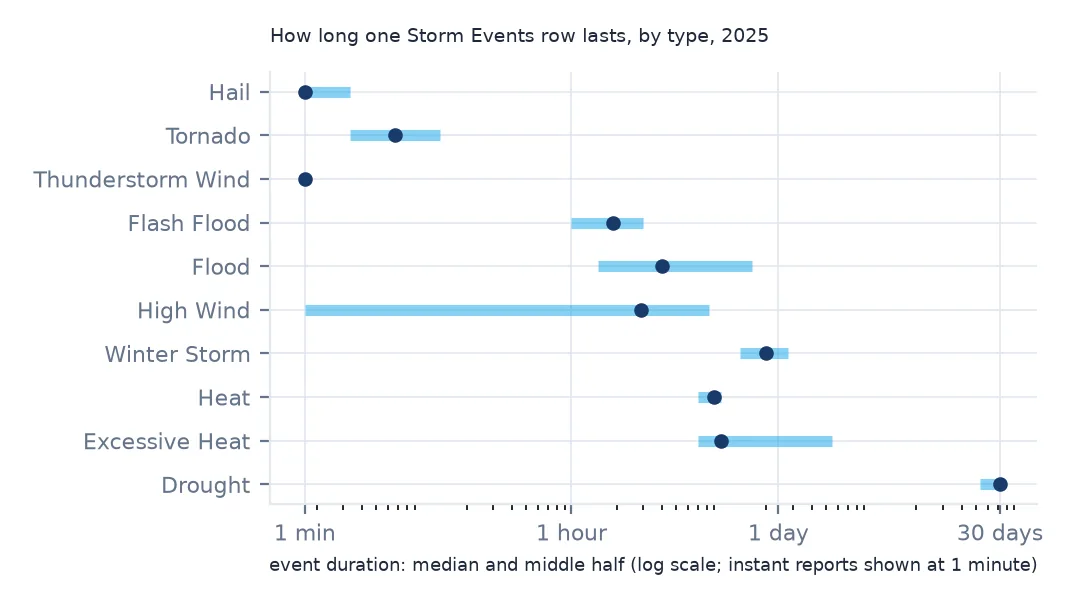
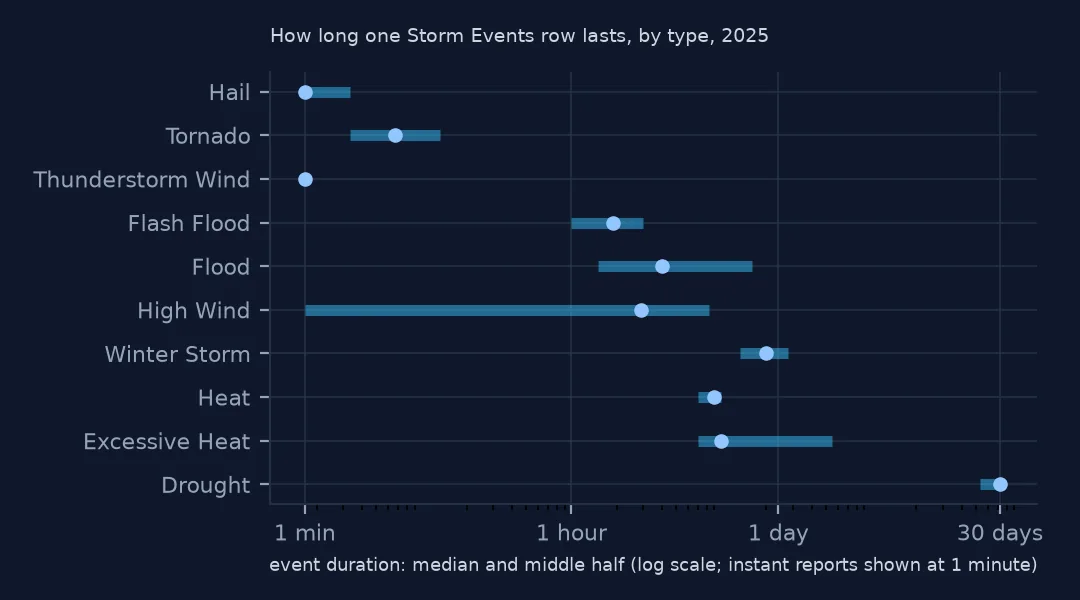
print("event length by type, median hours:", ev_h.groupby(ev.EVENT_TYPE).median().loc[["Tornado", "Hail", "Flash Flood", "Drought", "Heat"]].round(2).to_dict())
episode length: median 4.9 h, 90th percentile 69.6 h
event length by type, median hours: {'Tornado': 0.07, 'Hail': 0.0, 'Flash Flood': 1.88, 'Drought': 719.98, 'Heat': 9.0}
The median episode lasts 4.9 hours, but the 90th percentile is 69.6 hours, because heat, drought and winter episodes run for days. Event durations show the same split: a tornado segment's median is 0.07 hours (about four minutes), hail is recorded as an instant, a flash flood lasts 1.88 hours, heat 9.0 hours and a drought event 719.98 hours, a whole month. Drought is entered once per zone per month, so a year-long drought is twelve events per zone.
Why the units are administrative
Storm Data is compiled by forecast office and month, and the structure of the database follows that workflow. An office writes up each weather system in its area as an episode, then enters a row for each type of weather in each county or zone it affected, because counties and zones are the units its warnings are issued for. When the system moves into the next office's area, that office writes its own episode. Nothing in the file links them.
So the database is a set of local accounts. That is what makes it useful for local questions, such as how often a county has hail or which zones see the most heat events. It also means any count of storms across regions has to be built by the analyst, from dates, distances and the tornado continuation fields.
Units that look alike
EVENT_IDis unique;EPISODE_IDis not a storm. Joining fatalities or locations always goes throughEVENT_ID.- Monthly entries. Drought, and some long heat or cold spells, are entered per month, so they split at month boundaries even within one episode.
- Episode IDs can repeat across years when an episode spans New Year's Eve: combine two files before grouping.
- Zero-duration events are reports, not measurements of how long something lasted. Do not average them as durations.
Internal links
- How to read the Storm Events database — the files and fields
- Tornado counts too high — one tornado, several rows
- Storm Events will not join to counties — county and zone rows
FAQ
What is the difference between an episode and an event in Storm Events?
An event is one type of weather in one county or zone, as entered by one forecast office. An episode groups an office's events from one weather system. In 2025 the median episode held 3 events.
Can one storm have several episodes?
Yes. Episodes never cross forecast offices, so a system that crosses several offices' areas has one episode per office. The storms of 15 March 2025 were 68 episodes.