
Tornado Counts Too High: One Tornado Split Across County Lines
On this page
Problem statement
Count the tornado rows in the 2025 Storm Events file and you get 1,591. That is not the number of tornadoes. When a tornado crosses a county line, the Weather Service enters one row per county, and when it crosses into another office's area that office enters its own rows in its own episode. Counting rows inflates the total, gives multi-county tornadoes extra weight in every rating and state count, and splits the longest tracks into pieces. This page links the segments back into tornadoes using the continuation fields, county, time and position, and shows how much the counts change.
Quick answer
For each row with TOR_OTHER_CZ_FIPS set, find the tornado row in that state and county whose begin time is within an hour of this row's end and whose begin point is within a few kilometres of this row's end point. Link them, follow the links into chains, and count chains.
t = ev[ev.EVENT_TYPE == "Tornado"].copy()
t["st"] = t.STATE_FIPS.astype(int).astype(str).str.zfill(2).map(states.set_index("STATEFP").STUSPS)
t["end_utc"] = t.end - pd.to_timedelta(t.utc_offset, unit="h")
a = t[t.TOR_OTHER_CZ_FIPS.notna()]
m = a.merge(t, left_on=["TOR_OTHER_CZ_STATE", "TOR_OTHER_CZ_FIPS"], right_on=["st", "CZ_FIPS"], suffixes=("", "_n"))
m["gap_min"] = (m.begin_utc_n - m.end_utc).dt.total_seconds() / 60
m["km"] = np.hypot((m.END_LAT - m.BEGIN_LAT_n) * 111.2, (m.END_LON - m.BEGIN_LON_n) * 111.2 * np.cos(np.radians(m.END_LAT)))
links = m[m.gap_min.abs().le(60) & m.km.le(5)].sort_values("km").drop_duplicates("EVENT_ID").drop_duplicates("EVENT_ID_n")
print(f"tornado rows: {len(t):,}; links to a next-county segment: {len(links)}; tornadoes: {len(t) - len(links):,}")
tornado rows: 1,591; links to a next-county segment: 257; tornadoes: 1,334
Linking 257 segments to the next one gives 1,334 tornadoes from 1,591 rows. Counting rows overstates the year by 257.
Linking segments into tornadoes
1. The continuation fields
cols = ["STATE", "CZ_NAME", "BEGIN_DATE_TIME", "END_DATE_TIME", "TOR_OTHER_CZ_STATE", "TOR_OTHER_CZ_NAME", "TOR_OTHER_WFO"]
print(a[cols].head(4).to_string(index=False))
print(f"rows with a continuation: {len(a)} of {len(t):,}")
STATE CZ_NAME BEGIN_DATE_TIME END_DATE_TIME TOR_OTHER_CZ_STATE TOR_OTHER_CZ_NAME TOR_OTHER_WFO
ARKANSAS CRAIGHEAD 14-MAR-25 23:16:00 14-MAR-25 23:17:00 AR GREENE MEG
ILLINOIS ST. CLAIR 14-MAR-25 21:30:00 14-MAR-25 21:37:00 IL CLINTON LSX
MISSISSIPPI JEFFERSON DAVIS 15-MAR-25 12:11:00 15-MAR-25 12:35:00 MS COVINGTON JAN
MISSISSIPPI JEFFERSON DAVIS 15-MAR-25 14:05:00 15-MAR-25 14:14:00 MS COVINGTON JAN
rows with a continuation: 282 of 1,591
282 of the 1,591 rows name a next county in TOR_OTHER_CZ_STATE and TOR_OTHER_CZ_NAME, and the office responsible for it in TOR_OTHER_WFO. The fields point forward but carry no event ID, so the next row has to be found. Jefferson Davis County, Mississippi appears twice on 15 March, two separate tornadoes both continuing into Covington County. The county alone is not enough to pick the right successor.
2. Match on county, time and position
print(f"candidate pairs on county alone: {len(m)}; within 60 minutes: {m.gap_min.abs().le(60).sum()}; "
      f"and within 5 km: {len(links)}")
print(f"links crossing a state line: {(links.STATE != links.STATE_n).sum()}; crossing a forecast office: {(links.WFO != links.WFO_n).sum()}; "
      f"in different episodes: {(links.EPISODE_ID != links.EPISODE_ID_n).sum()}")
lost = a[~a.EVENT_ID.isin(links.EVENT_ID)]
print(f"continuations with no matching segment: {len(lost)}")
candidate pairs on county alone: 807; within 60 minutes: 505; and within 5 km: 257
links crossing a state line: 26; crossing a forecast office: 31; in different episodes: 48
continuations with no matching segment: 25
Matching on county alone gives 807 candidate pairs. Requiring the next segment to begin within 60 minutes of this one's end leaves 505, and requiring its begin point within 5 km of this one's end point leaves 257 one-to-one links. 26 links cross a state line, 31 cross from one forecast office to another, and 48 join segments in different episodes. Matching within an episode would have missed those 48. 25 continuations find no partner at all: the next county's row is missing, or its time or position was entered differently.
3. Follow the chains
nxt = dict(zip(links.EVENT_ID, links.EVENT_ID_n))
heads = set(t.EVENT_ID) - set(nxt.values())
chain = {}
for h in heads:
    e = h
    while e is not None:
        chain[e] = h
        e = nxt.get(e)
t["tornado"] = t.EVENT_ID.map(chain)
size = t.groupby("tornado").size()
print(f"tornadoes: {t.tornado.nunique():,}; split over 2 counties: {(size == 2).sum()}, 3 or more: {(size >= 3).sum()}, most: {size.max()}")
tornadoes: 1,334; split over 2 counties: 154, 3 or more: 40, most: 6
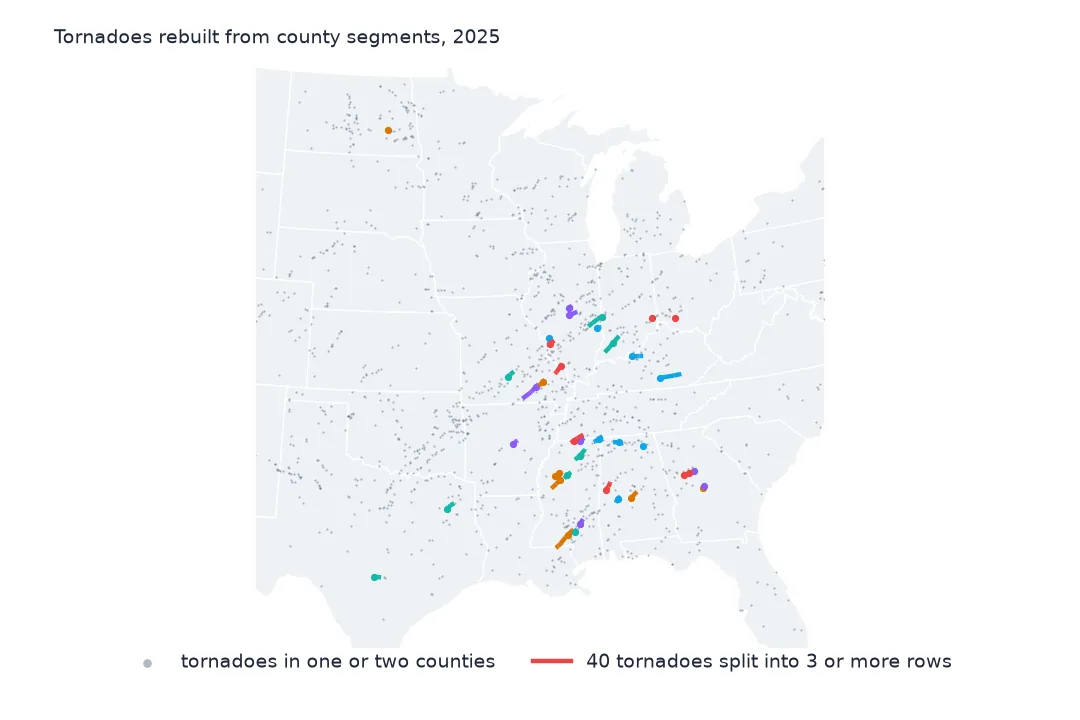
Following the links gives 1,334 tornadoes. 154 crossed into a second county, 40 crossed three or more, and the longest chain has 6 segments.
4. Rebuild each tornado
rank = {r: i for i, r in enumerate(["EFU", "EF0", "EF1", "EF2", "EF3", "EF4", "EF5"])}
t["r"] = t.TOR_F_SCALE.map(rank)
torn = t.groupby("tornado").agg(segments=("EVENT_ID", "size"), miles=("TOR_LENGTH", "sum"), r=("r", "max"),
                                deaths=("DEATHS_DIRECT", "sum"), start=("begin_utc", "min"), states=("STATE", "nunique"))
torn["rating"] = torn.r.map({v: k for k, v in rank.items()})
print(torn.sort_values("miles", ascending=False).head(5).drop(columns="r").to_string())
segments miles deaths start states rating
tornado
1248678.0 6 67.16 6 2025-03-15 17:17:00 2 EF4
1263465.0 3 60.08 18 2025-05-17 02:27:00 1 EF4
1242130.0 3 57.49 0 2025-03-15 07:08:00 1 EF2
1237783.0 4 57.24 0 2025-03-15 02:11:00 1 EF3
1249024.0 4 48.91 0 2025-04-02 23:33:00 2 EF2
Rebuilt, the longest tornado of 2025 is the 15 March EF4 that crossed 6 counties in two states over 67.16 miles, killing 6. Its longest single segment would not have ranked near the top of a list of rows. The 16 May Kentucky EF4 becomes 60.08 miles over three segments with 18 deaths. A tornado's rating is the highest of its segments' ratings, its length is their sum, and its deaths are their total.
What changes in state and rating counts
The data used on this page
The National Centers for Environmental Information's Storm Events Database details file for 2025, and Census Bureau 2023 state boundaries.
from pathlib import Path

import geopandas as gpd
import numpy as np
import pandas as pd
import requests

Path("data").mkdir(exist_ok=True)
# NOAA NCEI Storm Events Database: the 2025 details and fatalities files (revision c20260819) and the 2024 details file
# (revision c20260728), saved on this site on 15 October 2026 because NCEI replaces a year's files whenever it revises
# them and the old names disappear. Live: https://www.ncei.noaa.gov/pub/data/swdi/stormevents/csvfiles/
FILES = ["storm-events-details-2025-c20260819.csv.gz", "storm-events-fatalities-2025-c20260819.csv.gz",
         "storm-events-details-2024-c20260728.csv.gz"]
for name in FILES:
    if not Path(f"data/{name}").exists():
        Path(f"data/{name}").write_bytes(requests.get(f"https://data.spatialworkflow.io/{name}", timeout=600).content)
ev = pd.read_csv("data/storm-events-details-2025-c20260819.csv.gz", low_memory=False)


def dollars(s):
    """Damage is stored as text: '10.00K', '1.60B', '0' or blank. A blank means no estimate, not zero."""
    s = s.str.strip()
    return pd.to_numeric(s.str.rstrip("KMB"), errors="coerce") * s.str[-1].map({"K": 1e3, "M": 1e6, "B": 1e9}).fillna(1.0)


def times(df):
    """Event times are local to the county or zone ('CST-6'), with a two-digit year."""
    df["begin"] = pd.to_datetime(df.BEGIN_DATE_TIME, format="%d-%b-%y %H:%M:%S")
    df["end"] = pd.to_datetime(df.END_DATE_TIME, format="%d-%b-%y %H:%M:%S")
    df["utc_offset"] = df.CZ_TIMEZONE.str.extract(r"(-?\d+)$")[0].astype(int)
    df["begin_utc"] = df.begin - pd.to_timedelta(df.utc_offset, unit="h")
    df["prop"], df["crops"] = dollars(df.DAMAGE_PROPERTY), dollars(df.DAMAGE_CROPS)
    return df


ev = times(ev)
for name, url in {"cb_2023_us_county_20m.zip": "https://www2.census.gov/geo/tiger/GENZ2023/shp/cb_2023_us_county_20m.zip",
                  "cb_2023_us_state_20m.zip": "https://www2.census.gov/geo/tiger/GENZ2023/shp/cb_2023_us_state_20m.zip"}.items():
    if not Path(f"data/{name}").exists():
        Path(f"data/{name}").write_bytes(requests.get(url, timeout=300).content)
counties = gpd.read_file("data/cb_2023_us_county_20m.zip").to_crs(5070)
states = gpd.read_file("data/cb_2023_us_state_20m.zip").to_crs(5070)
print(f"{len(ev):,} Storm Events records for 2025, {ev.EPISODE_ID.nunique():,} episodes, {ev.EVENT_TYPE.nunique()} event types")
72,360 Storm Events records for 2025, 9,846 episodes, 48 event types
Example 1: state counts
rows = t.groupby("STATE").size()
whole = t[t.EVENT_ID == t.tornado].groupby("STATE").size()
touched = t.groupby("STATE").tornado.nunique()
out = pd.DataFrame({"rows": rows, "tornadoes_starting": whole, "tornadoes_touching": touched}).fillna(0).astype(int)
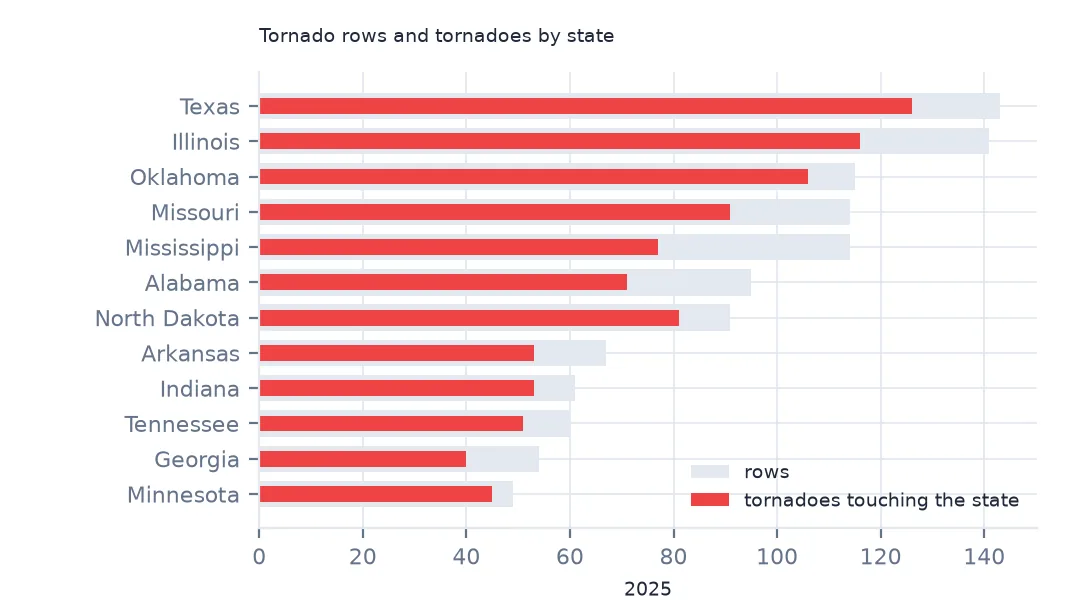
print(out.sort_values("rows", ascending=False).head(8).to_string())
print(f"sum of tornadoes touching each state: {out.tornadoes_touching.sum():,}")
rows tornadoes_starting tornadoes_touching
STATE
TEXAS 143 125 126
ILLINOIS 141 112 116
OKLAHOMA 115 105 106
MISSOURI 114 90 91
MISSISSIPPI 114 76 77
ALABAMA 95 68 71
NORTH DAKOTA 91 81 81
ARKANSAS 67 50 53
sum of tornadoes touching each state: 1,360
Per state, there are three different counts. Mississippi has 114 rows but only 76 tornadoes starting there and 77 touching it, so counting rows overstates it by half. Texas, with large counties, has 143 rows and 125 tornadoes starting there. Summing "tornadoes touching each state" gives 1,360, more than the national 1,334, because a tornado that crosses a state line counts once in each. Use tornadoes touching for state statistics and tornadoes starting for national totals, and say which you used.
Example 2: counting by rating
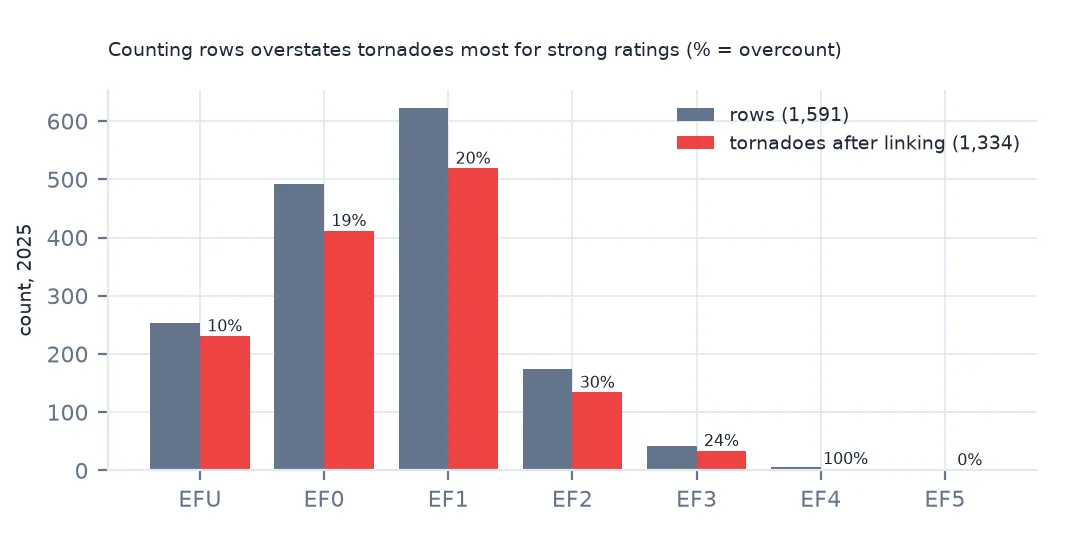
print(pd.DataFrame({"rows": t.TOR_F_SCALE.value_counts(), "tornadoes": torn.rating.value_counts()}).reindex(list(rank)).to_string()) rows tornadoes
EFU 253 231
EF0 492 412
EF1 623 519
EF2 174 134
EF3 42 34
EF4 6 3
EF5 1 1
The inflation is greatest for strong tornadoes, because they travel further and cross more county lines. EF2 drops from 174 rows to 134 tornadoes and EF4 from 6 rows to 3, while EFU drops only from 253 to 231. A rating distribution built from rows overstates how common strong tornadoes are.
Why tornadoes are stored in pieces
Storm Data is compiled by county because warnings, damage surveys and local records are organised by county, and each forecast office can only enter events in its own area. A tornado crossing a county line gets a row for each county, with the path length, width and rating found in that county. One crossing into a neighbouring office's area is entered twice, once by each office. The TOR_OTHER_* fields were added so the pieces could be put back together, but they name the next county rather than the next event's ID.
The Storm Prediction Center's tornado database stores the same tornadoes as whole tracks, with a segment table for the county pieces, and its counts match whole tornadoes. When your question is "how many tornadoes", that database or the linking on this page is the right source. When it is "what happened in this county", the rows are.
Where linking can go wrong
- Tolerances. 60 minutes and 5 km catch clean continuations. Loosening them adds false links between separate tornadoes in the same outbreak.
- Continuations across years (a tornado at midnight on 31 December) need both years' files.
- Unmatched continuations. The 25 rows that point to a missing segment are still counted as tornadoes, which is correct: their next segment never became a row.
- The SPC database is the authority for national annual counts. Compare your linked total with it before publishing.
Internal links
- How to map tornado tracks — drawing the segments
- Storm Events, episodes and county segments — why the rows split
- How to chart the severe weather season — tornadoes by month
FAQ
How many tornadoes were there in 2025?
Linking the Storm Events county segments gives 1,334 tornadoes from 1,591 tornado rows (file revision of August 2026).
What are TOR_OTHER_CZ fields in Storm Events?
They name the next county or zone a tornado continued into (state, FIPS, name and forecast office). They are what lets you join a tornado's county segments back into one track.