
Storm Events Damage Columns Will Not Sum: 10.00K, 1.60B and Blanks
On this page
Problem statement
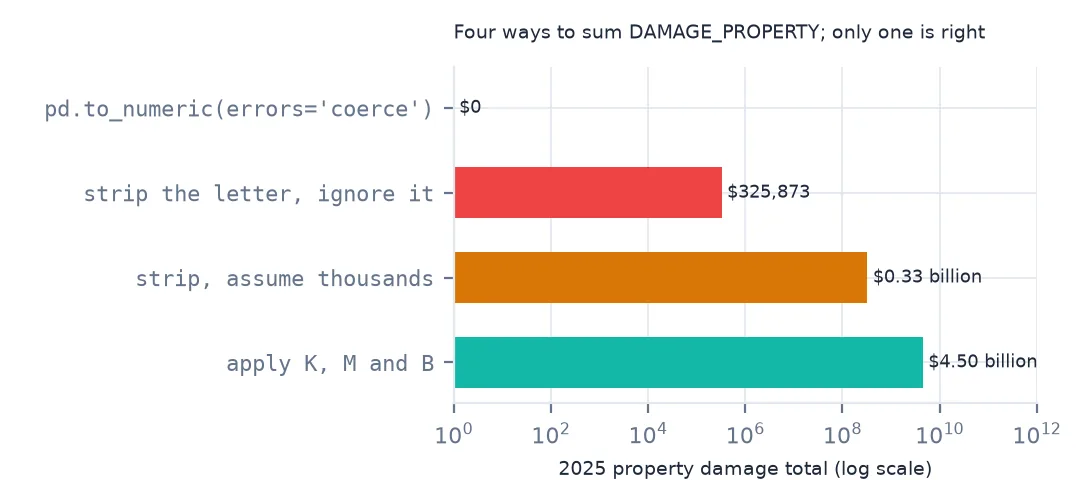
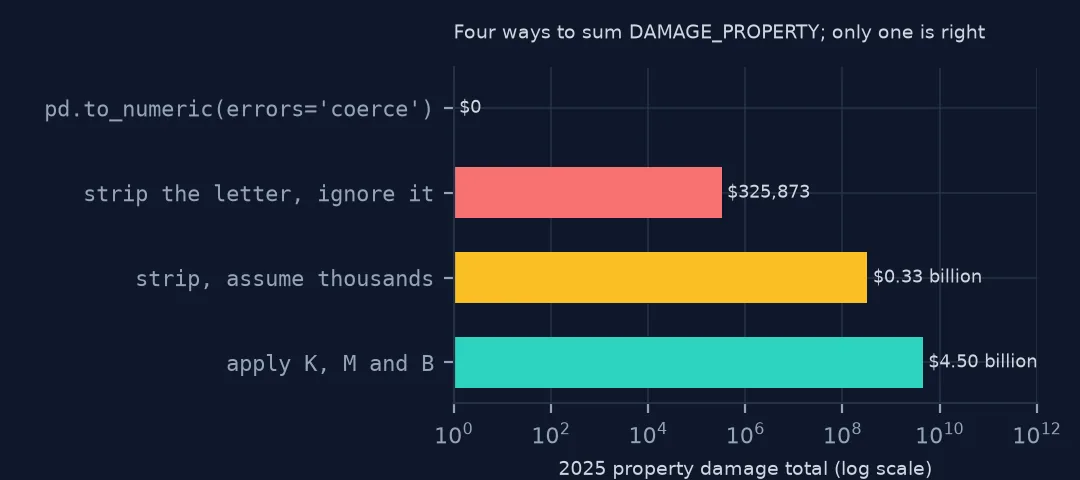
DAMAGE_PROPERTY and DAMAGE_CROPS in NOAA's Storm Events files look numeric but are text: 1.00K, 230.00M, 1.60B, a bare 0, or nothing. astype(float) raises a ValueError, pd.to_numeric(errors="coerce") silently turns all but a hundred values into NaN, and stripping the letter without applying it gives totals off by a factor of a thousand or more. This page shows each failure on the 2025 file and the parse that gets $4.50 billion.
Quick answer
Strip the trailing letter, convert the rest to a number, and multiply by a thousand, a million or a billion for K, M or B (by one when there is no letter). Keep blanks as NaN.
try:
    ev.DAMAGE_PROPERTY.astype(float)
except ValueError as e:
    print("ValueError:", e)
mult = {"K": 1e3, "M": 1e6, "B": 1e9}
s = ev.DAMAGE_PROPERTY.str.strip()
prop = pd.to_numeric(s.str.rstrip("KMB"), errors="coerce") * s.str[-1].map(mult).fillna(1.0)
print(f"property damage 2025: ${prop.sum() / 1e9:.2f} billion from {prop.notna().sum():,} estimates")
ValueError: could not convert string to float: '1.00K'
property damage 2025: $4.50 billion from 55,961 estimates
The direct cast fails on the first value with a suffix. Parsed with the multipliers, 2025 property damage is $4.50 billion from 55,961 estimates.
Suffixes, shortcuts and blanks
1. Look at the suffixes
print(s.str[-1].value_counts(dropna=False).to_dict())
print("values without a suffix:", s[s.str[-1].str.isdigit().fillna(False)].unique()[:5].tolist())
print("examples:", s.drop_duplicates()[lambda x: x.isin(["10.00K", "230.00M", "1.60B"])].tolist())
{'K': 55582, nan: 16399, 'M': 259, '0': 119, 'B': 1}
values without a suffix: ['0']
examples: ['10.00K', '1.60B', '230.00M']
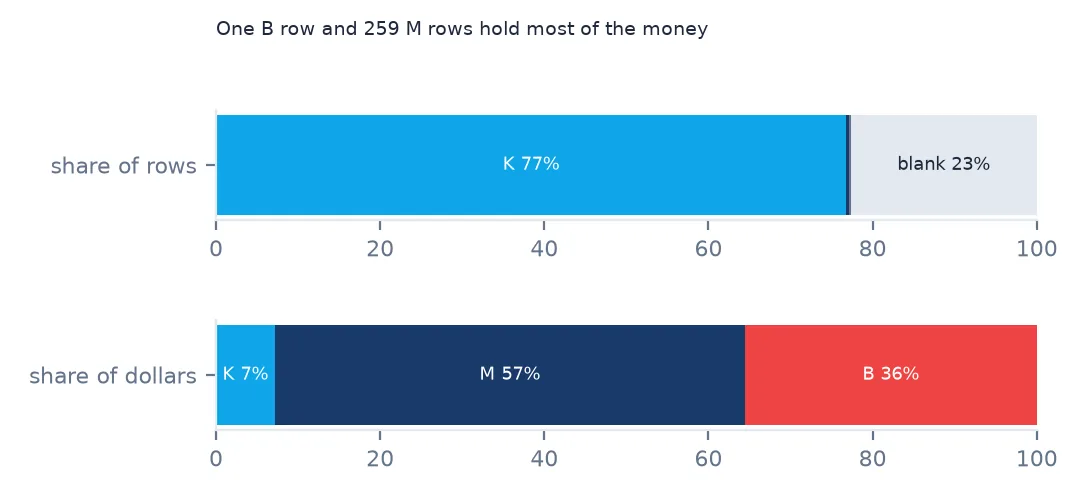
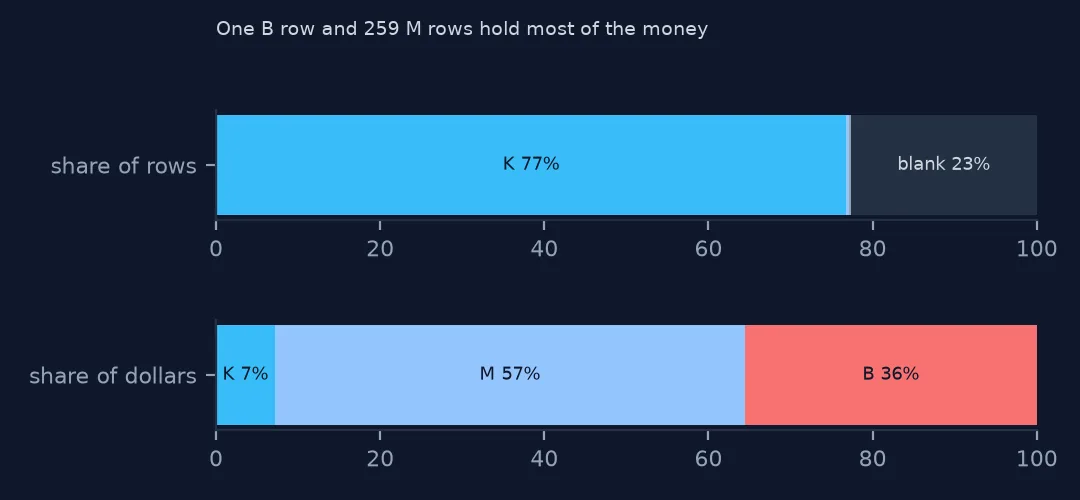
Four kinds of value appear: 55,582 in thousands (K), 259 in millions (M), one in billions (B) and 119 bare zeros, plus 16,399 blanks. The only value without a suffix is 0. Any parser has to handle all of them.
2. The tempting shortcuts
coerce = pd.to_numeric(ev.DAMAGE_PROPERTY, errors="coerce")
strip = pd.to_numeric(s.str.rstrip("KMB"), errors="coerce")
print(f"to_numeric(errors='coerce'): {coerce.notna().sum()} values kept, sum ${coerce.sum():,.0f}")
print(f"strip the letter, ignore it: sum ${strip.sum():,.0f} (as if every value were dollars)")
print(f"strip, assume thousands: ${strip.sum() * 1e3 / 1e9:.2f} billion")
to_numeric(errors='coerce'): 119 values kept, sum $0
strip the letter, ignore it: sum $325,873 (as if every value were dollars)
strip, assume thousands: $0.33 billion
errors="coerce" keeps just the 119 bare zeros and sums to $0, with no warning. Stripping the letter and ignoring it gives $325,873, and assuming everything is in thousands gives $0.33 billion, both badly wrong because the millions and the single billion are lost. The two shortcuts disagree with each other and with the right answer by orders of magnitude, but neither raises an error.
3. Blanks are not zeros
print(f"blank: {s.isna().sum():,}; '0' or '0.00K': {(prop == 0).sum():,}")
print(f"mean per estimated event ${prop.mean():,.0f}; with blanks filled as 0 ${prop.fillna(0).mean():,.0f}")
blank: 16,399; '0' or '0.00K': 41,535
mean per estimated event $80,430; with blanks filled as 0 $62,202
16,399 rows are blank and 41,535 are zero, written as 0 or 0.00K. Filling blanks with zero lowers the mean per event from $80,430 to $62,202. A blank means no estimate was made, so leave it as NaN and say how many there are.
4. Check against the setup's parser
print(f"same as dollars(): {np.allclose(prop.fillna(-1), dollars(ev.DAMAGE_PROPERTY).fillna(-1))}; "
      f"crops: ${dollars(ev.DAMAGE_CROPS).sum() / 1e9:.3f} billion")
same as dollars(): True; crops: $0.270 billion
The inline parse matches the setup's dollars() function exactly, and the same function gives crop damage of $0.270 billion.
SQL and charts
The data used on this page
The National Centers for Environmental Information's Storm Events Database details file for 2025.
from pathlib import Path

import geopandas as gpd
import numpy as np
import pandas as pd
import requests

Path("data").mkdir(exist_ok=True)
# NOAA NCEI Storm Events Database: the 2025 details and fatalities files (revision c20260819) and the 2024 details file
# (revision c20260728), saved on this site on 15 October 2026 because NCEI replaces a year's files whenever it revises
# them and the old names disappear. Live: https://www.ncei.noaa.gov/pub/data/swdi/stormevents/csvfiles/
FILES = ["storm-events-details-2025-c20260819.csv.gz", "storm-events-fatalities-2025-c20260819.csv.gz",
         "storm-events-details-2024-c20260728.csv.gz"]
for name in FILES:
    if not Path(f"data/{name}").exists():
        Path(f"data/{name}").write_bytes(requests.get(f"https://data.spatialworkflow.io/{name}", timeout=600).content)
ev = pd.read_csv("data/storm-events-details-2025-c20260819.csv.gz", low_memory=False)


def dollars(s):
    """Damage is stored as text: '10.00K', '1.60B', '0' or blank. A blank means no estimate, not zero."""
    s = s.str.strip()
    return pd.to_numeric(s.str.rstrip("KMB"), errors="coerce") * s.str[-1].map({"K": 1e3, "M": 1e6, "B": 1e9}).fillna(1.0)


def times(df):
    """Event times are local to the county or zone ('CST-6'), with a two-digit year."""
    df["begin"] = pd.to_datetime(df.BEGIN_DATE_TIME, format="%d-%b-%y %H:%M:%S")
    df["end"] = pd.to_datetime(df.END_DATE_TIME, format="%d-%b-%y %H:%M:%S")
    df["utc_offset"] = df.CZ_TIMEZONE.str.extract(r"(-?\d+)$")[0].astype(int)
    df["begin_utc"] = df.begin - pd.to_timedelta(df.utc_offset, unit="h")
    df["prop"], df["crops"] = dollars(df.DAMAGE_PROPERTY), dollars(df.DAMAGE_CROPS)
    return df


ev = times(ev)
print(f"{len(ev):,} Storm Events records for 2025, {ev.EPISODE_ID.nunique():,} episodes, {ev.EVENT_TYPE.nunique()} event types")
72,360 Storm Events records for 2025, 9,846 episodes, 48 event types
Example 1: the same parse in DuckDB
import duckdb

q = duckdb.sql("""
    SELECT sum(TRY_CAST(rtrim(DAMAGE_PROPERTY, 'KMB') AS DOUBLE) *
               CASE right(DAMAGE_PROPERTY, 1) WHEN 'K' THEN 1e3 WHEN 'M' THEN 1e6 WHEN 'B' THEN 1e9 ELSE 1 END) / 1e9 AS billions,
           count(DAMAGE_PROPERTY) AS estimates
    FROM read_csv('data/storm-events-details-2025-c20260819.csv.gz', all_varchar = true)""").fetchone()
print(f"DuckDB: ${q[0]:.2f} billion from {q[1]:,} estimates")
DuckDB: $4.50 billion from 55,961 estimates
In DuckDB the same parse is rtrim plus a CASE on the last character. Read the file with all_varchar = true so DuckDB's type detection cannot decide the column is numeric from its first rows. It returns the same $4.50 billion from 55,961 estimates.
Example 2: what the B row does to a chart
by_type = prop.groupby(ev.EVENT_TYPE).sum().sort_values(ascending=False)
print((by_type.head(4) / 1e9).round(3).to_dict())
print(f"the one billion-dollar row is {prop.max() / prop.sum():.0%} of all property damage")
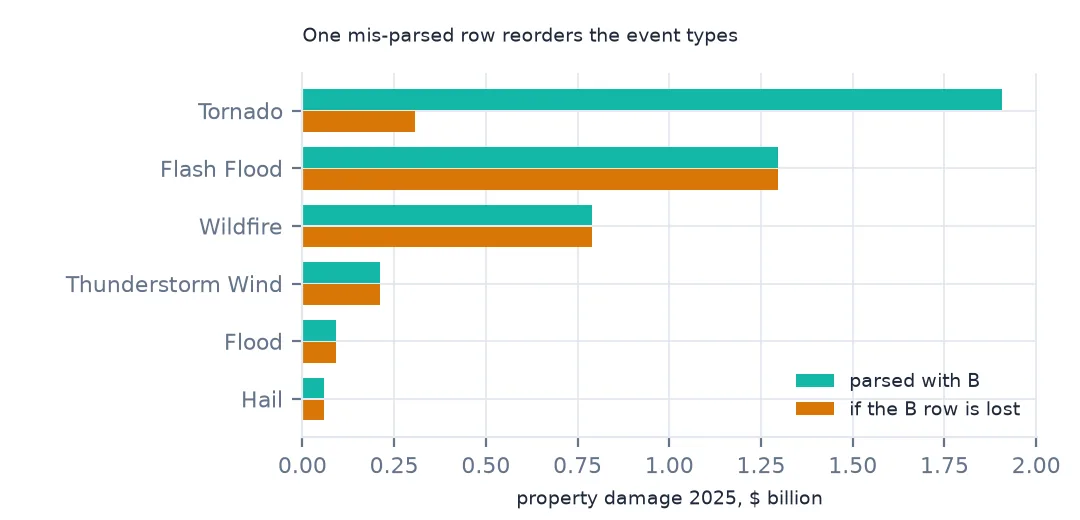
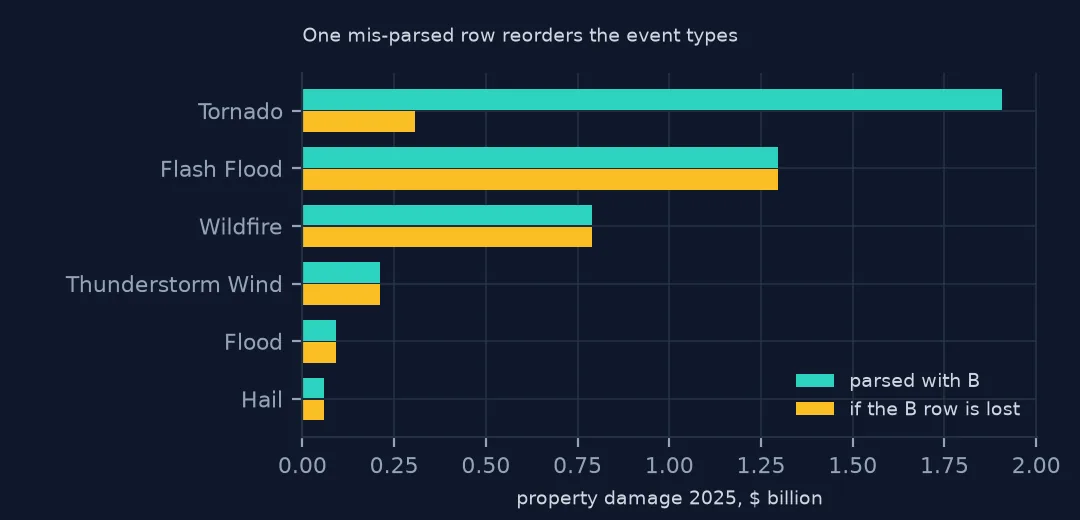
{'Tornado': 1.906, 'Flash Flood': 1.297, 'Wildfire': 0.789, 'Thunderstorm Wind': 0.21}
the one billion-dollar row is 36% of all property damage
Once parsed, one row matters a great deal: the single B value, the St. Louis tornado, is 36% of all 2025 property damage and puts tornadoes at the top of the chart by type ($1.906 billion against $1.297 billion for flash floods). A parser that dropped the B suffix would move tornadoes down the ranking without any error.
Why damage is stored as text
The format comes from the printed Storm Data publication, where offices wrote estimates the way a person would, with a letter for thousands or millions, and the bulk files kept that notation. The format has never been changed so that old and new files read the same way.
Variants in other years
- Older files use the same letters. The 1980, 1996 and 2005 files contain only K, M, B and bare zeros, so the same parser reads the whole archive. 1980 has no blanks, though: every row without damage is
0, so a zero there can also mean no estimate. - Check for leftovers. After parsing, count rows that had a value but became NaN. It should be zero.
- Inflation. The values are nominal dollars of the event year.
Internal links
- Storm damage estimates explained — what the numbers mean once parsed
- How to read the Storm Events database — the files and fields
- Storm Events will not join to counties — another field that looks simpler than it is
FAQ
How do I convert Storm Events damage like 10.00K to a number?
Strip the trailing K, M or B, convert to float and multiply by 1e3, 1e6 or 1e9. A value without a letter is in dollars. Leave blanks as NaN.
Why does pd.to_numeric return NaN for most Storm Events damage values?
Because the values contain a letter suffix. With errors="coerce" only the bare 0 values survive, which in 2025 is 119 of 55,961 estimates.