
How to Map Tornado Tracks from Storm Events Begin and End Points
On this page
Problem statement
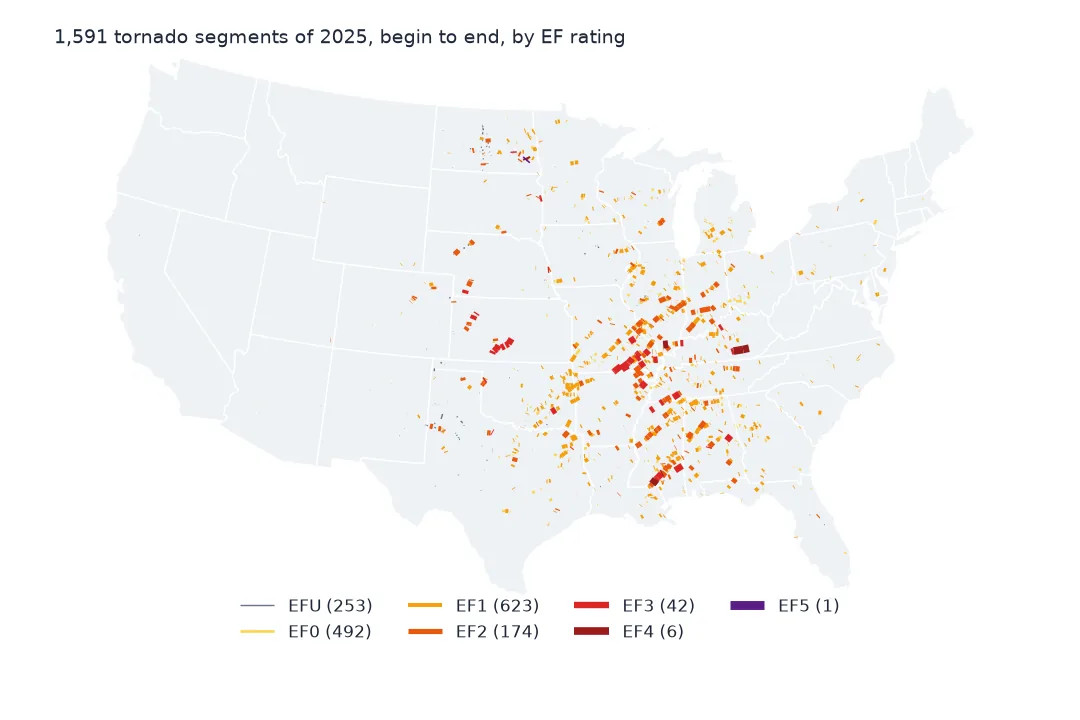
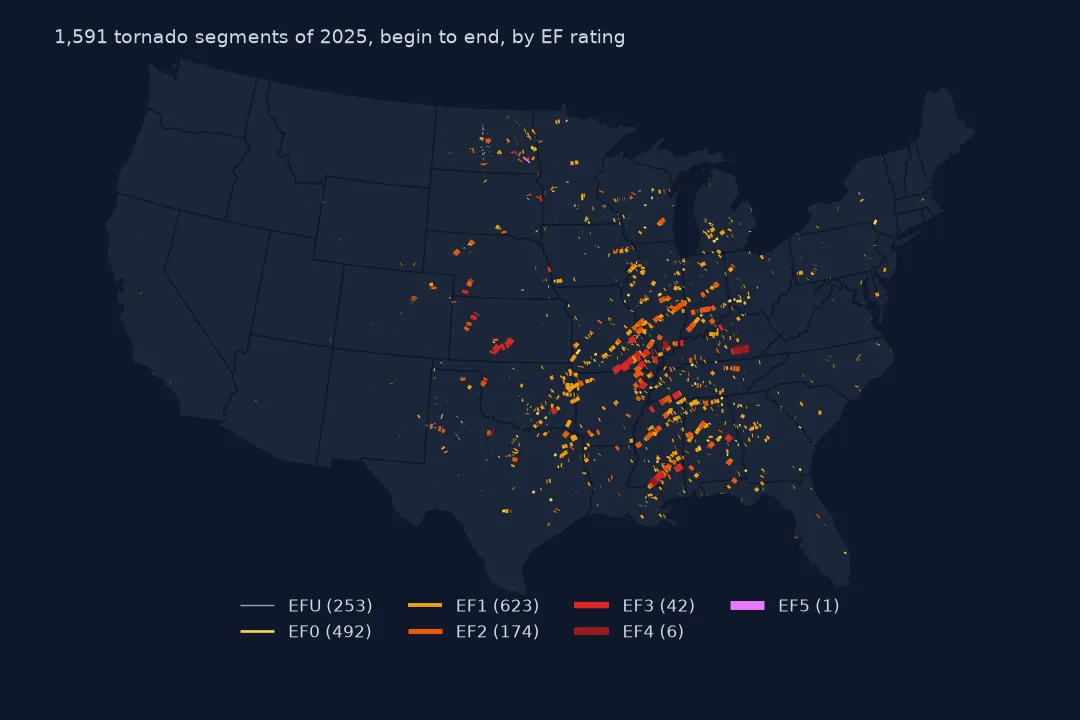
Every tornado row in the Storm Events database has a begin point, an end point, a surveyed path length in miles and a maximum width in yards. That is enough to draw each 2025 tornado as a line, or as a path polygon with its real width, and to see where the year's tornadoes went. But the straight line between two points is not always the surveyed path, some segments begin and end at the same spot, and every row is a county segment rather than a whole tornado. This page draws the 1,591 tornado segments of 2025, checks them against the recorded lengths, and maps them by EF rating.
Quick answer
Select EVENT_TYPE == "Tornado", build a LineString from (BEGIN_LON, BEGIN_LAT) to (END_LON, END_LAT), and project to an equal-area or equidistant CRS (EPSG:5070 for the contiguous US) before measuring. For a path polygon, buffer each line by half of TOR_WIDTH converted from yards to metres, with flat caps.
from shapely.geometry import LineString

tor = ev[ev.EVENT_TYPE.eq("Tornado") & ev.BEGIN_LAT.notna() & ev.END_LAT.notna()].copy()
tracks = gpd.GeoDataFrame(tor, crs=4326, geometry=[LineString([(a, b), (c, d)]) for a, b, c, d in
                                                   zip(tor.BEGIN_LON, tor.BEGIN_LAT, tor.END_LON, tor.END_LAT)]).to_crs(5070)
print(f"{len(tracks):,} tornado segments drawn; total path {tracks.length.sum() / 1609.344:,.0f} miles")
1,591 tornado segments drawn; total path 6,223 miles
All 1,591 tornado segments of 2025 have both points. Their straight-line paths add up to 6,223 miles.
From begin and end points to paths
1. Select the tornadoes
t_all = ev[ev.EVENT_TYPE == "Tornado"]
print(f"tornado segments: {len(t_all):,}; missing an end point: {t_all.END_LAT.isna().sum()}")
print("EF ratings:", t_all.TOR_F_SCALE.value_counts().to_dict())
tornado segments: 1,591; missing an end point: 0
EF ratings: {'EF1': 623, 'EF0': 492, 'EFU': 253, 'EF2': 174, 'EF3': 42, 'EF4': 6, 'EF5': 1}
EF1 is the most common rating (623 segments), followed by EF0 (492). 253 segments are EFU, unknown: tornadoes that crossed open country with nothing to damage, so a survey could not estimate a wind speed. Only one EF5 was rated in 2025, the Enderlin tornado in North Dakota.
2. Check the straight line against the surveyed length
tracks["line_mi"] = tracks.length / 1609.344
ratio = tracks.line_mi / tracks.TOR_LENGTH
print(f"straight line / recorded length: median {ratio.median():.2f}; within 10%: {ratio.between(0.9, 1.1).mean():.1%}; "
      f"points begin = end: {(tracks.line_mi == 0).sum()}")
print(tracks.loc[ratio.sort_values().index[[0, -1]], ["STATE", "CZ_NAME", "TOR_LENGTH", "line_mi"]].round(2).to_string())
straight line / recorded length: median 1.00; within 10%: 88.0%; points begin = end: 82
STATE CZ_NAME TOR_LENGTH line_mi
59283 MICHIGAN GRAND TRAVERSE 0.10 0.00
69767 SOUTH DAKOTA CORSON 0.01 0.21
For most segments the straight line matches the surveyed length: the median ratio is 1.00 and 88.0% are within 10%. 82 segments begin and end at the same point, mostly brief touchdowns given one location. A few disagree badly: a Grand Traverse County segment recorded as 0.10 miles has identical points, and a Corson County one recorded as 0.01 miles has points 0.21 miles apart. Use TOR_LENGTH for statistics about path length, and use the line for mapping.
3. Give the line its width
tracks["width_m"] = tracks.TOR_WIDTH * 0.9144
paths = tracks.copy()
paths["geometry"] = tracks.buffer(tracks.width_m / 2, cap_style="flat")
print(f"median width {tracks.TOR_WIDTH.median():.0f} yd, widest {tracks.TOR_WIDTH.max():,.0f} yd; "
      f"damage path area {paths.area.sum() / 1e6:,.0f} km2")
median width 100 yd, widest 3,000 yd; damage path area 4,044 km2
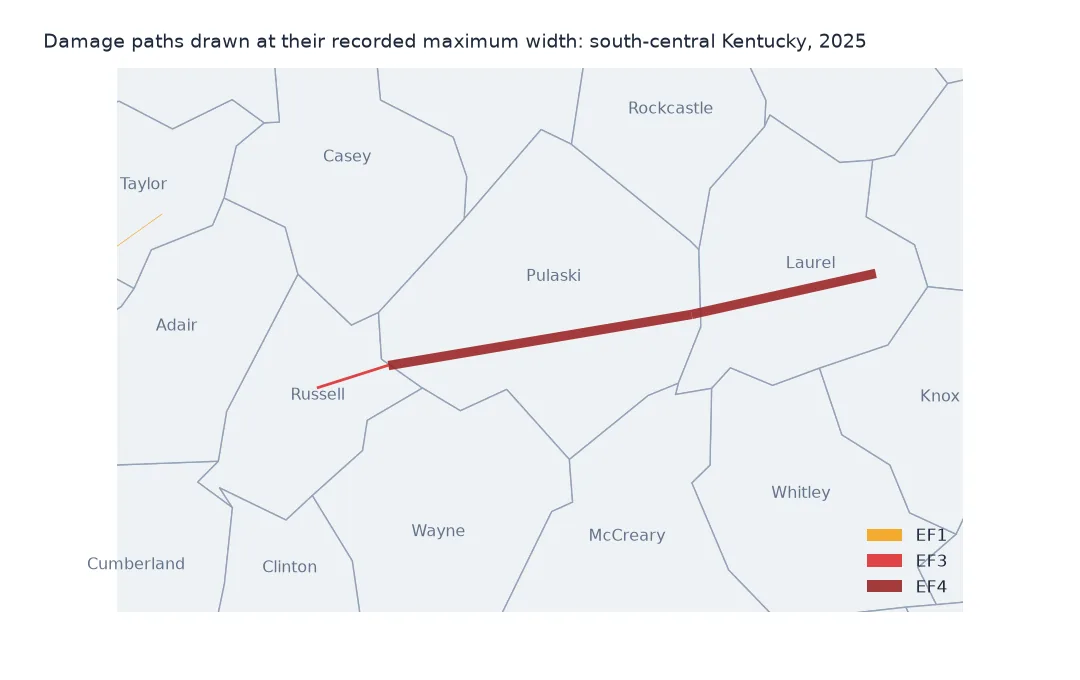
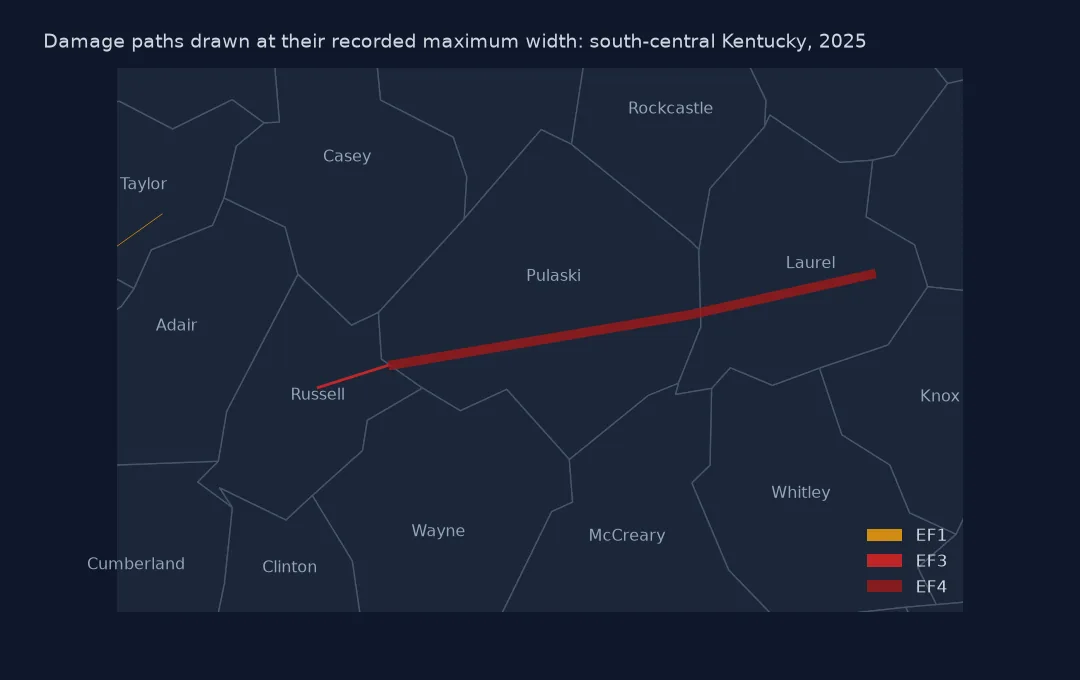
The median segment is 100 yards wide, and the widest is 3,000 yards, nearly 2 miles. Buffering each line by half its width gives damage paths with a combined area of 4,044 km². This is an upper bound, because TOR_WIDTH is the maximum width along the segment, not the average.
4. Colour by rating
order = ["EFU", "EF0", "EF1", "EF2", "EF3", "EF4", "EF5"]
s = tracks.groupby("TOR_F_SCALE").agg(n=("EVENT_ID", "size"), miles=("line_mi", "sum"), widest=("TOR_WIDTH", "max")).reindex(order)
print(s.round(0).to_string())
n miles widest
TOR_F_SCALE
EFU 253 261.0 1000.0
EF0 492 1082.0 1750.0
EF1 623 2890.0 2300.0
EF2 174 1364.0 2200.0
EF3 42 526.0 3000.0
EF4 6 95.0 1700.0
EF5 1 5.0 1850.0
Strong tornadoes are rare but long. The 42 EF3 segments cover 526 miles of path, while the 492 EF0 segments cover 1,082. The widest paths belong to EF3s (3,000 yards) and the EF1s (2,300). A map coloured by rating with line width scaled to path width shows that at once, where a plain point map would make every EF0 touchdown as prominent as the Kentucky EF4.
Long tracks and the counties they crossed
The data used on this page
The National Centers for Environmental Information's Storm Events Database details file for 2025, and Census Bureau 2023 county and state boundaries.
from pathlib import Path

import geopandas as gpd
import numpy as np
import pandas as pd
import requests

Path("data").mkdir(exist_ok=True)
# NOAA NCEI Storm Events Database: the 2025 details and fatalities files (revision c20260819) and the 2024 details file
# (revision c20260728), saved on this site on 15 October 2026 because NCEI replaces a year's files whenever it revises
# them and the old names disappear. Live: https://www.ncei.noaa.gov/pub/data/swdi/stormevents/csvfiles/
FILES = ["storm-events-details-2025-c20260819.csv.gz", "storm-events-fatalities-2025-c20260819.csv.gz",
         "storm-events-details-2024-c20260728.csv.gz"]
for name in FILES:
    if not Path(f"data/{name}").exists():
        Path(f"data/{name}").write_bytes(requests.get(f"https://data.spatialworkflow.io/{name}", timeout=600).content)
ev = pd.read_csv("data/storm-events-details-2025-c20260819.csv.gz", low_memory=False)


def dollars(s):
    """Damage is stored as text: '10.00K', '1.60B', '0' or blank. A blank means no estimate, not zero."""
    s = s.str.strip()
    return pd.to_numeric(s.str.rstrip("KMB"), errors="coerce") * s.str[-1].map({"K": 1e3, "M": 1e6, "B": 1e9}).fillna(1.0)


def times(df):
    """Event times are local to the county or zone ('CST-6'), with a two-digit year."""
    df["begin"] = pd.to_datetime(df.BEGIN_DATE_TIME, format="%d-%b-%y %H:%M:%S")
    df["end"] = pd.to_datetime(df.END_DATE_TIME, format="%d-%b-%y %H:%M:%S")
    df["utc_offset"] = df.CZ_TIMEZONE.str.extract(r"(-?\d+)$")[0].astype(int)
    df["begin_utc"] = df.begin - pd.to_timedelta(df.utc_offset, unit="h")
    df["prop"], df["crops"] = dollars(df.DAMAGE_PROPERTY), dollars(df.DAMAGE_CROPS)
    return df


ev = times(ev)
for name, url in {"cb_2023_us_county_20m.zip": "https://www2.census.gov/geo/tiger/GENZ2023/shp/cb_2023_us_county_20m.zip",
                  "cb_2023_us_state_20m.zip": "https://www2.census.gov/geo/tiger/GENZ2023/shp/cb_2023_us_state_20m.zip"}.items():
    if not Path(f"data/{name}").exists():
        Path(f"data/{name}").write_bytes(requests.get(url, timeout=300).content)
counties = gpd.read_file("data/cb_2023_us_county_20m.zip").to_crs(5070)
states = gpd.read_file("data/cb_2023_us_state_20m.zip").to_crs(5070)
print(f"{len(ev):,} Storm Events records for 2025, {ev.EPISODE_ID.nunique():,} episodes, {ev.EVENT_TYPE.nunique()} event types")
72,360 Storm Events records for 2025, 9,846 episodes, 48 event types
Example 1: the longest tracks
cols = ["STATE", "CZ_NAME", "begin", "TOR_F_SCALE", "TOR_LENGTH", "TOR_WIDTH", "DEATHS_DIRECT"]
print(tracks.sort_values("TOR_LENGTH", ascending=False)[cols].head(6).to_string(index=False))
STATE CZ_NAME begin TOR_F_SCALE TOR_LENGTH TOR_WIDTH DEATHS_DIRECT
INDIANA MONROE 2025-05-16 18:27:00 EF2 35.27 350.0 0
KENTUCKY PULASKI 2025-05-16 21:35:00 EF4 32.30 1700.0 1
MISSISSIPPI WAYNE 2025-02-12 19:43:00 EF3 27.49 910.0 0
MISSOURI HOWELL 2025-03-14 19:44:00 EF3 27.38 1200.0 0
MISSOURI OREGON 2025-03-14 20:11:00 EF3 26.84 800.0 0
ALABAMA WALKER 2025-03-15 15:25:00 EF2 26.08 1000.0 0
The longest single segment is 35.27 miles in Monroe County, Indiana, on 16 May. On the same evening an EF4 crossed Pulaski County, Kentucky, for 32.30 miles. Both tornadoes were longer than these rows, because they continued into neighbouring counties as separate segments. The 14 March Missouri outbreak puts two EF3 segments in the top five.
Example 2: which counties the tracks crossed
hit = gpd.sjoin(counties[["GEOID", "NAME", "STUSPS", "geometry"]], tracks[["EVENT_ID", "geometry"]], predicate="intersects")
n = hit.groupby(["GEOID", "NAME", "STUSPS"]).EVENT_ID.nunique().sort_values(ascending=False)
print(f"counties crossed by a 2025 track: {len(n):,}; most segments:")
print(n.head(5).to_string())
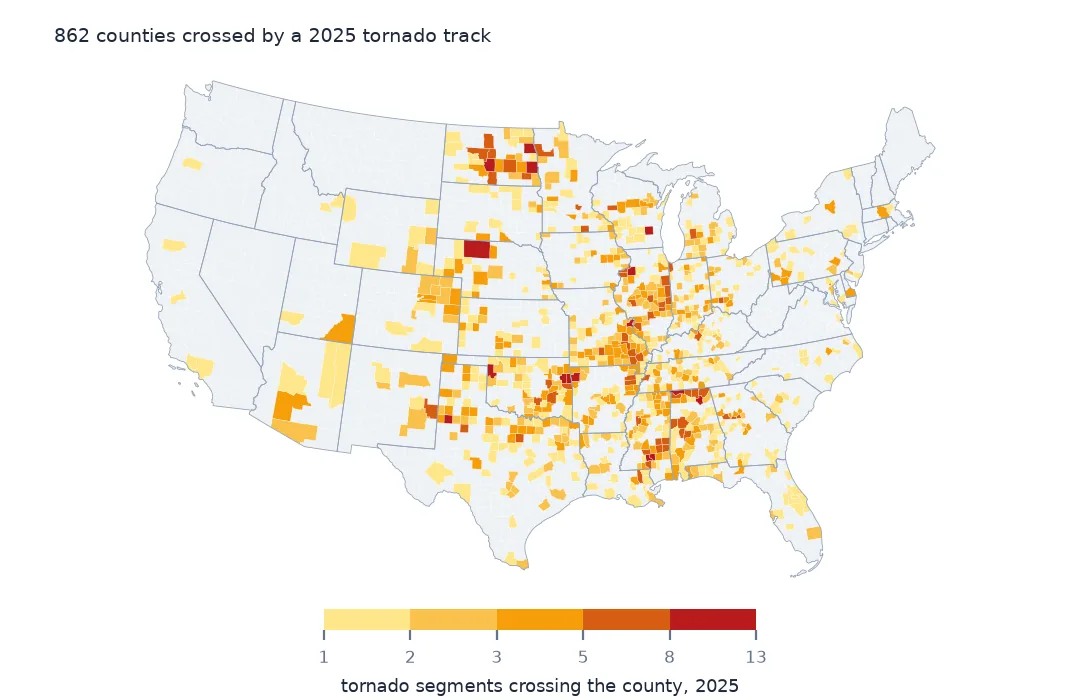
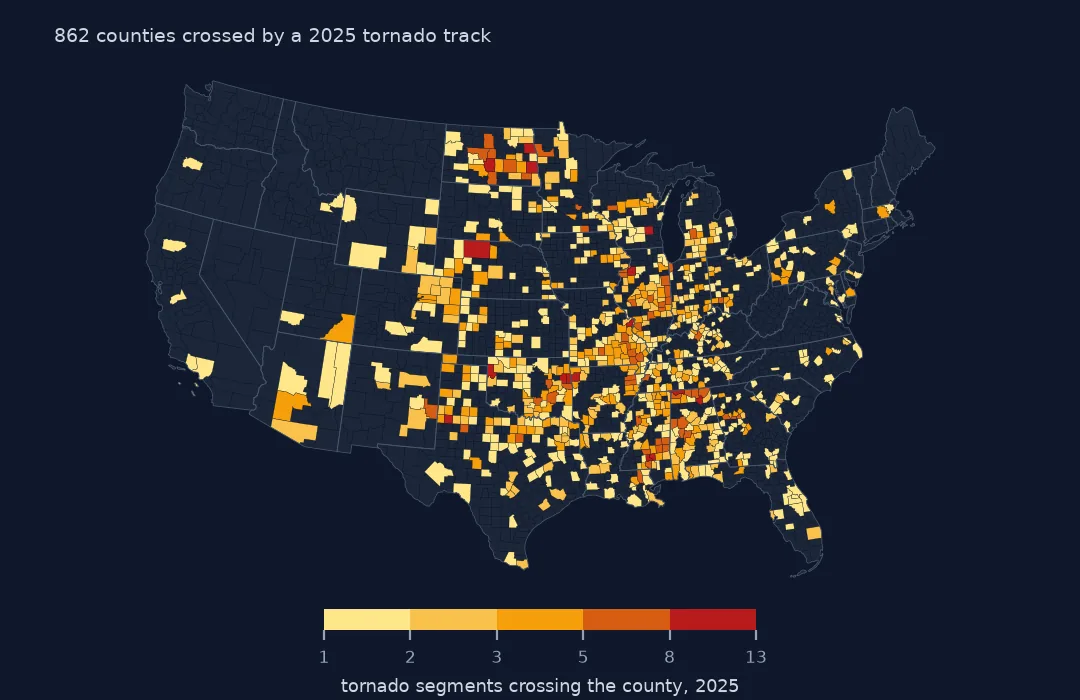
counties crossed by a 2025 track: 862; most segments:
GEOID NAME STUSPS
38015 Burleigh ND 12
31031 Cherry NE 12
40021 Cherokee OK 11
38035 Grand Forks ND 11
48219 Hockley TX 10
Tracks crossed 862 counties. Burleigh County, North Dakota and Cherry County, Nebraska were crossed by the most segments, 12 each. Large counties collect more tracks for the same tornado density, so normalise by area before comparing them.
What the begin and end points are
After a tornado, the local Weather Service office surveys the damage and records where the path began and ended in each county, its length along the ground and its widest point. The two points are the ends of the damage path within that county, not radar positions, and the path between them is usually close to straight. Tornadoes rarely curve much over a few miles, which is why the straight line matches the recorded length for most segments.
The rating is the highest EF level found anywhere in that segment's damage, based on what was damaged. A strong tornado over farmland can be rated low or EFU because there was nothing to damage, which is one reason EF ratings undercount strong tornadoes away from towns.
Drawing tracks that read correctly
- Measure in a projected CRS. Lengths in degrees are meaningless, and Web Mercator overstates them by about a quarter at Plains latitudes.
- Zero-length lines. Draw segments whose begin and end points coincide as points, or a buffer will make an invisible sliver.
- Join segments before ranking tornadoes. A track that crosses counties is several rows. Join them before ranking the longest tornadoes, or a long one will lose to a short one that stayed in one county.
- The locations file has extra points for some events, but not enough to draw curved paths for most tornadoes.
Internal links
- Tornado counts too high — joining a tornado's county segments
- How to read the Storm Events database — the files and fields
- How to chart the severe weather season — when tornadoes happen
FAQ
How do I map tornado paths from NOAA data?
Build a line from each tornado row's begin and end coordinates in the Storm Events details file, project it, and buffer by half of TOR_WIDTH (yards × 0.9144 for metres) for the damage path.
What does EFU mean in tornado data?
Unknown rating. The tornado did not damage anything a survey could use to estimate its wind. In 2025, 253 tornado segments were EFU.