
Storm Events Will Not Join to Counties: Forecast Zones Are Not FIPS Codes
On this page
Problem statement
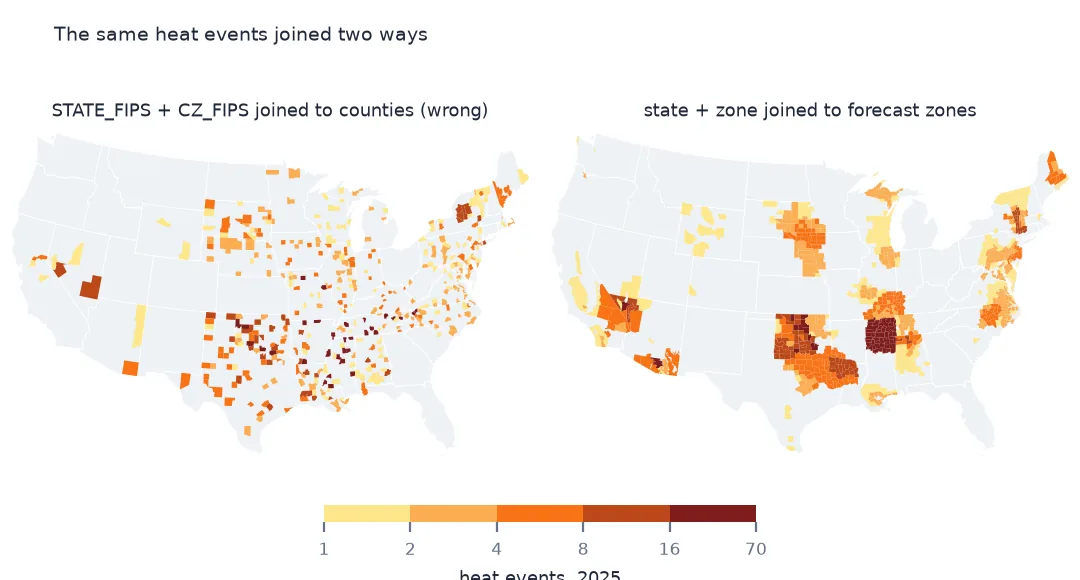
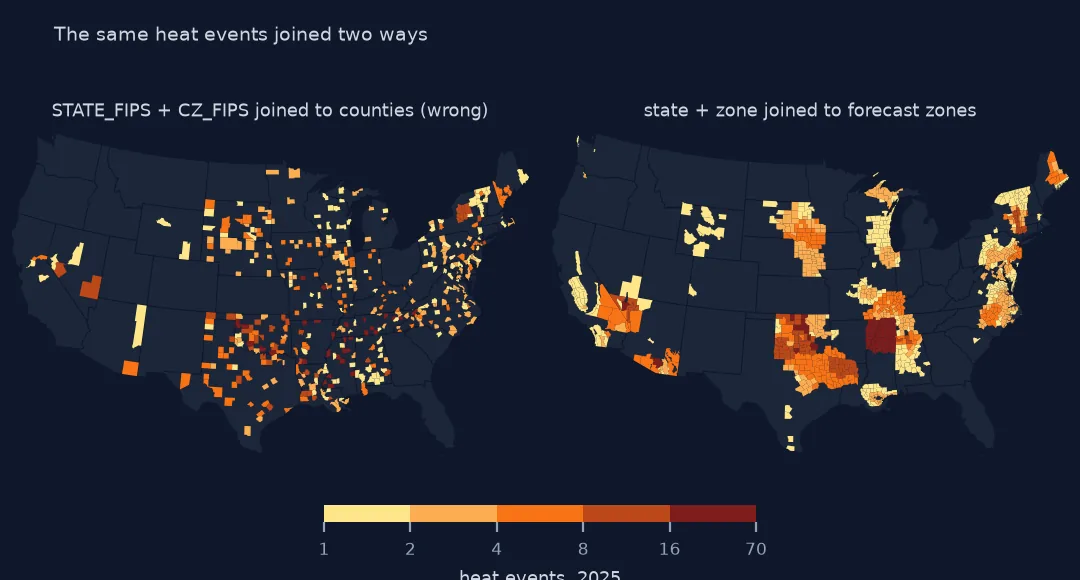
The Storm Events database gives every row a STATE_FIPS and a CZ_FIPS, and joining them to Census counties looks routine: pad, concatenate, merge. For hail and tornadoes it works. For heat, snow, high wind and drought, most rows either fail to match or, worse, match the wrong county. Those rows are coded by National Weather Service forecast zone, and CZ_FIPS is then a zone number that happens to look like a county code. In 2025, 30,710 rows are zone-based. This page shows the wrong join, the right one against the Weather Service's zone boundaries, and how to move zone counts onto counties when you need them there.
Quick answer
Split on CZ_TYPE. For C rows the county GEOID is STATE_FIPS + CZ_FIPS. For Z rows build the zone key as the two-letter state abbreviation + CZ_FIPS padded to three digits (VA056), and join to STATE_ZONE in the Weather Service's public forecast zone shapefile. Rows in marine zones need the marine zone file.
ev["key"] = ev.STATE_FIPS.astype(int).astype(str).str.zfill(2) + ev.CZ_FIPS.astype(int).astype(str).str.zfill(3)
naive = ev.merge(counties[["GEOID", "NAME"]], left_on="key", right_on="GEOID", how="left")
print(naive.groupby("CZ_TYPE").GEOID.apply(lambda s: f"{s.notna().mean():.1%} matched a county").to_string())
z = naive[(naive.CZ_TYPE == "Z") & naive.GEOID.notna()]
print(f"zone rows that 'matched': {len(z):,}; same name as the county they matched: {(z.CZ_NAME.str.upper() == z.NAME.str.upper()).mean():.1%}")
CZ_TYPE
C 98.4% matched a county
Z 39.2% matched a county
zone rows that 'matched': 12,049; same name as the county they matched: 1.3%
98.4% of county rows match a county. 39.2% of zone rows also "match", and that is the trap: of the 12,049 zone rows that found a county, only 1.3% found one with the same name. The rest landed on whatever county happens to share the zone's number. A heat map built this way draws zone events on unrelated counties, without any error.
From zone codes to zone boundaries
1. Read CZ_TYPE first
print(ev.CZ_TYPE.value_counts().to_dict())
print(ev[ev.CZ_TYPE == "Z"][["STATE", "CZ_FIPS", "CZ_NAME", "EVENT_TYPE"]].head(4).to_string(index=False))
{'C': 41650, 'Z': 30710}
STATE CZ_FIPS CZ_NAME EVENT_TYPE
VIRGINIA 56 SPOTSYLVANIA Winter Storm
MARYLAND 506 CENTRAL AND SOUTHEAST HOWARD Winter Weather
MARYLAND 504 CENTRAL AND SOUTHEAST MONTGOMERY Winter Weather
MARYLAND 503 NORTHWEST MONTGOMERY Winter Weather
41,650 rows are county-based and 30,710 zone-based. The first zone rows show the problem: CENTRAL AND SOUTHEAST HOWARD and NORTHWEST MONTGOMERY in Maryland are parts of counties, numbered 503–506. Zones split counties by elevation or climate and sometimes merge small ones, so even the numbers that look like county codes do not mean counties.
2. Get the zone boundaries
# NWS public forecast zones of 18 March 2025, saved on this site (live: https://www.weather.gov/source/gis/Shapefiles/WSOM/z_18mr25.zip)
zfile = Path("data/nws-public-zones-z_18mr25-2026-10-15.zip")
if not zfile.exists():
    zfile.write_bytes(requests.get(f"https://data.spatialworkflow.io/{zfile.name}", timeout=600).content)
zones = gpd.read_file(zfile).to_crs(5070)
print(f"{len(zones):,} public forecast zones; key example {zones.STATE_ZONE.iloc[0]}; "
      f"duplicated keys: {zones.STATE_ZONE.duplicated().sum()}")
zones = zones.dissolve("STATE_ZONE", as_index=False)
4,114 public forecast zones; key example AL019; duplicated keys: 88
The Weather Service's public zone file of 18 March 2025 has 4,114 polygons keyed by STATE_ZONE, such as AL019. 88 keys appear more than once, because some zones are split into several polygons (islands, or pieces on both sides of a lake). Dissolve on the key before joining, or each event will match more than once.
3. Build the zone key from the state abbreviation
abbr = states.set_index("STATEFP").STUSPS
zev = ev[ev.CZ_TYPE == "Z"].copy()
zev["STATE_ZONE"] = zev.STATE_FIPS.astype(int).astype(str).str.zfill(2).map(abbr) + zev.CZ_FIPS.astype(int).astype(str).str.zfill(3)
ok = zev.STATE_ZONE.isin(zones.STATE_ZONE)
print(f"zone events matched: {ok.mean():.1%}; unmatched by state: {zev[~ok].STATE.value_counts().head(5).to_dict()}")
zone events matched: 91.5%; unmatched by state: {'ATLANTIC NORTH': 763, 'GULF OF MEXICO': 654, 'ATLANTIC SOUTH': 596, 'LAKE MICHIGAN': 154, 'LAKE SUPERIOR': 82}
With the state abbreviation and the padded zone number, 91.5% of zone events match a zone. Most of the rest are not on land: the Atlantic (763 north and 596 south), the Gulf of Mexico (654) and the Great Lakes, which use marine zone codes in a separate file.
4. Marine zones are in another file
print(zev[~ok].EVENT_TYPE.value_counts().head(5).to_dict())
print(f"unmatched with a state that is a sea or lake: {zev[~ok].STATE_FIPS.astype(int).ge(60).mean():.1%}")
{'Marine Thunderstorm Wind': 2126, 'Waterspout': 149, 'Marine High Wind': 83, 'High Wind': 40, 'Winter Weather': 33}
unmatched with a state that is a sea or lake: 96.4%
96.4% of the unmatched rows have a sea or lake as their "state" (state codes 60 and above), almost all marine thunderstorm wind and waterspouts. The few land rows left, such as 40 high-wind and 33 winter-weather events, are zones renumbered or redrawn during the year. For those, use the zone file that was in force on the event date. The Weather Service keeps dated versions.
Heat by zone, and zones onto counties
The data used on this page
The National Centers for Environmental Information's Storm Events Database details file for 2025, the National Weather Service's public forecast zones of 18 March 2025 (saved on this site), and Census Bureau 2023 county and state boundaries.
from pathlib import Path

import geopandas as gpd
import numpy as np
import pandas as pd
import requests

Path("data").mkdir(exist_ok=True)
# NOAA NCEI Storm Events Database: the 2025 details and fatalities files (revision c20260819) and the 2024 details file
# (revision c20260728), saved on this site on 15 October 2026 because NCEI replaces a year's files whenever it revises
# them and the old names disappear. Live: https://www.ncei.noaa.gov/pub/data/swdi/stormevents/csvfiles/
FILES = ["storm-events-details-2025-c20260819.csv.gz", "storm-events-fatalities-2025-c20260819.csv.gz",
         "storm-events-details-2024-c20260728.csv.gz"]
for name in FILES:
    if not Path(f"data/{name}").exists():
        Path(f"data/{name}").write_bytes(requests.get(f"https://data.spatialworkflow.io/{name}", timeout=600).content)
ev = pd.read_csv("data/storm-events-details-2025-c20260819.csv.gz", low_memory=False)


def dollars(s):
    """Damage is stored as text: '10.00K', '1.60B', '0' or blank. A blank means no estimate, not zero."""
    s = s.str.strip()
    return pd.to_numeric(s.str.rstrip("KMB"), errors="coerce") * s.str[-1].map({"K": 1e3, "M": 1e6, "B": 1e9}).fillna(1.0)


def times(df):
    """Event times are local to the county or zone ('CST-6'), with a two-digit year."""
    df["begin"] = pd.to_datetime(df.BEGIN_DATE_TIME, format="%d-%b-%y %H:%M:%S")
    df["end"] = pd.to_datetime(df.END_DATE_TIME, format="%d-%b-%y %H:%M:%S")
    df["utc_offset"] = df.CZ_TIMEZONE.str.extract(r"(-?\d+)$")[0].astype(int)
    df["begin_utc"] = df.begin - pd.to_timedelta(df.utc_offset, unit="h")
    df["prop"], df["crops"] = dollars(df.DAMAGE_PROPERTY), dollars(df.DAMAGE_CROPS)
    return df


ev = times(ev)
for name, url in {"cb_2023_us_county_20m.zip": "https://www2.census.gov/geo/tiger/GENZ2023/shp/cb_2023_us_county_20m.zip",
                  "cb_2023_us_state_20m.zip": "https://www2.census.gov/geo/tiger/GENZ2023/shp/cb_2023_us_state_20m.zip"}.items():
    if not Path(f"data/{name}").exists():
        Path(f"data/{name}").write_bytes(requests.get(url, timeout=300).content)
counties = gpd.read_file("data/cb_2023_us_county_20m.zip").to_crs(5070)
states = gpd.read_file("data/cb_2023_us_state_20m.zip").to_crs(5070)
print(f"{len(ev):,} Storm Events records for 2025, {ev.EPISODE_ID.nunique():,} episodes, {ev.EVENT_TYPE.nunique()} event types")
72,360 Storm Events records for 2025, 9,846 episodes, 48 event types
Example 1: heat events per zone
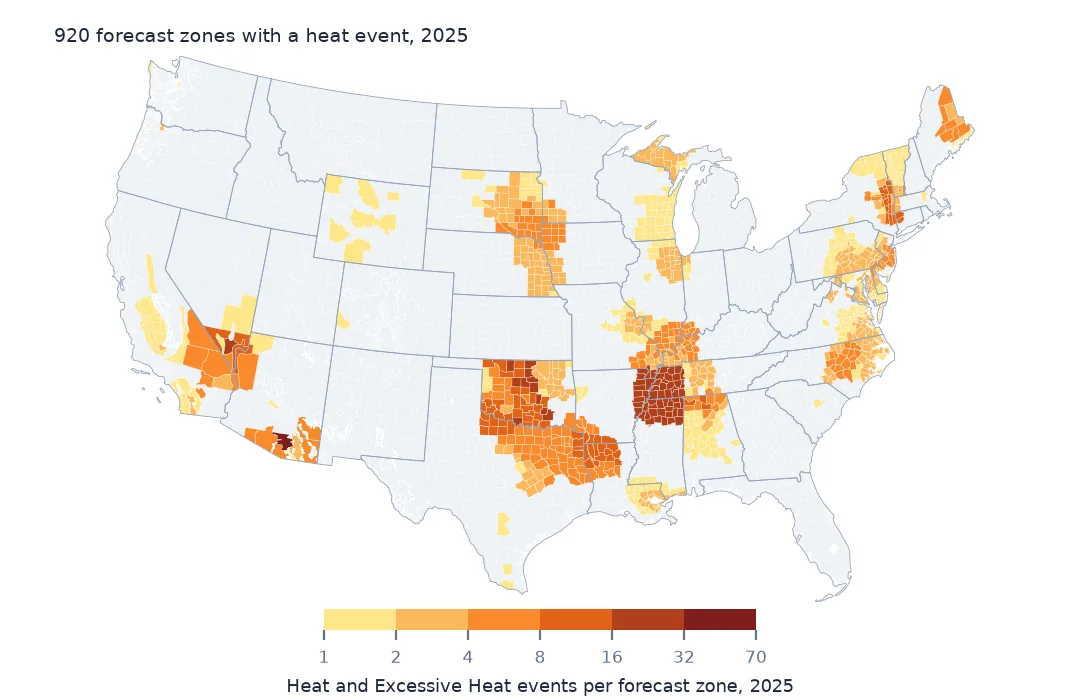
heat = zev[ok & zev.EVENT_TYPE.isin(["Heat", "Excessive Heat"])].groupby("STATE_ZONE").size().rename("heat_events")
hz = zones.merge(heat, on="STATE_ZONE", how="left").fillna({"heat_events": 0})
top = hz.sort_values("heat_events").iloc[-1]
print(f"zones with a heat event: {(hz.heat_events > 0).sum():,}; most: {top.STATE_ZONE} ({top.NAME}), {top.heat_events:.0f} events")
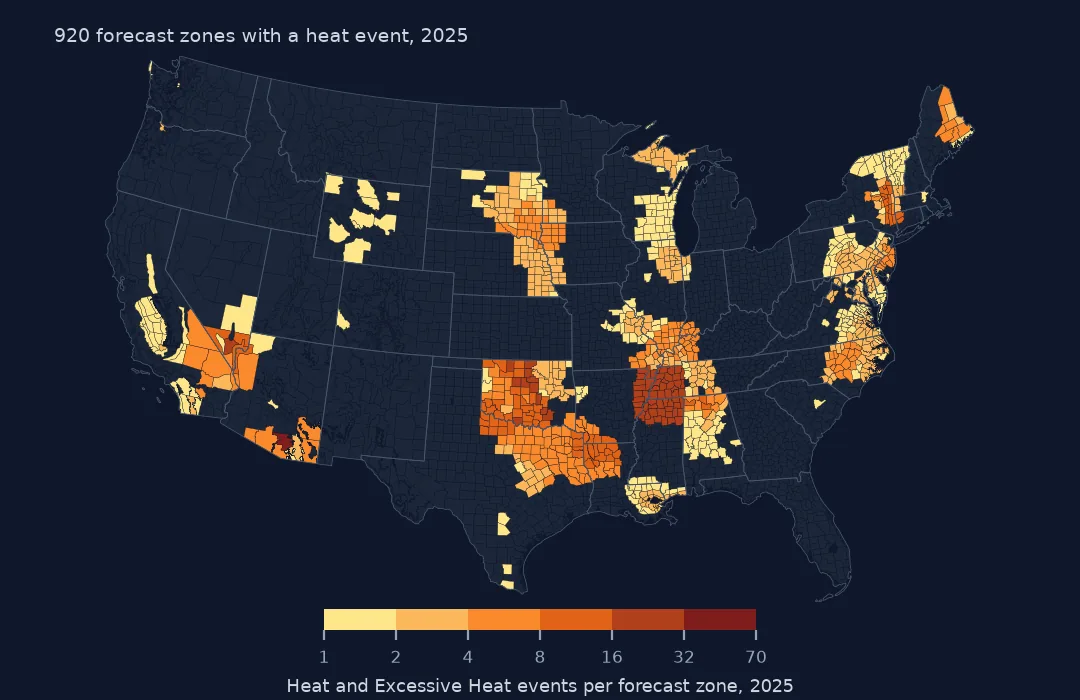
zones with a heat event: 920; most: AZ504 (Tucson Metro Area including Tucson/Green Valley/Marana/Vail), 67 events
920 zones had at least one heat event in 2025. The Tucson metro zone (AZ504) had the most, 67. Heat is entered per zone and period, so a long heat wave is many rows. Count days with a heat event if you want a measure of exposure.
Example 2: zones to counties by area
ov = gpd.overlay(hz[hz.heat_events > 0][["STATE_ZONE", "heat_events", "geometry"]], counties[["GEOID", "geometry"]], how="intersection")
ov["w"] = ov.area / ov.area.groupby(ov.STATE_ZONE).transform("sum")
print(f"zone pieces: {len(ov):,}; zones with 95% or more of their area in one county: {(ov.groupby('STATE_ZONE').w.max() >= 0.95).mean():.1%}")
zone pieces: 5,470; zones with 95% or more of their area in one county: 91.5%
To report zone events by county, intersect zones with counties and weight by area. The 920 heat zones cut into 5,470 pieces, many of them slivers along shared boundaries, and 91.5% of zones have at least 95% of their area in a single county. Assigning each zone to its majority county is close enough in most of the East. In the West, where zones follow mountains and deserts, keep the area weights.
Why zones and counties differ
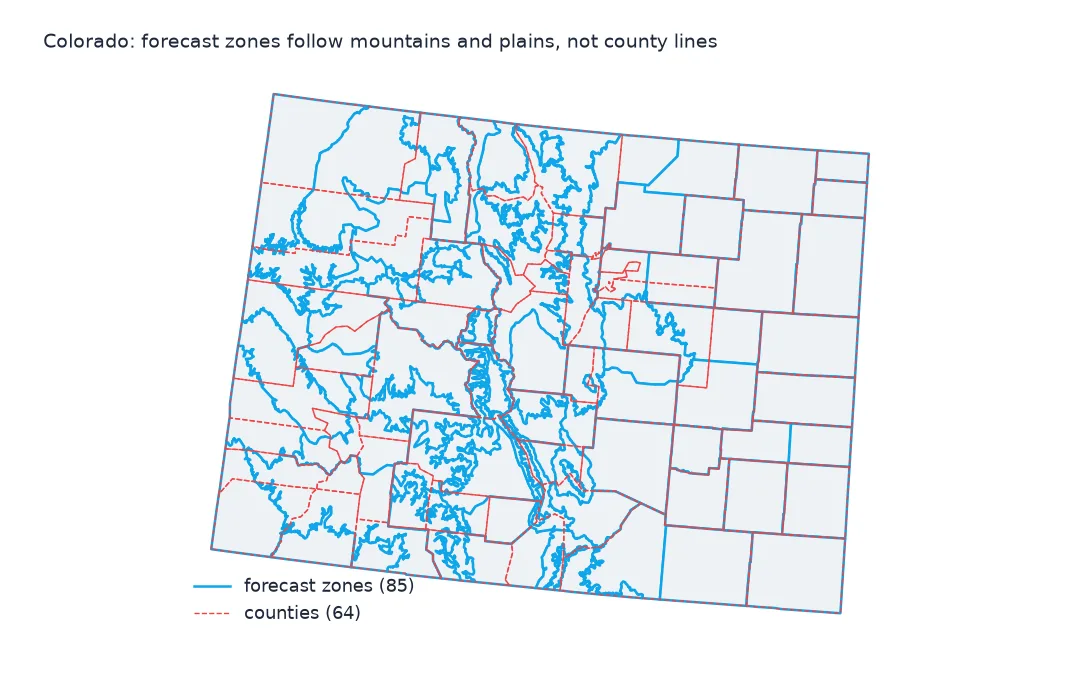
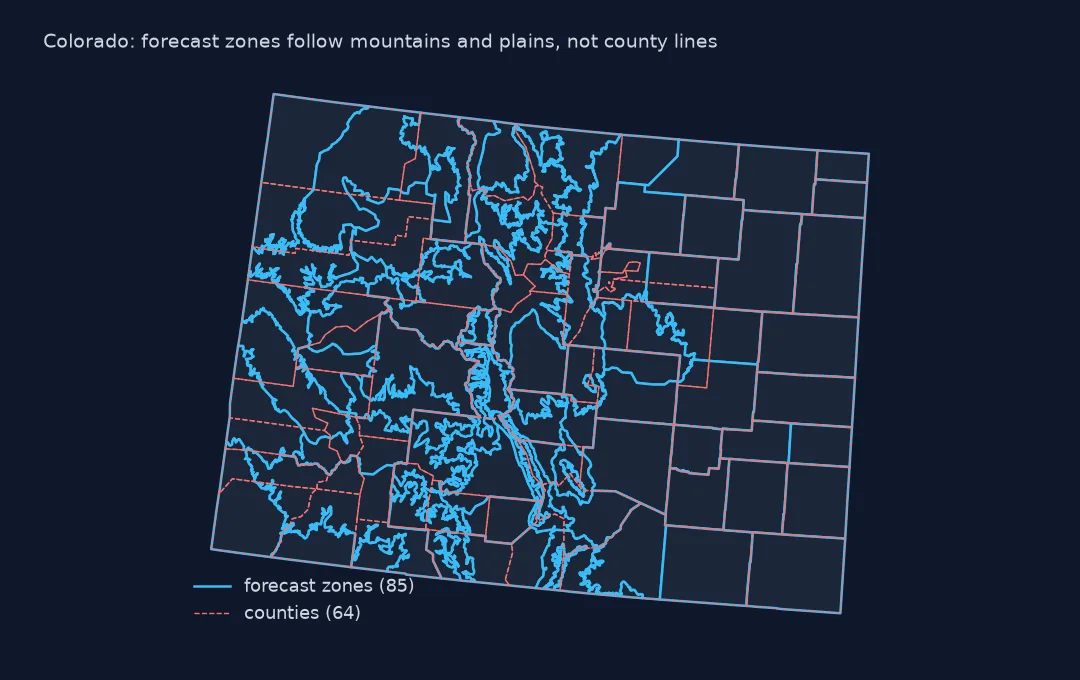
Weather Service warnings for convective storms (tornado, severe thunderstorm and flash flood warnings) are issued for counties or for polygons drawn on radar, so the events that verify them are entered by county. Forecasts and the advisories built on them (heat, winter storm, wind and fire weather) are issued for public forecast zones. These were drawn to group places with similar weather: valley and mountain, coast and inland, a city and its suburbs. In much of the East a zone is one county. In the West and in mountains, zones cut across county lines or split one county into several.
Storm Data uses the same unit as the product that was or would have been issued. That is why one file mixes two incompatible geographies, and why CZ_TYPE has to be checked before any join.
Other joining problems
- Zone files change. The Weather Service issues new zone boundaries several times a year. Keep the file in force for the year you analyse, here the 18 March 2025 one.
- Marine zones (
ANZ,GMZ,LMZprefixes) are in the separate marine and coastal zone files. - Independent cities and Connecticut affect the county side: check the county file's vintage against the year of the events.
- Fire weather zones are a third geography, used for red flag warnings, and are not in the public zone file.
Internal links
- How to read the Storm Events database — the files and fields
- How to map hail reports by county — a county join that works
- Storm Events, episodes and county segments — what one row is
FAQ
What does CZ_TYPE mean in Storm Events?
C means the row's CZ_FIPS is a county FIPS code. Z means it is a Weather Service forecast zone number, including marine zones. In 2025, 30,710 rows are zone-based.
How do I join Storm Events zone rows to a map?
Make the key from the state's two-letter abbreviation plus the zone number padded to three digits, and join it to STATE_ZONE in the Weather Service public forecast zone shapefile.