
How to Chart the Severe Weather Season: Tornadoes, Hail and Wind by Month and Hour
On this page
Problem statement
When is severe weather season? In the US the answer differs for tornadoes, hail and damaging wind, by hour as well as by month, and it moves north through the year. The Storm Events database has every 2025 report with a local time, so the season can be charted directly. Two choices change the picture: which clock to use for the hour of day, and whether to count reports or days. This page charts tornadoes, hail and thunderstorm wind by month and hour, compares 2025 with 2024, and shows why one year is too short to read a weekday pattern.
Quick answer
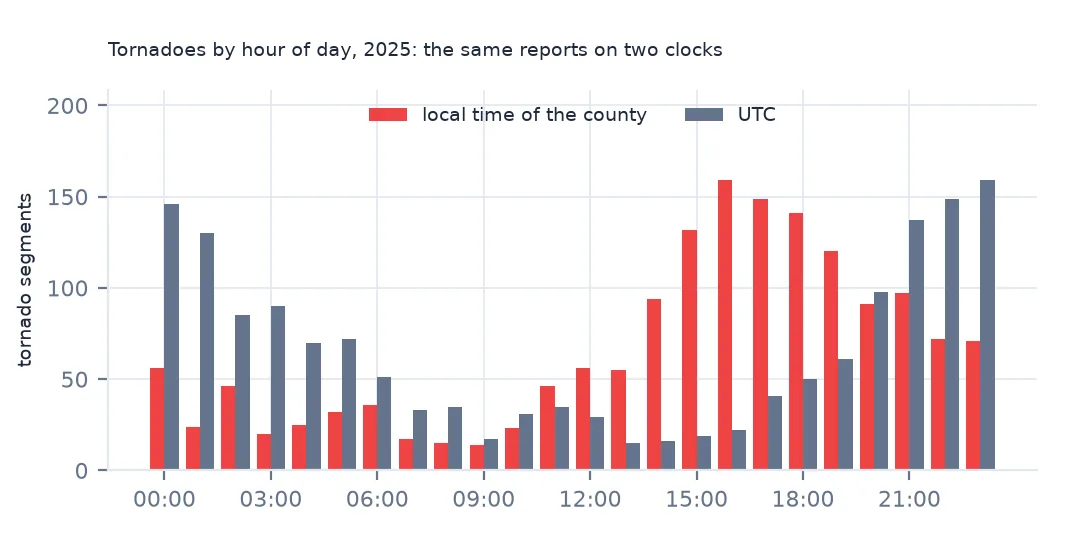
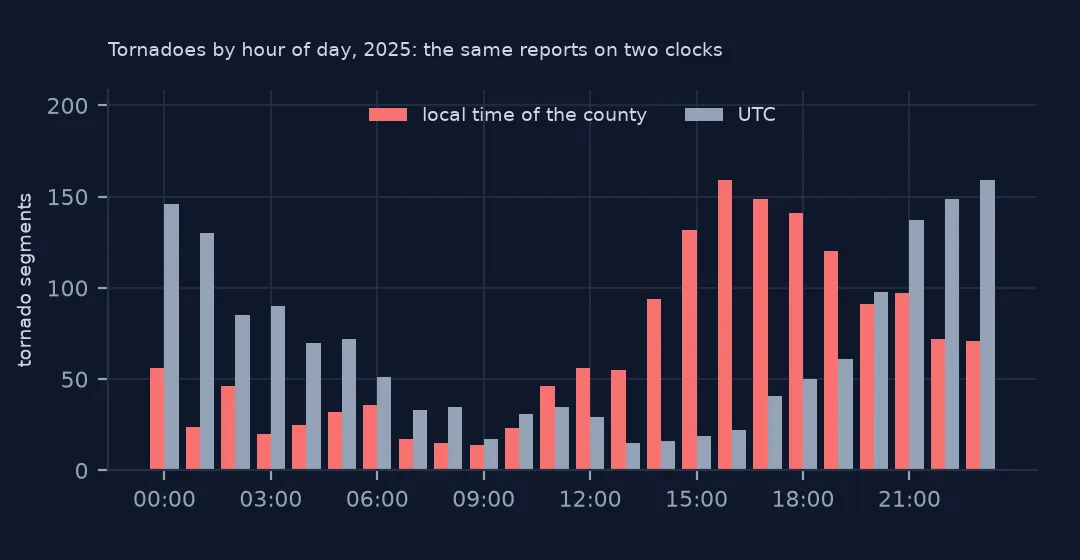
Filter the three convective event types, group by begin.dt.month (local time) and EVENT_TYPE, and plot the counts. For the hour of day use the local time, not UTC: storms follow the sun, and UTC moves the afternoon peak to late evening.
sev = ev[ev.EVENT_TYPE.isin(["Tornado", "Hail", "Thunderstorm Wind"])]
by_month = sev.groupby([sev.begin.dt.month, "EVENT_TYPE"]).size().unstack(fill_value=0)
print(by_month.to_string())
print("peak month:", by_month.idxmax().to_dict())
EVENT_TYPE Hail Thunderstorm Wind Tornado
begin
1 4 56 19
2 42 575 44
3 1084 2390 316
4 1820 2766 370
5 2835 3895 321
6 1384 5266 265
7 768 3793 93
8 494 1629 50
9 544 783 59
10 100 207 27
11 128 143 12
12 2 304 15
peak month: {'Hail': 5, 'Thunderstorm Wind': 6, 'Tornado': 4}
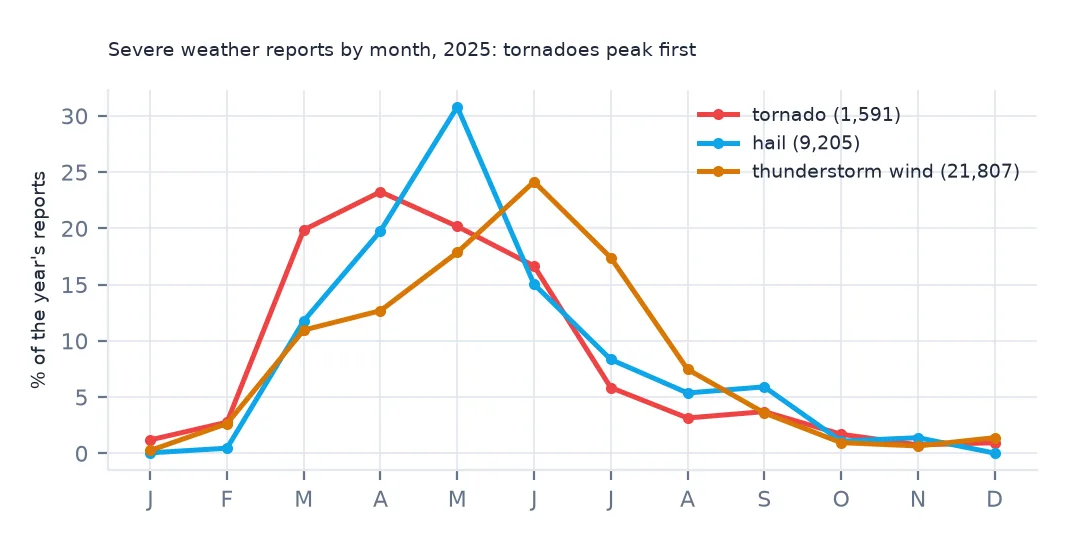
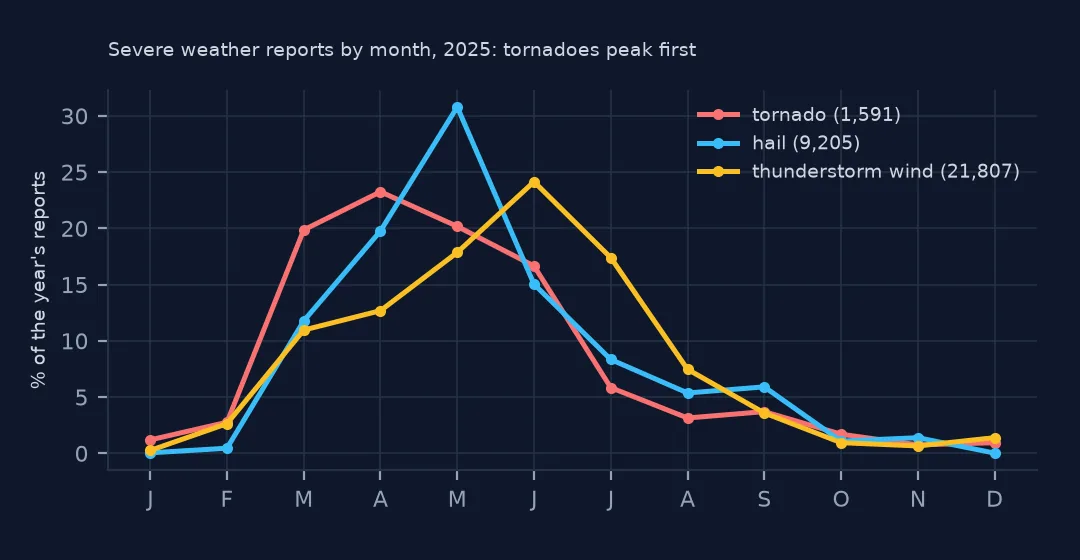
2025's tornado reports peaked in April (370 segments) and were nearly as high in March and May. Hail peaked in May (2,835) and thunderstorm wind in June (5,266). Tornadoes come first because they need strong wind shear, which is greatest in spring when the jet stream is still over the southern states. Hail and wind follow the heat and moisture of early summer.
Hours, days and latitude
1. Use local time for the hour of day
loc_h = sev.groupby([sev.begin.dt.hour, "EVENT_TYPE"]).size().unstack(fill_value=0)
utc_h = sev.groupby([sev.begin_utc.dt.hour, "EVENT_TYPE"]).size().unstack(fill_value=0)
print("peak local hour:", loc_h.idxmax().to_dict(), "| peak UTC hour:", utc_h.idxmax().to_dict())
night = sev.begin.dt.hour.isin([22, 23, 0, 1, 2, 3, 4, 5])
print("share between 22:00 and 06:00 local:", night.groupby(sev.EVENT_TYPE).mean().round(3).to_dict())
peak local hour: {'Hail': 17, 'Thunderstorm Wind': 16, 'Tornado': 16} | peak UTC hour: {'Hail': 23, 'Thunderstorm Wind': 21, 'Tornado': 23}
share between 22:00 and 06:00 local: {'Hail': 0.115, 'Thunderstorm Wind': 0.185, 'Tornado': 0.217}
In local time, tornadoes and thunderstorm wind peak at 16:00 and hail at 17:00. In UTC the same peaks fall at 21:00–23:00. Night matters for safety: 21.7% of tornado segments began between 22:00 and 06:00 local time, when people are asleep and warnings are less likely to be heard, against 11.5% of hail.
2. Count days, not reports
days = sev.groupby("EVENT_TYPE").begin.apply(lambda s: s.dt.date.nunique())
print("days with at least one report:", days.to_dict())
top_days = sev[sev.EVENT_TYPE == "Tornado"].groupby(sev.begin.dt.date).size().sort_values(ascending=False).head(5)
print("busiest tornado days:", {str(k): v for k, v in top_days.items()})
days with at least one report: {'Hail': 234, 'Thunderstorm Wind': 265, 'Tornado': 167}
busiest tornado days: {'2025-04-02': 83, '2025-03-14': 81, '2025-03-15': 79, '2025-05-19': 53, '2025-03-30': 52}
Counting days instead of reports flattens the outbreaks. Tornadoes were reported on 167 days, hail on 234 and thunderstorm wind on 265. The five busiest tornado days, 2 April (83 segments), 14–15 March, 19 May and 30 March, produced more than a fifth of the year's tornado reports. A monthly chart of reports mostly shows when the outbreaks happened, and a chart of tornado days shows the season.
3. The season moves north
t = sev[(sev.EVENT_TYPE == "Tornado") & sev.BEGIN_LAT.notna()]
print("median tornado latitude by month:", t.groupby(t.begin.dt.month).BEGIN_LAT.median().round(1).to_dict())
median tornado latitude by month: {1: 32.9, 2: 34.1, 3: 35.7, 4: 36.0, 5: 36.9, 6: 39.9, 7: 42.2, 8: 42.5, 9: 45.0, 10: 30.5, 11: 33.8, 12: 40.4}
The season moves north. The median tornado latitude rises from 32.9° in January (the Gulf Coast) to 36.0° in April, 39.9° in June and 45.0° in September, on the northern Plains and in the upper Midwest. Autumn tornadoes return south (30.5° in October) with hurricanes and cold fronts. December's 40.4° comes from only 15 segments.
Comparing years and weekdays
The data used on this page
The National Centers for Environmental Information's Storm Events Database details files for 2025 and 2024.
from pathlib import Path

import geopandas as gpd
import numpy as np
import pandas as pd
import requests

Path("data").mkdir(exist_ok=True)
# NOAA NCEI Storm Events Database: the 2025 details and fatalities files (revision c20260819) and the 2024 details file
# (revision c20260728), saved on this site on 15 October 2026 because NCEI replaces a year's files whenever it revises
# them and the old names disappear. Live: https://www.ncei.noaa.gov/pub/data/swdi/stormevents/csvfiles/
FILES = ["storm-events-details-2025-c20260819.csv.gz", "storm-events-fatalities-2025-c20260819.csv.gz",
         "storm-events-details-2024-c20260728.csv.gz"]
for name in FILES:
    if not Path(f"data/{name}").exists():
        Path(f"data/{name}").write_bytes(requests.get(f"https://data.spatialworkflow.io/{name}", timeout=600).content)
ev = pd.read_csv("data/storm-events-details-2025-c20260819.csv.gz", low_memory=False)


def dollars(s):
    """Damage is stored as text: '10.00K', '1.60B', '0' or blank. A blank means no estimate, not zero."""
    s = s.str.strip()
    return pd.to_numeric(s.str.rstrip("KMB"), errors="coerce") * s.str[-1].map({"K": 1e3, "M": 1e6, "B": 1e9}).fillna(1.0)


def times(df):
    """Event times are local to the county or zone ('CST-6'), with a two-digit year."""
    df["begin"] = pd.to_datetime(df.BEGIN_DATE_TIME, format="%d-%b-%y %H:%M:%S")
    df["end"] = pd.to_datetime(df.END_DATE_TIME, format="%d-%b-%y %H:%M:%S")
    df["utc_offset"] = df.CZ_TIMEZONE.str.extract(r"(-?\d+)$")[0].astype(int)
    df["begin_utc"] = df.begin - pd.to_timedelta(df.utc_offset, unit="h")
    df["prop"], df["crops"] = dollars(df.DAMAGE_PROPERTY), dollars(df.DAMAGE_CROPS)
    return df


ev = times(ev)
print(f"{len(ev):,} Storm Events records for 2025, {ev.EPISODE_ID.nunique():,} episodes, {ev.EVENT_TYPE.nunique()} event types")
72,360 Storm Events records for 2025, 9,846 episodes, 48 event types
Example 1: 2025 against 2024, month by month
ev24 = times(pd.read_csv("data/storm-events-details-2024-c20260728.csv.gz", low_memory=False))
tm = pd.DataFrame({y: d[d.EVENT_TYPE == "Tornado"].begin.dt.month.value_counts().sort_index() for y, d in [("2024", ev24), ("2025", ev)]})
print(tm.fillna(0).astype(int).T.to_string())
begin 1 2 3 4 5 6 7 8 9 10 11 12
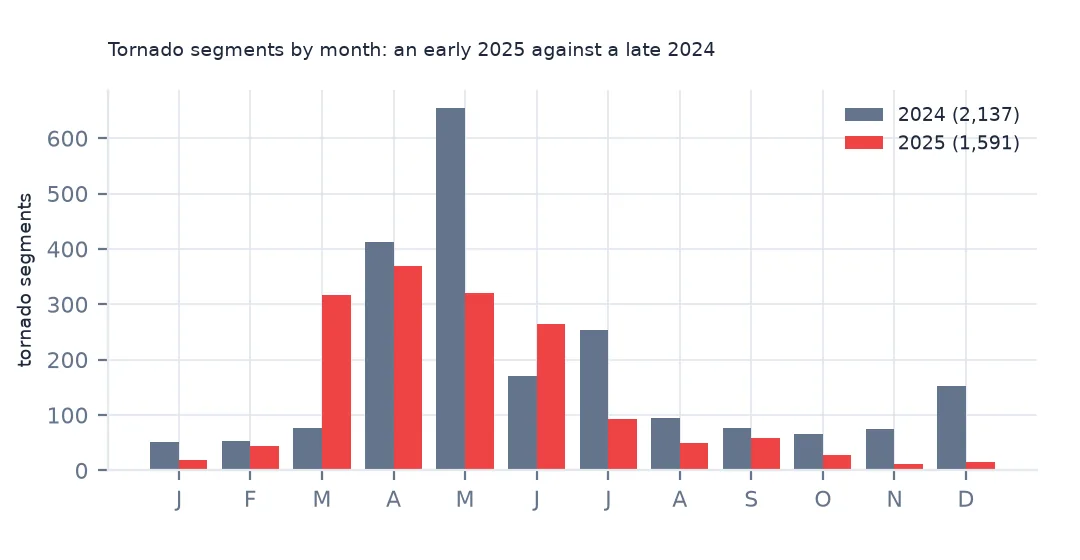
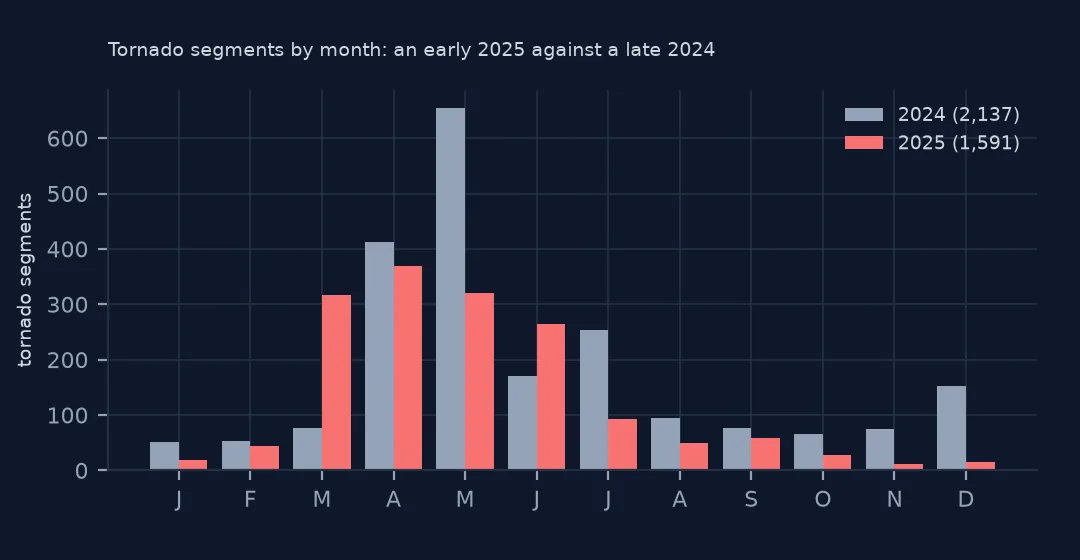
2024 52 54 77 413 655 170 253 95 76 66 74 152
2025 19 44 316 370 321 265 93 50 59 27 12 15
The two years had very different seasons. 2024 peaked late, with 655 tornado segments in May. 2025 peaked early, with 316 in March, when 2024 had only 77. 2024 also had a busy December (152) and 2025 a quiet one (15). A single year's monthly counts are mostly a record of which weeks had outbreaks. A climatology needs decades of the files.
Example 2: a weekday effect that should not exist
dow = sev.groupby([sev.begin.dt.dayofweek, "EVENT_TYPE"]).size().unstack()
print((dow / dow.mean()).round(2).rename(index=dict(enumerate("Mon Tue Wed Thu Fri Sat Sun".split()))).to_string())
EVENT_TYPE Hail Thunderstorm Wind Tornado
begin
Mon 1.00 0.69 0.80
Tue 0.79 1.05 0.86
Wed 0.70 0.95 0.94
Thu 1.21 1.13 0.70
Fri 1.33 1.02 1.20
Sat 0.80 1.03 1.06
Sun 1.17 1.14 1.46
Weather has no weekly cycle, yet 2025's tornado reports were 1.46 times the average on Sundays and 0.70 on Thursdays. Hail ranges from 0.70 on Wednesdays to 1.33 on Fridays. These are outbreak days landing on particular weekdays (30 March, with 52 segments, was a Sunday; 14–15 March a Friday and Saturday), not a reporting effect. Reporting does have a weekly element, with more spotters out at weekends, but one year cannot separate that from the outbreak calendar. A weekday chart needs many years and a test against shuffled dates.
What drives the season
Severe thunderstorms need moisture, instability and something to lift the air; tornadoes and very large hail also need strong vertical wind shear to organise storms into supercells. In early spring the jet stream crosses the southern US while Gulf moisture returns northward, so shear and moisture meet over the South and the lower Mississippi valley — the March and April peak. As summer comes the jet retreats north, the best overlap moves to the Plains and upper Midwest, and the southern states get heat and moisture without the shear, so they see wind and small hail rather than tornadoes. The daily cycle is solar heating: instability peaks in late afternoon, and storms that organise into lines can carry wind damage on through the night.
Pitfalls in seasonal charts
- Local time zones. The file is already local per zone, so do not convert to a single zone before taking the hour. Doing so smears the afternoon peak across three hours.
- County segments. Tornado reports are county segments. Link them into tornadoes before counting by month if long-track tornadoes matter.
- Month boundaries. Events that cross midnight on the last day of a month count in the month they began.
- Report density grows with population and with phone reporting, so comparing seasons decades apart in raw counts mixes climate with reporting.
Internal links
- How to read the Storm Events database — local times and time zones
- How to map tornado tracks — where the tornadoes went
- How to map hail reports by county — hail sizes and places
FAQ
What time of day do tornadoes happen most?
Late afternoon local time. In 2025 tornado reports peaked at 16:00 local, and 21.7% began between 22:00 and 06:00.
Which month has the most tornadoes?
It varies by year. In 2025 the peak was April (370 segments, with March close behind). In 2024 it was May (655).