
How to Read Superfund Hazard Ranking System Scores
On this page
Problem statement
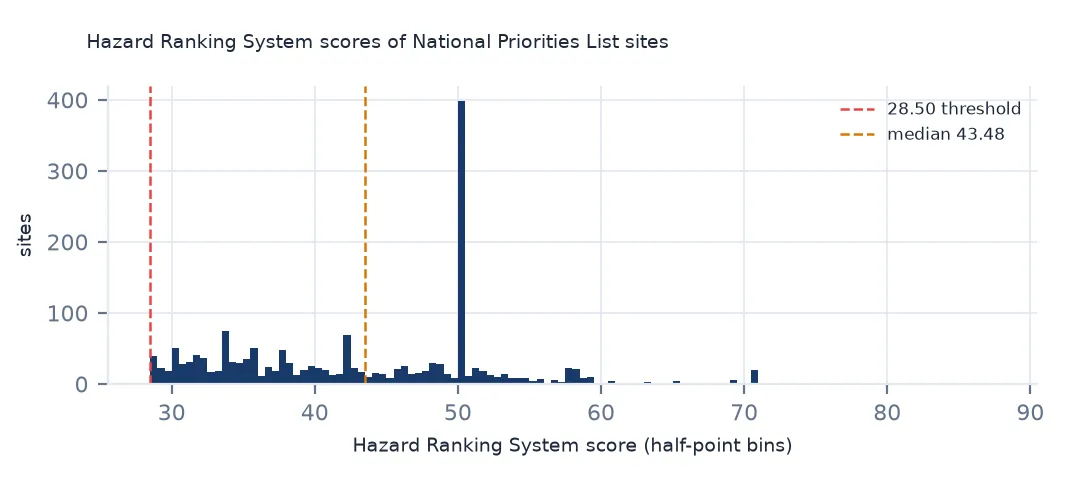
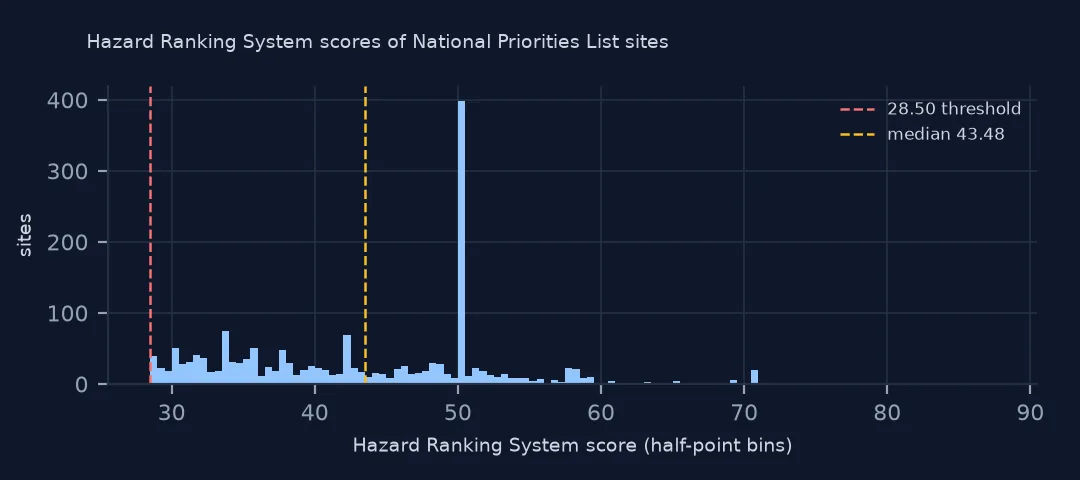
Every site on the National Priorities List got there through a number: its Hazard Ranking System (HRS) score, from 0 to 100, which rates how far contamination could travel through groundwater, surface water, soil and air and how many people and ecosystems it could reach. A site scoring 28.50 or more qualifies. The score decides eligibility, not priority, and it is easy to over-read. This page shows how the scores are distributed, how they bunch above the threshold, how they differ between listed and deleted sites, and whether a high score means a faster cleanup.
Quick answer
Summarise the scores and check them against the 28.50 threshold:
print(npl.Site_Score.describe(percentiles=[0.1, 0.5, 0.9]).round(2).to_string())
print(f"scores below 28.50: {(npl.Site_Score < 28.5).sum()}; missing: {npl.Site_Score.isna().sum()}")
count 1777.00
mean 43.62
std 9.60
min 28.51
10% 31.29
50% 43.48
90% 53.56
max 86.60
scores below 28.50: 0; missing: 63
1,777 sites have a score, from 28.51 to 86.60, with a median of 43.48; a tenth score below 31.29 and a tenth above 53.56. No score is below 28.50, as it should be, and 63 sites have none. The scores are not a ranking of danger: a site scores what its worst pathway scores, and two sites with the same score can be very different problems.
The threshold, status and cleanup speed
1. The threshold
s = npl.Site_Score.dropna()
print(f"within one point of 28.50: {s.between(28.5, 29.5).sum()}; share of sites under 30: {(s < 30).mean():.1%}")
print(np.histogram(s, bins=[28.5, 30, 35, 40, 45, 50, 60, 70, 90])[0].tolist())
fifty = npl[npl.Site_Score == 50]
print(f"exactly 50.00: {len(fifty)}; listed from {fifty.Listing_Date.dt.year.min():.0f}, median year {fifty.Listing_Date.dt.year.median():.0f}; sqrt(100**2 / 4) = {np.sqrt(100**2 / 4):.2f}")
within one point of 28.50: 62; share of sites under 30: 4.6%
[81, 357, 274, 216, 182, 599, 38, 30]
exactly 50.00: 376; listed from 1992, median year 2004; sqrt(100**2 / 4) = 50.00
62 sites score within one point of the threshold, between 28.50 and 29.50, and 4.6% of all scores are under 30. Binned, 81 scores fall between 28.5 and 30, then 357 between 30 and 35, and the counts decline from there except for 599 between 50 and 60. The bunching just above 28.50 reflects how the score is used: a site is scored until it qualifies, and there is little reason to refine it further. The tallest spike is elsewhere: 376 sites score exactly 50.00, all listed from 1992 on. Since the Hazard Ranking System was revised, a site's score is the square root of the mean of its four squared pathway scores, groundwater, surface water, soil and air, each capped at 100. A site whose one scored pathway reaches the cap therefore scores the square root of 100² over 4, exactly 50.00: those sites are not moderately hazardous, they maxed out the one pathway EPA scored.
2. Scores by status
print(npl.groupby("Status").Site_Score.describe()[["count", "50%", "mean"]].round(2).to_string()) count 50% mean
Status
Deleted NPL Site 439.0 38.06 40.36
NPL Site 1301.0 46.44 44.43
Proposed NPL Site 37.0 50.00 53.67
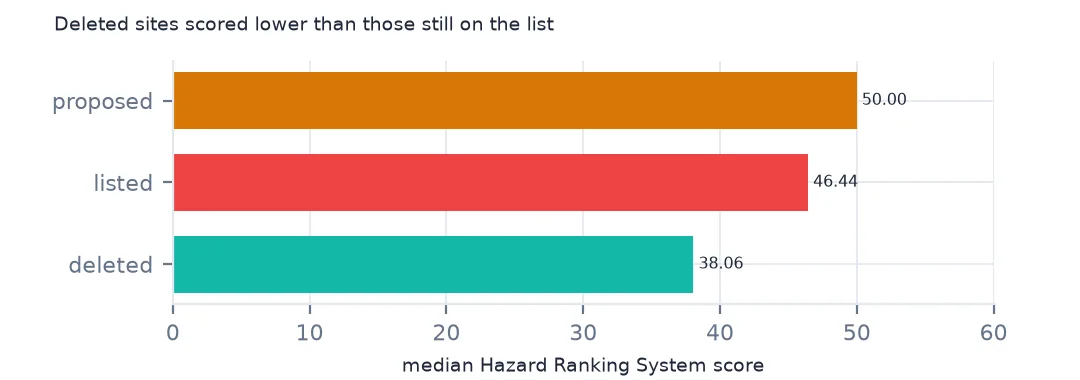
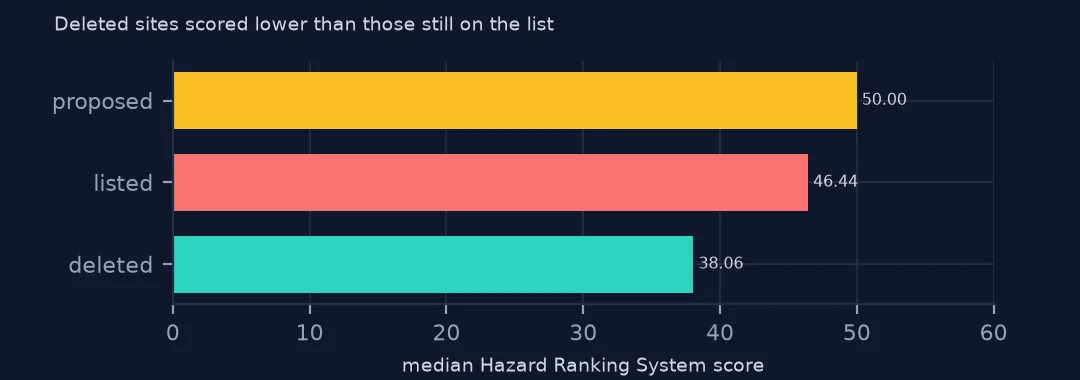
Deleted sites have a median score of 38.06, listed sites 46.44 and proposed sites 50.00. Lower-scoring sites have been easier to finish and delete, and the sites awaiting a decision score highest of all. The mean for proposed sites, 53.67, comes from only 37.
3. Does a higher score mean a faster cleanup?
from scipy.stats import spearmanr
l = npl[npl.Listing_Date.notna() & npl.Site_Score.notna()].copy()
l["years"] = (l.Construction_Completion_Date - l.Listing_Date).dt.days / 365.25
f = l.dropna(subset=["years"])
r = spearmanr(f.Site_Score, f.years)
print(f"finished sites: {len(f)}; rank correlation of score with years to completion: {r.statistic:.2f}")
finished sites: 1201; rank correlation of score with years to completion: 0.07
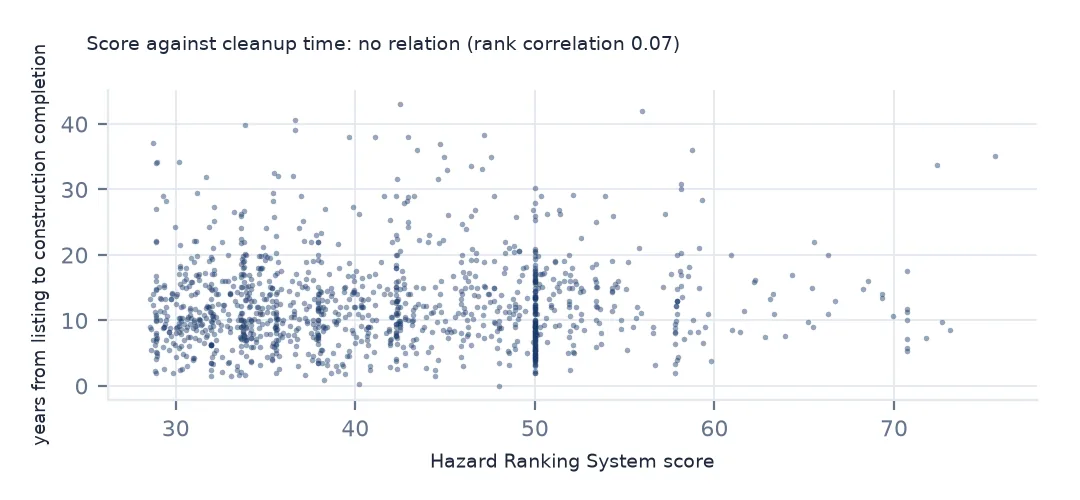
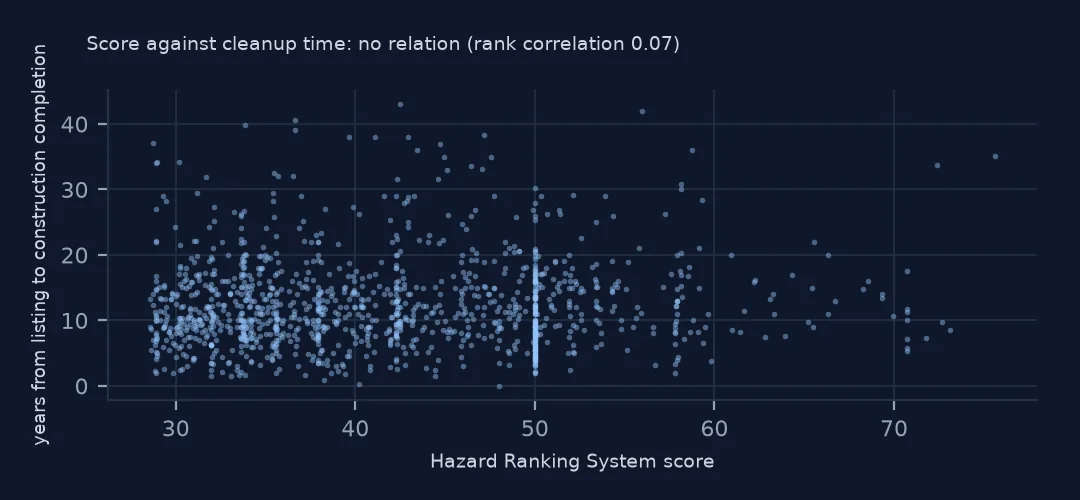
Among the 1,201 finished sites with a score, the rank correlation between score and years to construction completion is 0.07, close to none. A high score does not predict a long cleanup, or a fast one: the score measures potential exposure, while the time depends on the size of the site, the contaminants and the money.
The highest scores
The data used on this page
The US Environmental Protection Agency's Superfund National Priorities List (NPL) Sites with Status Information and its national Superfund site boundaries, every record of both ArcGIS layers, downloaded on 28 October 2026 and saved on this site, because EPA edits both as sites are proposed, listed, completed and deleted. Public domain. The contact names, telephone numbers and e-mail addresses of EPA staff in the boundary layer were left out of the copy.
from pathlib import Path
import zipfile

import geopandas as gpd
import numpy as np
import pandas as pd
import requests

Path("data").mkdir(exist_ok=True)
# EPA's Superfund National Priorities List with status information and EPA's Superfund site boundaries, with the
# Census Bureau's 2020 tract centres of population, 2024 county estimates, counties and states. Saved 28 October 2026:
# EPA updates both layers as sites are proposed, listed, completed and deleted.
# Live: https://services.arcgis.com/cJ9YHowT8TU7DUyn/arcgis/rest/services/Superfund_National_Priorities_List_(NPL)_Sites_with_Status_Information/FeatureServer/0
ARCHIVE = "epa-superfund-npl-2026-10-28.zip"
if not Path(f"data/{ARCHIVE}").exists():
    Path(f"data/{ARCHIVE}").write_bytes(requests.get(f"https://data.spatialworkflow.io/{ARCHIVE}", timeout=600).content)
Z = zipfile.ZipFile(f"data/{ARCHIVE}")
for f in ["npl-sites-status.geojson", "npl-site-boundaries.geojson", "cb_2024_us_county_20m.zip", "cb_2024_us_state_20m.zip"]:
    if not Path(f"data/{f}").exists():
        Path(f"data/{f}").write_bytes(Z.read(f))
npl = gpd.read_file("data/npl-sites-status.geojson")
npl = gpd.GeoDataFrame(npl.drop(columns="geometry"), geometry=gpd.points_from_xy(npl.Longitude, npl.Latitude), crs=4326)
DATES = ["Proposed_Date", "Listing_Date", "Construction_Completion_Date", "NOID_Date", "Deletion_Date"]
npl[DATES] = npl[DATES].apply(pd.to_datetime, format="%m/%d/%Y")        # stored as MM/DD/YYYY text
print(f"Superfund National Priorities List: {len(npl):,} sites, {npl.Status.value_counts().to_dict()}")
Superfund National Priorities List: 1,840 sites, {'NPL Site': 1337, 'Deleted NPL Site': 466, 'Proposed NPL Site': 37}
Example 1: the highest scores
print(npl.nlargest(6, "Site_Score")[["Site_Name", "State", "Site_Score", "Status"]].to_string(index=False)) Site_Name State Site_Score Status
Murray Smelter Utah 86.60 Proposed NPL Site
Big River Mine Tailings/St. Joe Minerals Corp. Missouri 84.91 NPL Site
Washington County Lead District - Old Mines Missouri 76.81 NPL Site
Washington County Lead District - Richwoods Missouri 76.81 NPL Site
Lipari Landfill New Jersey 75.60 Deleted NPL Site
McCormick & Baxter Creosoting Co. California 74.86 NPL Site
The highest scores are smelters and mines. Murray Smelter in Utah, proposed and still not listed, scores 86.60; Big River Mine Tailings in Missouri 84.91; two parts of the Washington County lead district, also in Missouri, 76.81 each. Lipari Landfill in New Jersey, deleted, scored 75.60, the highest of any site cleaned up and taken off the list.
Internal links
- The National Priorities List explained — how a site joins the list
- How long cleanup takes — the durations used here
- Hazard and risk explained — why a score of what could happen is not a measure of what will
- Reading the list — the score column