
How to Map Superfund Site Boundaries and Measure Their Areas
On this page
Problem statement
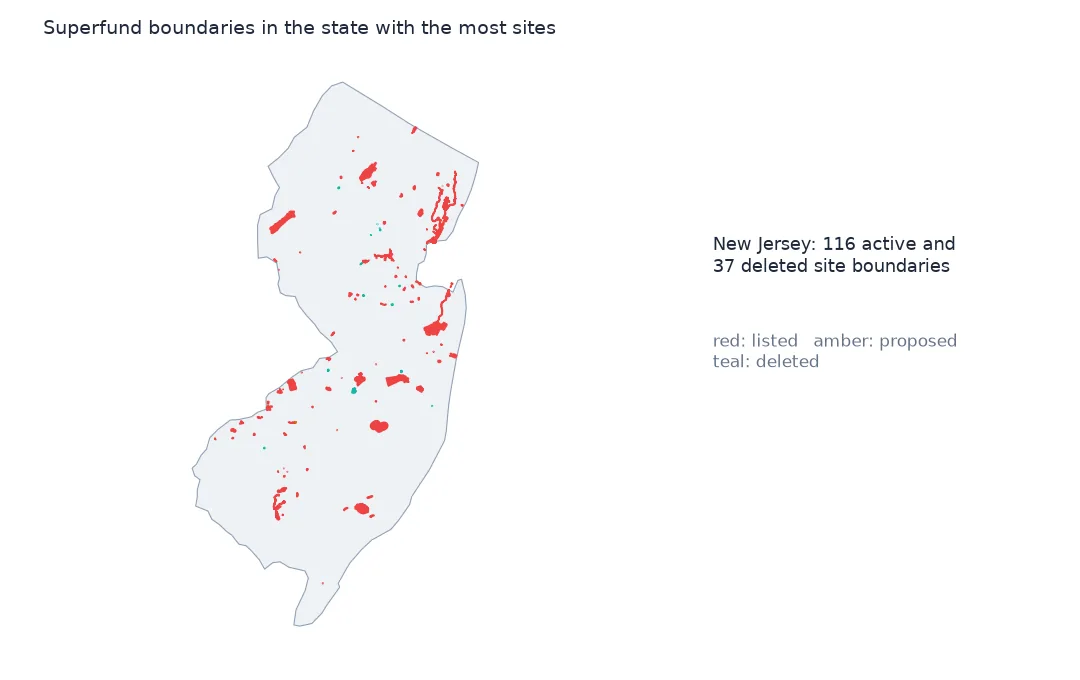
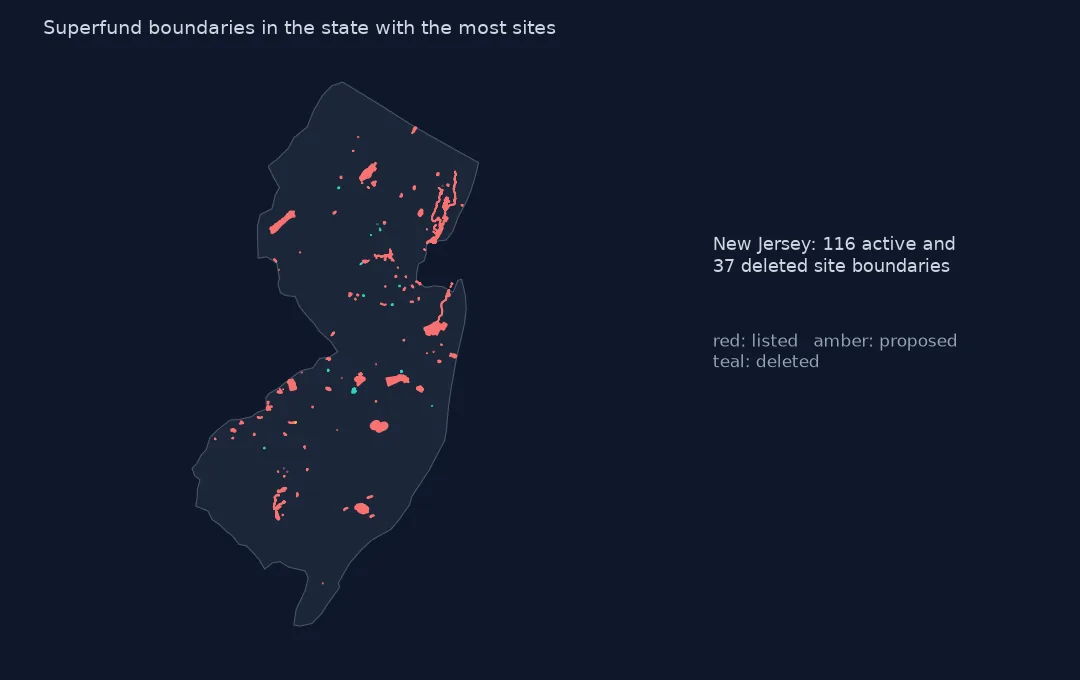
A Superfund site on a map is usually a dot, but EPA also publishes the boundary of almost every site: 2,114 polygons for 1,908 sites, from a single contaminated lot in a city to whole river systems and military reservations. The boundary is what the site's cleanup decisions cover, and its area says more about a site than any count. This page reads the boundaries, measures their areas in equal-area projections, finds the largest sites, and shows how features, sites and status codes relate.
Quick answer
Read the boundaries and compute each feature's area, using the Alaska Albers projection for Alaska and US Albers elsewhere:
bnd = gpd.read_file("data/npl-site-boundaries.geojson")
print(f"features: {len(bnd):,}; sites (EPA_ID): {bnd.EPA_ID.nunique():,}; {bnd.geom_type.value_counts().to_dict()}")
alaska = bnd.STATE_CODE == "AK"
area = pd.concat([bnd[~alaska].to_crs(5070).area, bnd[alaska].to_crs(3338).area])
bnd["km2"] = area / 1e6
print(bnd.km2.describe(percentiles=[0.5, 0.9, 0.99]).round(2).to_string())
features: 2,114; sites (EPA_ID): 1,908; {'Polygon': 1780, 'MultiPolygon': 334}
count 2114.00
mean 22.01
std 191.89
min 0.00
50% 0.20
90% 10.55
99% 408.34
max 4571.14
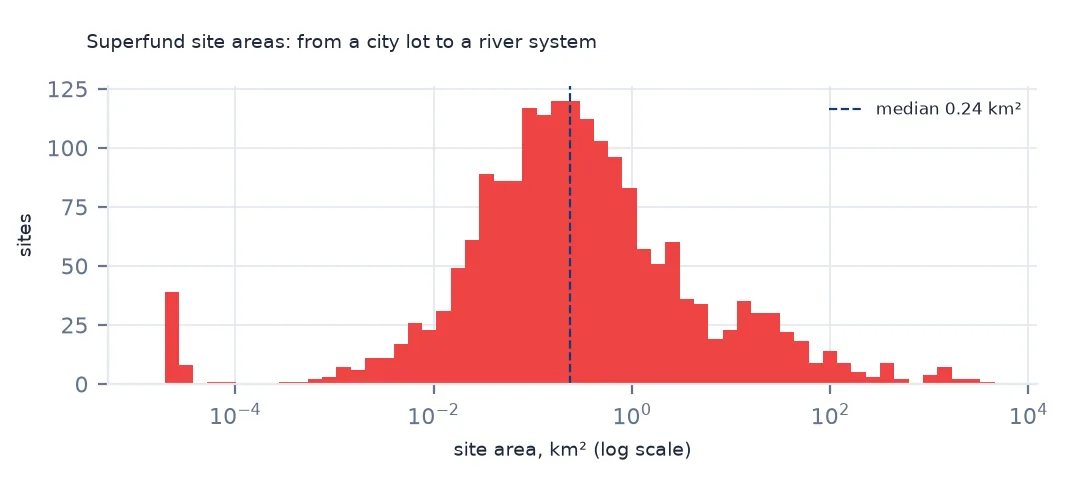
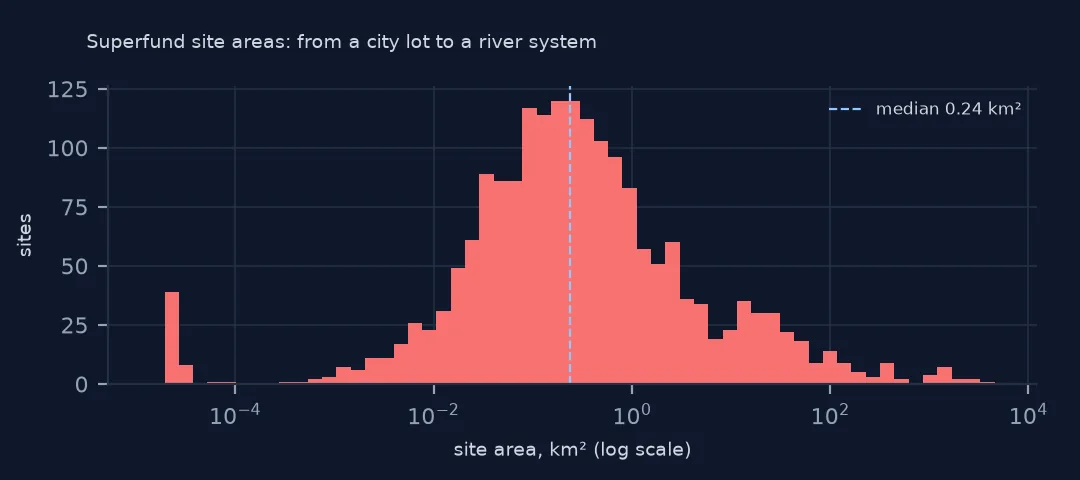
The layer has 2,114 features for 1,908 sites, 1,780 polygons and 334 multipolygons. Areas are wildly uneven: the median feature covers 0.20 km², a tenth cover more than 10.55 km² and the largest 4,571 km². The mean of 22 km² is set by a few giants.
Largest sites, features and status
1. The largest sites
site = bnd.groupby(["EPA_ID", "SITE_NAME", "STATE_CODE"]).km2.sum().sort_values(ascending=False)
print(site.head(6).round(0).to_string())
print(f"largest 10 sites' share of all boundary area: {site.head(10).sum() / site.sum():.1%}")
EPA_ID SITE_NAME STATE_CODE
WI0001954841 FOX RIVER NRDA/PCB RELEASES WI 4571.0
AK6210022426 FORT WAINWRIGHT AK 3722.0
MID980994354 TITTABAWASSEE RIVER, SAGINAW RIVER & BAY MI 2942.0
NDD980716963 ARSENIC TRIOXIDE SITE ND 2416.0
ID4890008952 IDAHO NATIONAL ENGINEERING LABORATORY (USDOE) ID 2290.0
MON000705443 SOUTHWEST JEFFERSON COUNTY MINING MO 1712.0
largest 10 sites' share of all boundary area: 51.6%
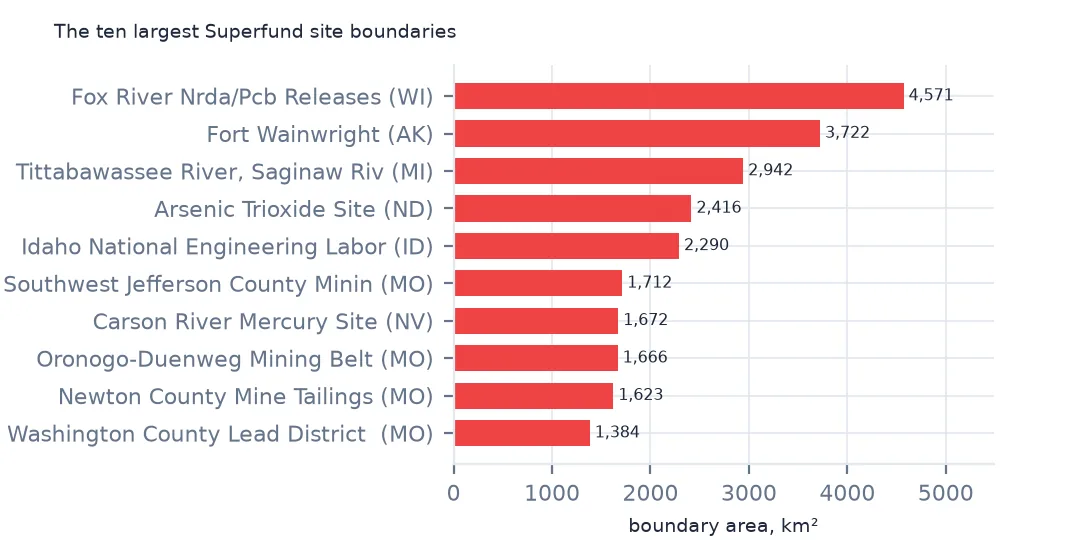
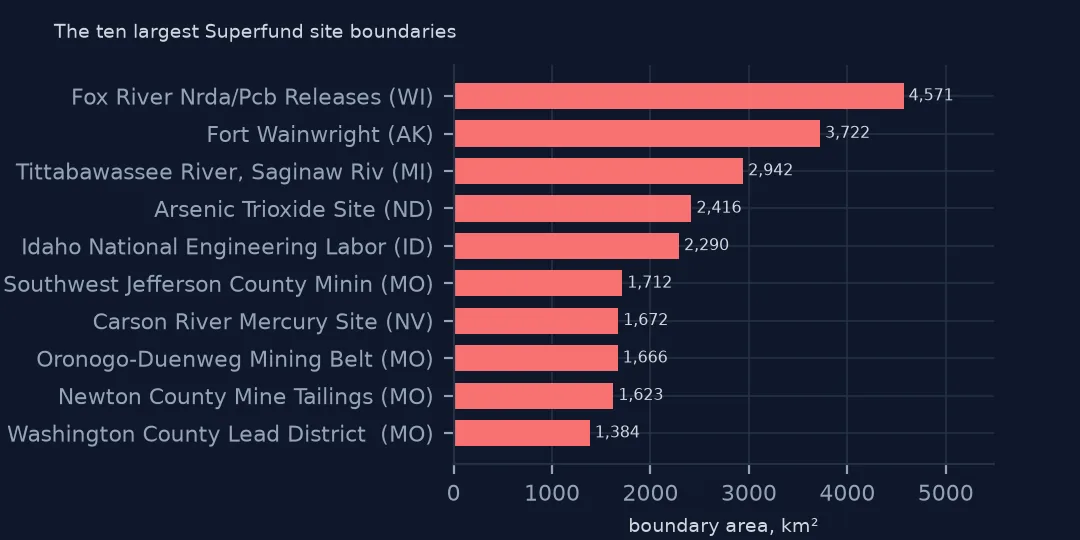
The largest boundary is the Fox River PCB releases in Wisconsin, 4,571 km², which covers the river, its sediments and the bay of Green Bay. Fort Wainwright in Alaska follows with 3,722 km², then the Tittabawassee and Saginaw rivers and bay in Michigan, an arsenic trioxide site in North Dakota that is a groundwater area across several counties, and the Idaho National Engineering Laboratory. The ten largest sites hold 51.6% of all boundary area. River and groundwater sites are drawn as the whole affected water body.
2. Features per site
n = bnd.groupby("EPA_ID").size()
print(n.value_counts().sort_index().head(5).to_dict(), "most:", n.max(), bnd[bnd.EPA_ID == n.idxmax()].SITE_NAME.iloc[0])
print(bnd.SITE_FEATURE_TYPE.value_counts().head(5).to_dict())
{1: 1881, 2: 14, 3: 4, 4: 2, 5: 1} most: 100 PORTLAND HARBOR
{'Comprehensive Site Area': 886, 'Current Ground Boundary': 554, 'Total Site Polygon/OU Aggregation': 187, 'Site Boundary': 172, 'Extent of Contamination': 155}
1,881 sites have a single feature, 14 have two and a few more, and Portland Harbor in Oregon has 100. The feature types say what a polygon means: 886 are a "comprehensive site area", 554 the "current ground boundary", 187 an aggregation of operable units and 155 the extent of contamination. They are not all drawn the same way, so areas compare sites only roughly.
3. By status code
print(bnd.groupby("NPL_STATUS_CODE").agg(features=("EPA_ID", "size"), sites=("EPA_ID", "nunique"), km2=("km2", "sum")).round(0).to_string()) features sites km2
NPL_STATUS_CODE
A 4 3 2.0
D 468 465 2758.0
F 1524 1322 35143.0
N 70 70 3575.0
P 36 36 4856.0
R 10 10 184.0
S 2 2 1.0
The status codes match the list: 1,524 features of finally listed sites (F), 468 deleted (D), 36 proposed (P). 70 features coded N are not on the list at all, 10 coded R have been removed, and a handful A and S, so filter on F and P for active sites. Final sites cover 35,143 km² between them.
Small sites in cities
The data used on this page
The US Environmental Protection Agency's Superfund National Priorities List (NPL) Sites with Status Information and its national Superfund site boundaries, every record of both ArcGIS layers, downloaded on 28 October 2026 and saved on this site, because EPA edits both as sites are proposed, listed, completed and deleted. Public domain. The contact names, telephone numbers and e-mail addresses of EPA staff in the boundary layer were left out of the copy.
from pathlib import Path
import zipfile

import geopandas as gpd
import numpy as np
import pandas as pd
import requests

Path("data").mkdir(exist_ok=True)
# EPA's Superfund National Priorities List with status information and EPA's Superfund site boundaries, with the
# Census Bureau's 2020 tract centres of population, 2024 county estimates, counties and states. Saved 28 October 2026:
# EPA updates both layers as sites are proposed, listed, completed and deleted.
# Live: https://services.arcgis.com/cJ9YHowT8TU7DUyn/arcgis/rest/services/Superfund_National_Priorities_List_(NPL)_Sites_with_Status_Information/FeatureServer/0
ARCHIVE = "epa-superfund-npl-2026-10-28.zip"
if not Path(f"data/{ARCHIVE}").exists():
    Path(f"data/{ARCHIVE}").write_bytes(requests.get(f"https://data.spatialworkflow.io/{ARCHIVE}", timeout=600).content)
Z = zipfile.ZipFile(f"data/{ARCHIVE}")
for f in ["npl-sites-status.geojson", "npl-site-boundaries.geojson", "cb_2024_us_county_20m.zip", "cb_2024_us_state_20m.zip"]:
    if not Path(f"data/{f}").exists():
        Path(f"data/{f}").write_bytes(Z.read(f))
npl = gpd.read_file("data/npl-sites-status.geojson")
npl = gpd.GeoDataFrame(npl.drop(columns="geometry"), geometry=gpd.points_from_xy(npl.Longitude, npl.Latitude), crs=4326)
DATES = ["Proposed_Date", "Listing_Date", "Construction_Completion_Date", "NOID_Date", "Deletion_Date"]
npl[DATES] = npl[DATES].apply(pd.to_datetime, format="%m/%d/%Y")        # stored as MM/DD/YYYY text
print(f"Superfund National Priorities List: {len(npl):,} sites, {npl.Status.value_counts().to_dict()}")
Superfund National Priorities List: 1,840 sites, {'NPL Site': 1337, 'Deleted NPL Site': 466, 'Proposed NPL Site': 37}
Example 1: small sites in cities
small = site[site < 0.1]
print(f"sites under 0.1 km²: {len(small)} ({len(small) / len(site):.1%}); median site: {site.median():.2f} km²")
sites under 0.1 km²: 649 (34.0%); median site: 0.24 km²
649 sites, 34.0%, cover less than 0.1 km², and the median site covers 0.24 km². Many of them are former plating shops, dry cleaners, drum yards and small landfills in towns and cities. The giants dominate the total area; the small sites dominate the count.
Internal links
- Site areas in mixed units — the area column the layer already has
- Joining the list to the boundaries — matching boundaries to the status list
- People near Superfund sites — distances measured to these boundaries
- Federal facilities — the largest boundaries