
How to Map Earthquakes Against Plate Boundaries in Python
On this page
Problem statement
Most earthquakes happen at the edges of tectonic plates, and how much "most" means, which kinds of boundary produce the most and largest earthquakes, and where the exceptions are, are questions a catalogue and a plate boundary model can answer together. The work is a nearest-feature distance on a global scale, where no single map projection preserves distance, and a join of each earthquake to the type of boundary it is nearest to: subduction zone, ocean ridge, transform fault or continental collision.
This page joins 25 years of magnitude 5.5 and larger earthquakes from the USGS catalogue to Peter Bird's PB2002 plate boundary model, measures each event's great-circle distance to the nearest boundary with a three-dimensional k-d tree, and compares boundary types by the number and size of their earthquakes and by how fast the plates on either side move.
Quick answer
Densify the boundaries into points, convert everything to unit vectors on the sphere, and query a k-d tree; the chord distance converts exactly to a great-circle distance:
chord, idx = tree.query(xyz(ev.longitude, ev.latitude))
ev["dist_km"] = 2 * np.arcsin(chord / 2) * 6371.0
ev["cls"] = B.cls.values[idx]
for d in (50, 100, 200, 500):
    print(f"within {d:>3} km of a plate boundary: {(ev.dist_km <= d).mean():.1%}")
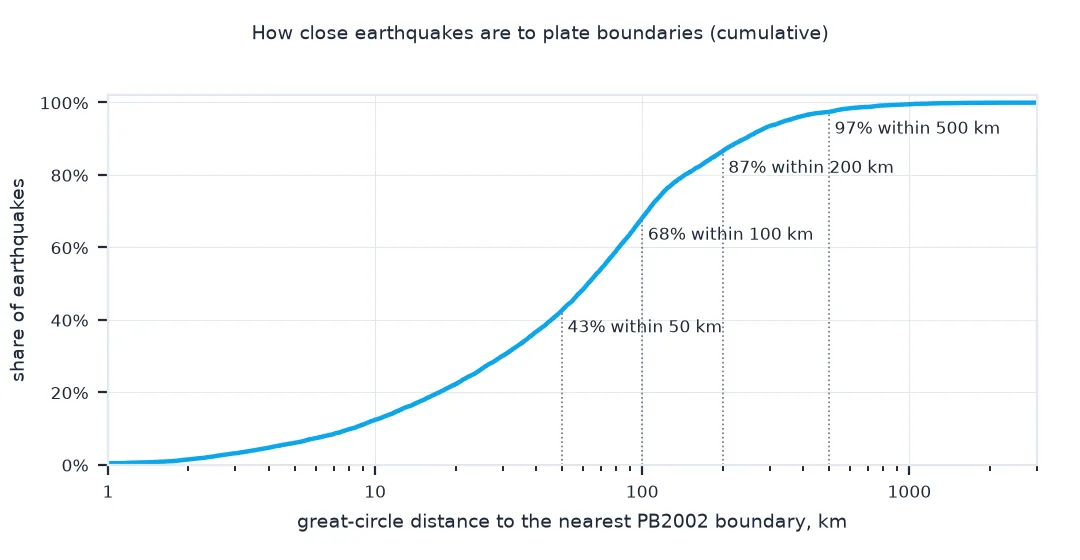
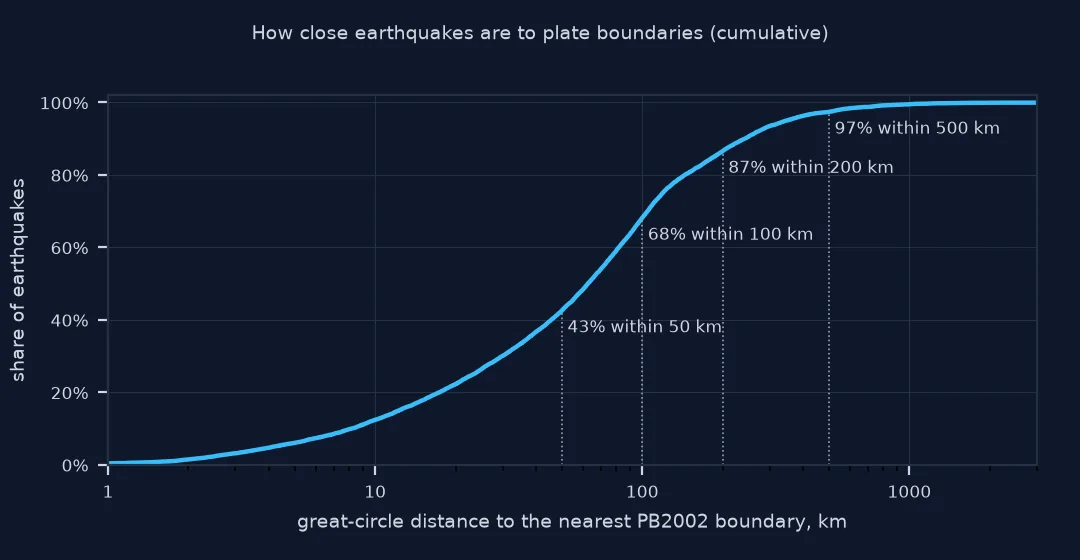
within 50 km of a plate boundary: 42.6%
within 100 km of a plate boundary: 68.1%
within 200 km of a plate boundary: 86.6%
within 500 km of a plate boundary: 97.4%
42.6% of the earthquakes are within 50 km of a boundary, 68.1% within 100 km, 86.6% within 200 km and 97.4% within 500 km. Even the remaining 2.6% are not all intraplate, as the example below shows.
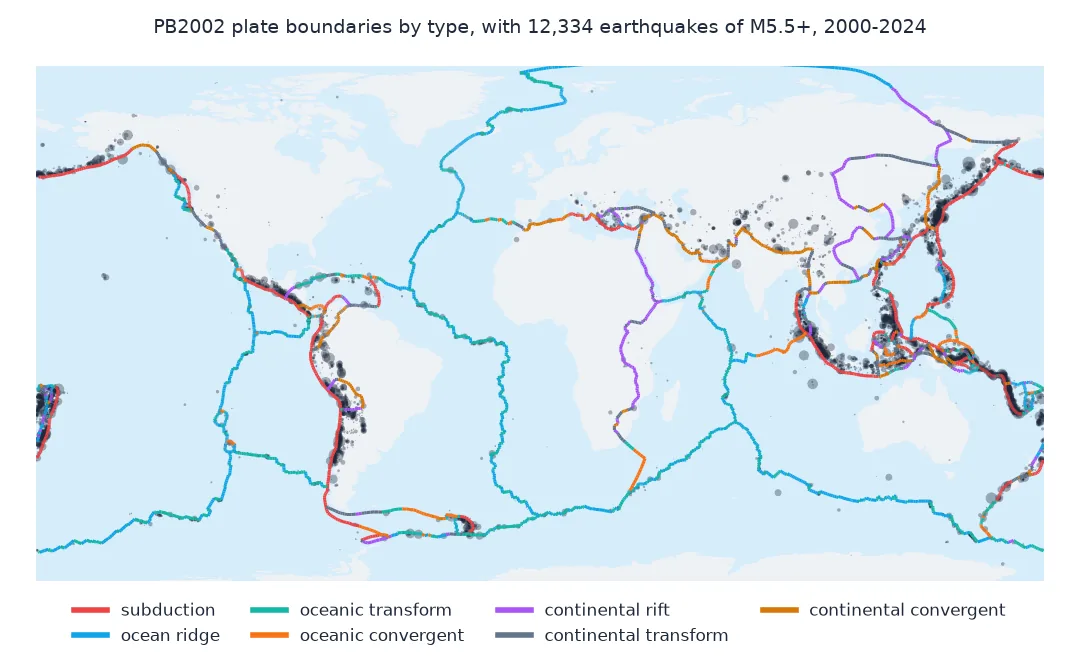
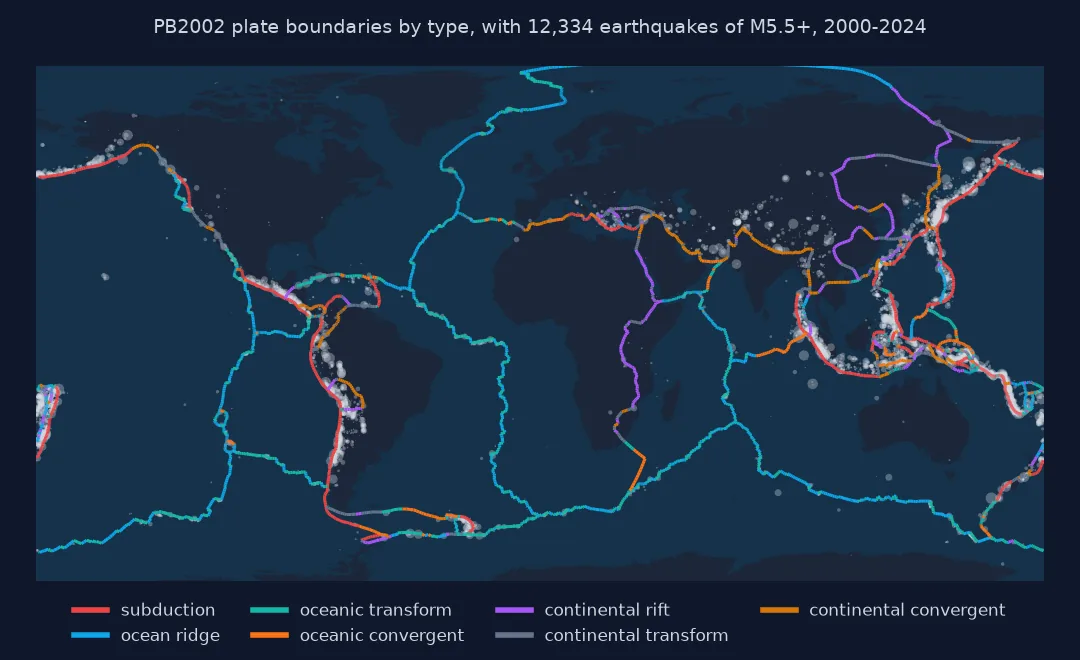
Boundary types, earthquakes per type, plate speed
1. The boundary types
PB2002 divides every boundary into short steps, each classified and carrying the relative velocity of the two plates. Summarise length and velocity by class:
names = {"SUB": "subduction", "OSR": "oceanic spreading ridge", "OTF": "oceanic transform", "OCB": "oceanic convergent",
         "CRB": "continental rift", "CTF": "continental transform", "CCB": "continental convergent"}
S["name"] = S.cls.map(names)
print(S.groupby("name").agg(km=("length", "sum"), steps=("length", "size"), velocity=("vel", "median")).sort_values("km", ascending=False).round(0).to_string())
km steps velocity
name
oceanic spreading ridge 67335.0 1875 29.0
subduction 51470.0 1129 68.0
oceanic transform 47894.0 1147 31.0
continental rift 27470.0 474 13.0
continental transform 26174.0 457 18.0
continental convergent 23003.0 401 16.0
oceanic convergent 17447.0 341 11.0
Ocean ridges are the longest boundary type, 67,335 km, followed by subduction zones, 51,470 km, and oceanic transforms, 47,894 km. Subduction zones also converge fastest: a median relative velocity of 68 mm a year, against 29 mm for ridges and 11 to 18 mm for the continental boundary types.
2. Earthquakes per boundary type
Assign each earthquake within 200 km of a boundary to the class of its nearest step, and compare counts per 1,000 km of boundary and shares of seismic moment:
near = ev[ev.dist_km <= 200].copy()
near["m0"] = 10 ** (1.5 * near.mag + 9.1)
per = near.groupby("cls").agg(events=("mag", "size"), m0=("m0", "sum")).join(S.groupby("cls").length.sum())
per["per_1000km"] = per.events / per.length * 1000
per["moment_share"] = per.m0 / near.m0.sum()
print(per.assign(name=per.index.map(names)).set_index("name")[["events", "per_1000km", "moment_share"]].sort_values("events", ascending=False).round(3).to_string())
top = near.loc[near.groupby("cls").mag.idxmax()]
print("\nlargest event assigned to each class:")
print(top.assign(name=top.cls.map(names), time=top.time.str[:10])[["name", "time", "mag", "place"]].to_string(index=False))
events per_1000km moment_share
name
subduction 5290 102.779 0.613
oceanic transform 1692 35.328 0.024
oceanic spreading ridge 1051 15.608 0.013
continental rift 793 28.867 0.277
continental convergent 722 31.387 0.023
continental transform 699 26.705 0.030
oceanic convergent 433 24.818 0.020
largest event assigned to each class:
name time mag place
continental convergent 2012-10-28 7.8 206 km SW of Prince Rupert, Canada
continental rift 2004-12-26 9.1 2004 Sumatra - Andaman Islands Earthquake
continental transform 2000-11-16 8.0 2000 New Ireland Earthquake
oceanic convergent 2012-04-11 8.2 2012 Wharton Basin Aftershock
oceanic spreading ridge 2016-07-29 7.7 Pagan region, Northern Mariana Islands
oceanic transform 2000-11-16 7.8 135 km SE of Kokopo, Papua New Guinea
subduction 2011-03-11 9.1 2011 Great Tohoku Earthquake, Japan
Subduction zones have 5,290 of the earthquakes within 200 km of a boundary, 103 per 1,000 km over the 25 years, three to seven times the rate of any other type; ridges have the lowest rate, 16 per 1,000 km. Subduction also has 61% of the seismic moment. The 27.7% credited to continental rifts is an artefact, and the next table shows why: the largest event assigned to a rift is the 2004 Sumatra–Andaman M9.1, a subduction megathrust earthquake whose epicentre happens to lie nearer a PB2002 step classed as continental rift than to the Sunda trench. The 2012 Wharton Basin aftershock, an intraplate event in the Indian Ocean, is likewise assigned to a convergent boundary. The nearest boundary is not always the one that moved; a count of events is far less sensitive to such cases than a sum of moment dominated by one earthquake.
3. Faster plates, more earthquakes?
Join each event within 200 km to its nearest step's relative velocity, and compare event rates by velocity class:
near["vel"] = B.vel.values[tree.query(xyz(near.longitude, near.latitude))[1]]
S["vbin"] = pd.cut(S.vel, [0, 20, 40, 60, 80, 200])
near["vbin"] = pd.cut(near.vel, [0, 20, 40, 60, 80, 200])
rate = (near.groupby("vbin", observed=True).size() / S.groupby("vbin", observed=True).length.sum() * 1000).round(1)
print("M5.5+ events per 1,000 km of boundary, 2000-2024, by relative velocity (mm/yr):")
print(rate.to_string())
M5.5+ events per 1,000 km of boundary, 2000-2024, by relative velocity (mm/yr):
vbin
(0, 20] 14.4
(20, 40] 29.6
(40, 60] 41.4
(60, 80] 55.0
(80, 200] 130.2
The faster the plates move relative to each other, the more earthquakes per kilometre of boundary: 14.4 per 1,000 km where they move less than 20 mm a year, rising steadily to 55 at 60–80 mm and 130 above 80 mm a year. Velocity and boundary type overlap, because the fastest boundaries are mostly subduction zones.
The largest earthquakes far from any boundary
The data used on this page
Every earthquake of magnitude 5.5 or more worldwide from 2000 to 2024 from the USGS FDSN event service, and the step file of Peter Bird's PB2002 plate boundary model as GeoJSON from Hugo Ahlenius's tectonicplates repository (Open Data Commons Attribution licence). Each step is densified to points no more than 5 km apart.
from pathlib import Path

import numpy as np
import pandas as pd
import requests
import json
from scipy.spatial import cKDTree

Path("data").mkdir(exist_ok=True)
def cached(path, url, **params):
    p = Path(path)
    if not p.exists():
        r = requests.get(url, params=params, timeout=600)
        r.raise_for_status()
        p.write_bytes(r.content)
    return p
steps = json.loads(cached("data/PB2002_steps.json", "https://raw.githubusercontent.com/fraxen/tectonicplates/master/GeoJSON/PB2002_steps.json").read_text())
S = pd.DataFrame([{"cls": f["properties"]["STEPCLASS"], "length": f["properties"]["STEPLENGTH"], "vel": f["properties"]["VELOCITYLE"],
                   "lon0": f["properties"]["STARTLONG"], "lat0": f["properties"]["STARTLAT"],
                   "lon1": f["properties"]["FINALLONG"], "lat1": f["properties"]["FINALLAT"]} for f in steps["features"]])
def xyz(lon, lat):
    lo, la = np.radians(np.asarray(lon, float)), np.radians(np.asarray(lat, float))
    return np.column_stack([np.cos(la) * np.cos(lo), np.cos(la) * np.sin(lo), np.sin(la)])
pts = []
for i, r in S.iterrows():
    a, b = xyz([r.lon0], [r.lat0])[0], xyz([r.lon1], [r.lat1])[0]
    n = max(2, int(np.ceil(r.length / 5)) + 1)
    seg = np.outer(1 - np.linspace(0, 1, n), a) + np.outer(np.linspace(0, 1, n), b)
    pts.append(np.column_stack([seg / np.linalg.norm(seg, axis=1, keepdims=True), np.full(n, i)]))
P = np.vstack(pts)
B = S.iloc[P[:, 3].astype(int)].reset_index(drop=True)
tree = cKDTree(P[:, :3])
ev = pd.read_csv(cached("data/global_m55_2000_2024.csv", "https://earthquake.usgs.gov/fdsnws/event/1/query", format="csv",
                        starttime="2000-01-01", endtime="2025-01-01", minmagnitude=5.5, orderby="time-asc"))
ev = ev[ev["type"] == "earthquake"].reset_index(drop=True)
print(f"{len(S):,} boundary steps, {S.length.sum():,.0f} km, densified to {len(P):,} points; {len(ev):,} earthquakes M5.5+")
5,824 boundary steps, 260,795 km, densified to 60,805 points; 12,334 earthquakes M5.5+
PB2002's 5,824 steps add up to 260,795 km of plate boundary, densified to 60,805 points. The catalogue has 12,334 earthquakes of M5.5 or more from 2000 to 2024.
Example 1: the largest earthquakes far from any boundary
List the largest earthquakes more than 500 km from the nearest PB2002 boundary:
far = ev[ev.dist_km > 500].nlargest(6, "mag")
print(far[["time", "mag", "depth", "dist_km", "place"]].assign(time=lambda d: d.time.str[:10], dist_km=lambda d: d.dist_km.round(0)).to_string(index=False))
print(f"events more than 500 km from a boundary: {(ev.dist_km > 500).sum()} of {len(ev):,}; of those deeper than 300 km: {(ev[ev.dist_km > 500].depth > 300).sum()}")
time mag depth dist_km place
2013-05-24 8.3 598.10 594.0 2013 Sea of Okhotsk Earthquake
2019-05-26 8.0 122.57 587.0 78 km NE of Navarro, Peru
2000-06-18 7.9 10.00 915.0 South Indian Ocean
2001-11-14 7.8 10.00 979.0 Southern Qinghai, China
2016-03-02 7.8 24.00 548.0 southwest of Sumatra, Indonesia
2008-07-05 7.7 632.80 572.0 Sea of Okhotsk
events more than 500 km from a boundary: 322 of 12,334; of those deeper than 300 km: 59
The six largest earthquakes more than 500 km from a boundary are a mixed group. The 2013 and 2008 Sea of Okhotsk earthquakes, about 600 km deep, and the 2019 Peru earthquake, 123 km deep, are inside subducted slabs that have travelled hundreds of kilometres from the trench where they started down: far from the surface trace of the boundary, but part of it. The 2000 South Indian Ocean and 2016 south-west Sumatra earthquakes are genuinely intraplate, in the deforming Indian Ocean plate, and the 2001 Kunlun earthquake in Qinghai is in the wide Asian collision zone that a single boundary line does not capture. Of all 322 events more than 500 km from a boundary, 59 are deeper than 300 km.
Plates deform at their edges
Plate tectonics explains most of the world's seismicity: the plates are rigid in their interiors and deform at their edges, where they collide, separate or slide past one another, and earthquakes are how most of that deformation happens in the brittle crust. Different boundaries do it differently. Subduction zones, where one plate dives beneath another, produce the largest earthquakes because their faults are wide, shallowly dipping and locked over large areas. Ocean ridges spread apart with many small, shallow earthquakes; oceanic transforms produce moderate strike-slip events; and continental collisions spread deformation over wide zones, which is why a distance to a single line underestimates their reach.
Measuring distance on a global scale needs care. No map projection keeps distances correct everywhere, so the distance is computed on the sphere: points as unit vectors, a k-d tree for the nearest one, and the chord converted to an arc. Densifying the boundaries matters because the distance to the nearest vertex of a long segment can be much larger than the distance to the segment itself; at 5 km spacing the error is at most 2.5 km. And a boundary model is a simplification: PB2002 draws diffuse zones such as the Himalaya and the Basin and Range as lines, with "orogens" marked separately.
Spheres, the antimeridian and aftershocks
- Spherical, not ellipsoidal: a sphere of radius 6,371 km is accurate to about 0.5% for distances; use pyproj's geodesic for higher precision.
- The antimeridian: unit vectors have no seam at ±180°; projected or planar methods do, see the antimeridian fix.
- Aftershocks: large sequences such as Sumatra 2004 and Tohoku 2011 add thousands of events to one boundary type; decluster for rates.
- Magnitude to moment: the moment from catalogue magnitudes, M0 = 10^(1.5M + 9.1), is approximate for magnitude types other than Mw.
Internal links
- How to draw an earthquake depth cross-section in Python — a subduction zone in depth
- How to estimate the probability of an earthquake from a catalogue in Python — the global rate of large events
- Fixing earthquake maps split at the antimeridian — mapping the Pacific
FAQ
What share of earthquakes happen at plate boundaries?
For M5.5+ earthquakes from 2000 to 2024 in the USGS catalogue, 42.6% are within 50 km of a PB2002 boundary, 86.6% within 200 km and 97.4% within 500 km.
Where can I get plate boundary data?
Peter Bird's PB2002 model is available as shapefiles and GeoJSON in the tectonicplates repository on GitHub, under an open attribution licence.
How do I compute distances on a global scale in Python?
Convert longitude and latitude to unit vectors, query a scipy.spatial.cKDTree, and convert the chord length c to an arc with 2·arcsin(c/2)·R.
Which plate boundaries have the biggest earthquakes?
Subduction zones: in this catalogue at least 61% of the moment released within 200 km of a boundary, and more once the 2004 Sumatra earthquake, which a nearest-step join assigns elsewhere, is counted with them.