
How to Chart US Solar Farm Growth by Year and State
On this page
Problem statement
US utility-scale solar grew from a few hundred megawatts in 2010 to more than 130,000 by 2025, and the USPVDB records the year each facility began operating, so the growth can be charted plant by plant. The chart has to be read with care. The year is EIA's operating year, the database adds plants only once they are visible on imagery, and the latest year in any version is incomplete. This page charts facilities and capacity by year, follows the cumulative total, finds the states that led each period, and shows how plant sizes changed.
Quick answer
Count facilities and sum AC capacity by operating year:
yr = pv.groupby("p_year").agg(facilities=("case_id", "size"), mw_ac=("p_cap_ac", "sum"))
print(yr.loc[2010:].round(0).astype(int).to_string())
print(f"before 2010: {yr.loc[:2009].facilities.sum()} facilities, {yr.loc[:2009].mw_ac.sum():,.0f} MW")
facilities mw_ac
p_year
2010 63 246
2011 151 873
2012 210 1324
2013 240 2155
2014 313 3815
2015 366 4250
2016 472 8706
2017 543 5319
2018 501 5096
2019 544 6694
2020 667 12077
2021 710 15680
2022 397 7999
2023 507 16158
2024 647 29647
2025 217 11264
before 2010: 63 facilities, 270 MW
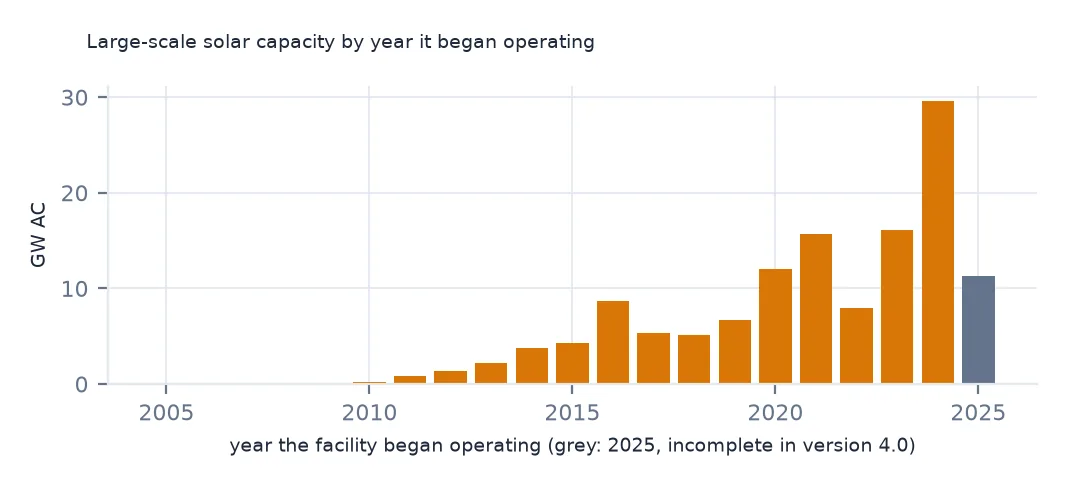
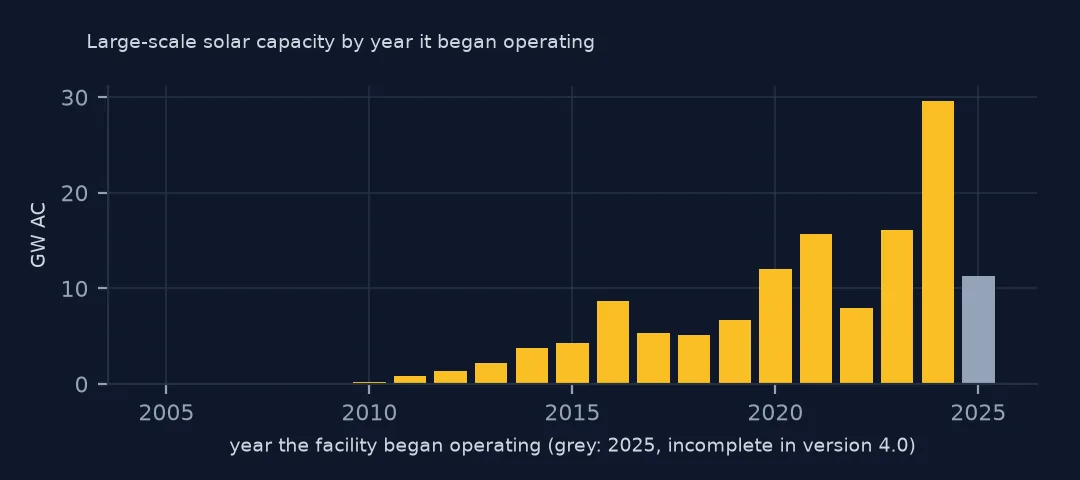
Facilities built in 2010 total 246 MW AC; those built in 2024 total 29,647 MW, the largest year by far. Growth was not smooth: 2016 added 8,706 MW, then 2017 and 2018 only about 5,000 each, and 2022 dropped to 7,999 MW from 15,680 in 2021 before 2023 reached 16,158. Before 2010 the database has only 63 facilities with 270 MW.
Cumulative capacity, leading states and plant sizes
1. Cumulative capacity
cum = yr.mw_ac.cumsum()
for y in [2012, 2016, 2020, 2025]:
    print(y, f"{cum.loc[y]:,.0f} MW AC")
2012 2,713 MW AC
2016 21,639 MW AC
2020 50,826 MW AC
2025 131,574 MW AC
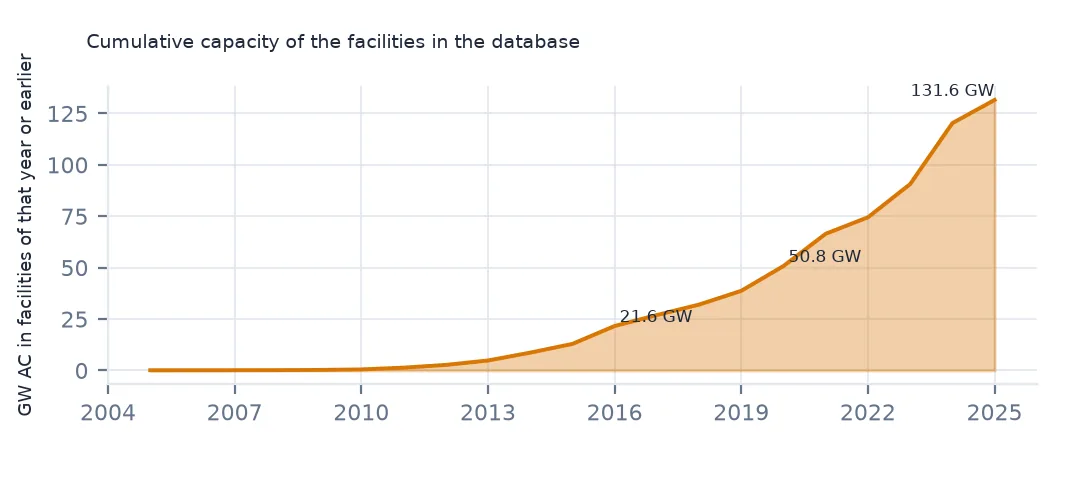
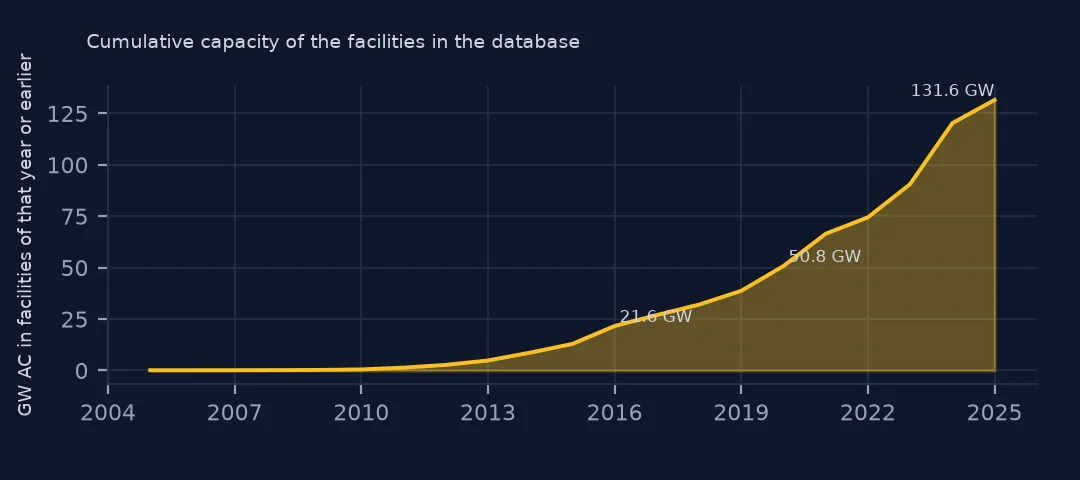
Summed in order, the capacity of facilities in the database was 2,713 MW AC by 2012, 21,639 by 2016, 50,826 by 2020 and 131,574 by 2025, more than doubling between 2020 and 2025. This is a cumulative count of plants still in the database, so it slightly understates what was built in early years and later retired.
2. The states that led each period
for a, b in [(2010, 2015), (2016, 2020), (2021, 2025)]:
    s = pv[pv.p_year.between(a, b)].groupby("p_state").p_cap_ac.sum().sort_values(ascending=False)
    print(f"{a}-{b}: {s.sum():,.0f} MW; top: " + ", ".join(f"{k} {v:,.0f}" for k, v in s.head(4).items()))
2010-2015: 12,664 MW; top: CA 5,586, NC 1,645, AZ 1,450, NV 660
2016-2020: 37,893 MW; top: CA 8,020, TX 5,268, FL 3,833, NC 3,596
2021-2025: 80,748 MW; top: TX 17,451, CA 9,114, FL 7,714, OH 3,976
California led the early years, with 5,586 of the 12,664 MW built from 2010 to 2015, followed by North Carolina and Arizona. From 2016 to 2020 Texas was second, and from 2021 to 2025 it built 17,451 MW, nearly twice California's 9,114, with Florida and Ohio next. The centre of US solar construction has moved from California to Texas.
3. Facility size over time
print(pv[pv.p_year >= 2010].groupby("p_year").p_cap_ac.agg(["median", "mean", "max"]).round(1).to_string()) median mean max
p_year
2010 1.4 3.9 48.0
2011 2.2 5.8 175.0
2012 2.4 6.3 170.0
2013 2.5 9.0 280.0
2014 3.2 12.2 585.9
2015 4.8 11.6 314.4
2016 4.9 18.4 299.5
2017 3.5 9.8 157.5
2018 2.6 10.2 252.3
2019 2.2 12.3 250.0
2020 2.3 18.1 410.0
2021 3.0 22.1 420.0
2022 3.5 20.1 275.0
2023 4.9 31.9 577.0
2024 5.0 45.8 690.0
2025 5.0 51.9 540.0
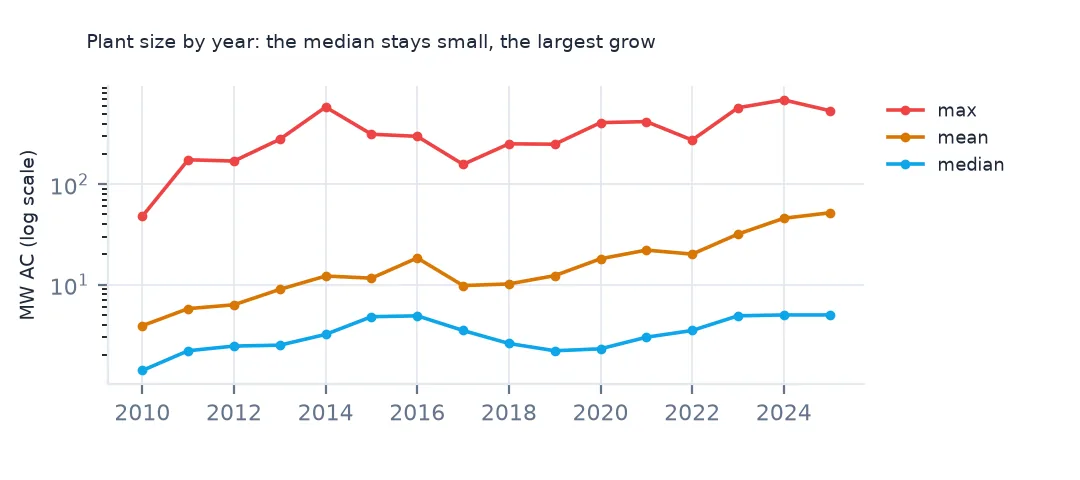
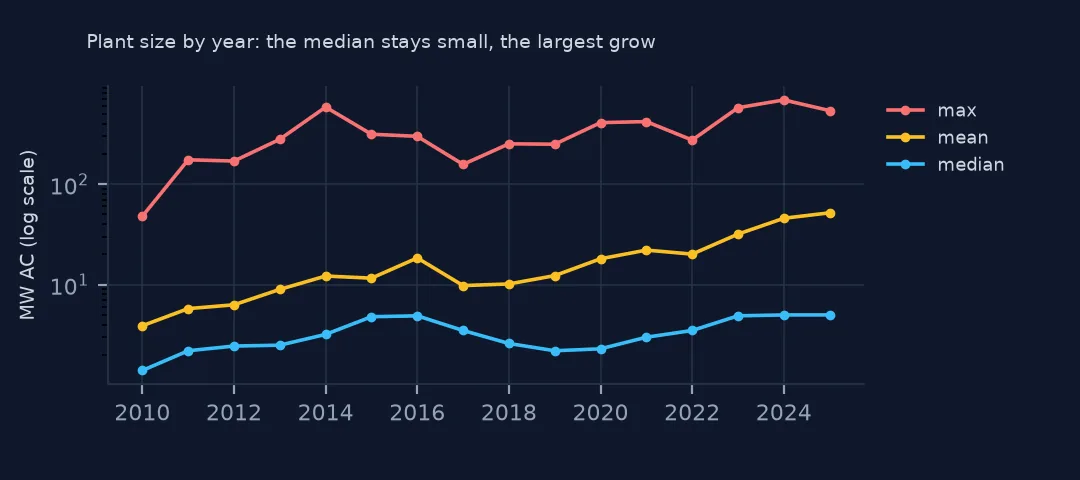
The median facility stays small, 2 to 5 MW in every year, because community solar fields keep being built. The mean and the maximum tell the other half: the mean grew from 3.9 MW in 2010 to 51.9 MW in 2025, and the largest plant of a year from 48 MW to 690 MW in 2024. Year by year, the capacity comes from fewer, much larger plants.
The 2025 cohort and the version's cut-off
The data used on this page
The US Geological Survey and Lawrence Berkeley National Laboratory's US Large-Scale Solar Photovoltaic Database (USPVDB), version 4.0 of 14 April 2026 (Fujita and others, doi:10.5066/P9IA3TUS), public domain, as GeoJSON with the metadata and changelog from the download. USGS replaces the files at the same address with each version, so version 4.0 was saved on this site on 28 October 2026. Capacities are megawatts, areas square metres of panels and inverters.
from pathlib import Path
import zipfile

import geopandas as gpd
import numpy as np
import pandas as pd
import requests

Path("data").mkdir(exist_ok=True)
# USGS/LBNL US Large-Scale Solar Photovoltaic Database (USPVDB) version 4.0 of April 2026 (doi:10.5066/P9IA3TUS),
# array outlines as GeoJSON, with the Census Bureau's 2024 counties and states. Saved 28 October 2026: each new
# version replaces the files at the same address.
# Live: https://energy.usgs.gov/uspvdb/assets/data/uspvdbGeoJSON.zip
ARCHIVE = "usgs-uspvdb-v4-0-2026-10-28.zip"
if not Path(f"data/{ARCHIVE}").exists():
    Path(f"data/{ARCHIVE}").write_bytes(requests.get(f"https://data.spatialworkflow.io/{ARCHIVE}", timeout=600).content)
Z = zipfile.ZipFile(f"data/{ARCHIVE}")
for f in ["uspvdb_v4_0_20260414.geojson", "cb_2024_us_county_20m.zip", "cb_2024_us_state_20m.zip"]:
    if not Path(f"data/{f}").exists():
        Path(f"data/{f}").write_bytes(Z.read(f))
pv = gpd.read_file("data/uspvdb_v4_0_20260414.geojson")
print(f"USPVDB 4.0: {len(pv):,} solar facilities, {pv.p_cap_ac.sum():,.0f} MW AC")
USPVDB 4.0: 6,611 solar facilities, 131,574 MW AC
Example 1: the 2025 cohort and the version's cut-off
y25 = pv[pv.p_year == 2025]
print(f"2025: {len(y25)} facilities, {y25.p_cap_ac.sum():,.0f} MW; imagery dated 2025 or later: {(y25.p_img_date >= 20250101).mean():.0%}")
print(f"latest image: {pv.p_img_date.max()}")
2025: 217 facilities, 11,264 MW; imagery dated 2025 or later: 85%
latest image: 20260208
2025 has 217 facilities with 11,264 MW, about a third of 2024's capacity, and 85% of them were checked on imagery from 2025 or later. The shortfall is mostly timing, not a slowdown: plants that began operating late in 2025 were not yet on the imagery or in EIA's data when version 4.0 closed. The latest image is from 8 February 2026. Leave the final year off a growth chart, or mark it as incomplete.
Internal links
- The database explained — what each version adds
- Trackers and fixed tilt — how the new plants are built
- Solar capacity by county — where the capacity ended up
- Wind turbines by year — the same growth for wind