
How to Read HRRR Wind Data in Python
On this page
Problem statement
The High-Resolution Rapid Refresh (HRRR) is NOAA's 3-kilometre weather model for the contiguous United States, run every hour and published on AWS like the GFS. Its grid spacing is nine times finer than the GFS's, enough to resolve thunderstorms and the inner structure of a hurricane. Its files differ from the GFS's in three ways that matter for wind: the grid is a Lambert conformal projection with two-dimensional latitude and longitude arrays, the wind components are relative to that grid rather than to north, and the surface file carries a wind gust field.
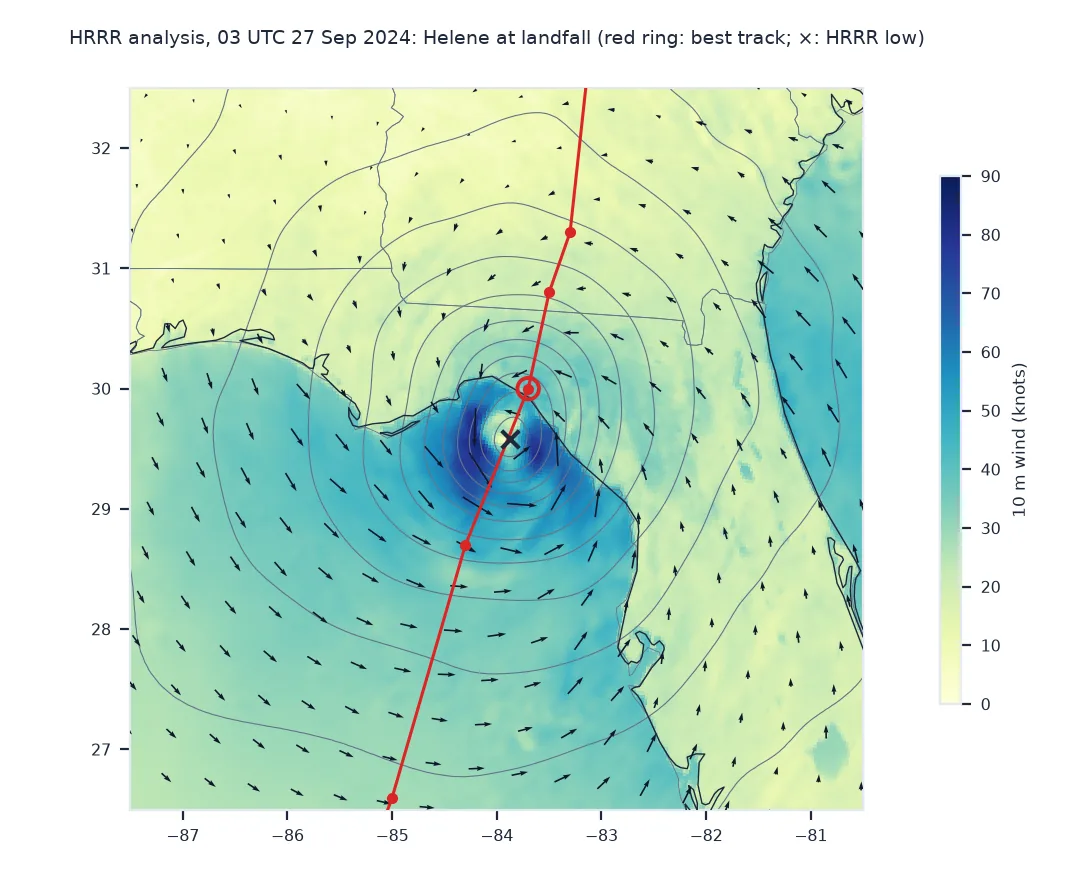
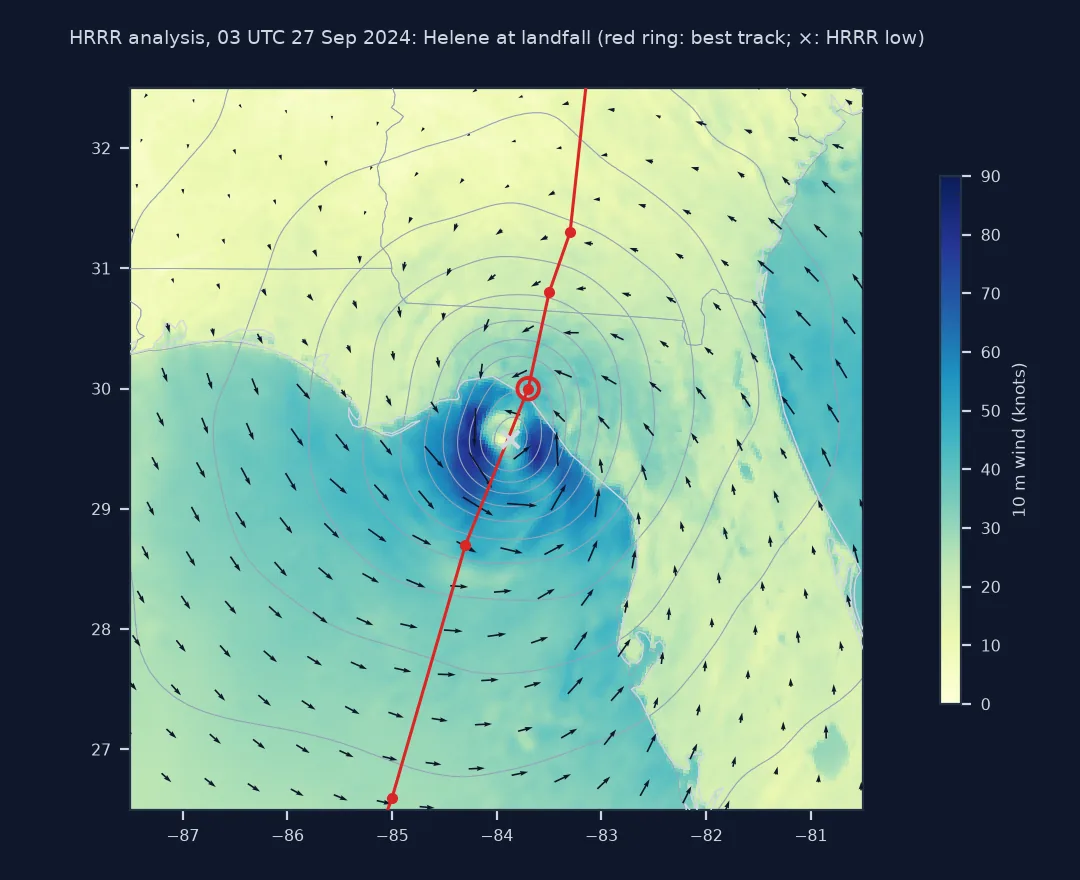
This page reads the HRRR analysis for 03 UTC on 27 September 2024, the hour Hurricane Helene made landfall in Florida's Big Bend, rotates the winds to true north, and compares the storm with the National Hurricane Center's best track.
Quick answer
Fetch the fields by byte range from the index, open them with cfgrib, and check how the winds are oriented:
URL = "https://noaa-hrrr-bdp-pds.s3.amazonaws.com/hrrr.20240927/conus/hrrr.t03z.wrfsfcf00.grib2"
size = grib_subset(URL, ["UGRD:10 m above ground", "VGRD:10 m above ground", "GUST:surface", "MSLMA:mean sea level"],
                   "data/hrrr_helene_03z.grib2")
W = open_group("data/hrrr_helene_03z.grib2", typeOfLevel="heightAboveGround", level=10)
print(f"{size / 1e6:.1f} MB downloaded; grid {W.sizes['y']} × {W.sizes['x']}, {W.u10.attrs['GRIB_DxInMetres'] / 1000:.0f} km spacing, "
      f"{W.u10.attrs['GRIB_gridType']} projection")
print(f"winds relative to the grid, not to north: uvRelativeToGrid = {W.u10.attrs['GRIB_uvRelativeToGrid']}")
6.9 MB downloaded; grid 1059 × 1799, 3 km spacing, lambert projection
winds relative to the grid, not to north: uvRelativeToGrid = 1
Two-dimensional coordinates, rotation to true north, a track check
1. Work with two-dimensional coordinates
On a projected grid, latitude and longitude are arrays the size of the grid, so selecting a region is a mask, not a slice:
lat, lon = W.latitude.values, W.longitude.values - 360
print(f"latitude {lat.min():.1f} to {lat.max():.1f}; longitude {lon.min():.1f} to {lon.max():.1f}")
box = (lat > 24) & (lat < 36) & (lon > -90) & (lon < -76)
print(f"grid points in the box 24–36°N, 90–76°W: {box.sum():,} of {box.size:,}")
latitude 21.1 to 52.6; longitude -134.1 to -60.9
grid points in the box 24–36°N, 90–76°W: 204,610 of 1,905,141
2. Rotate the winds to true north
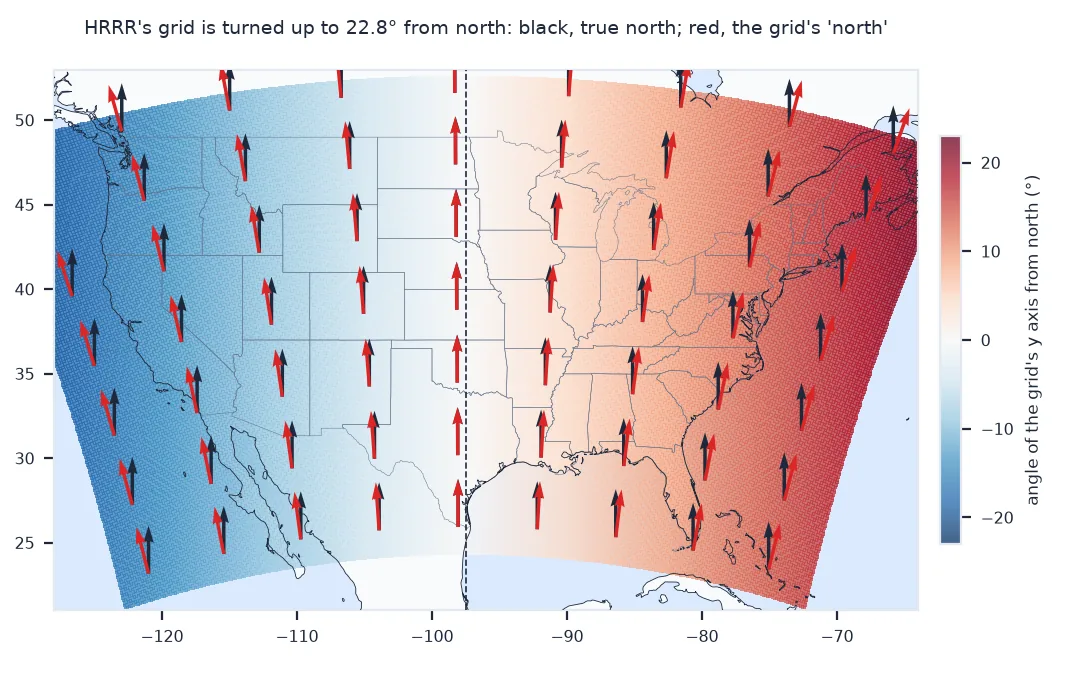
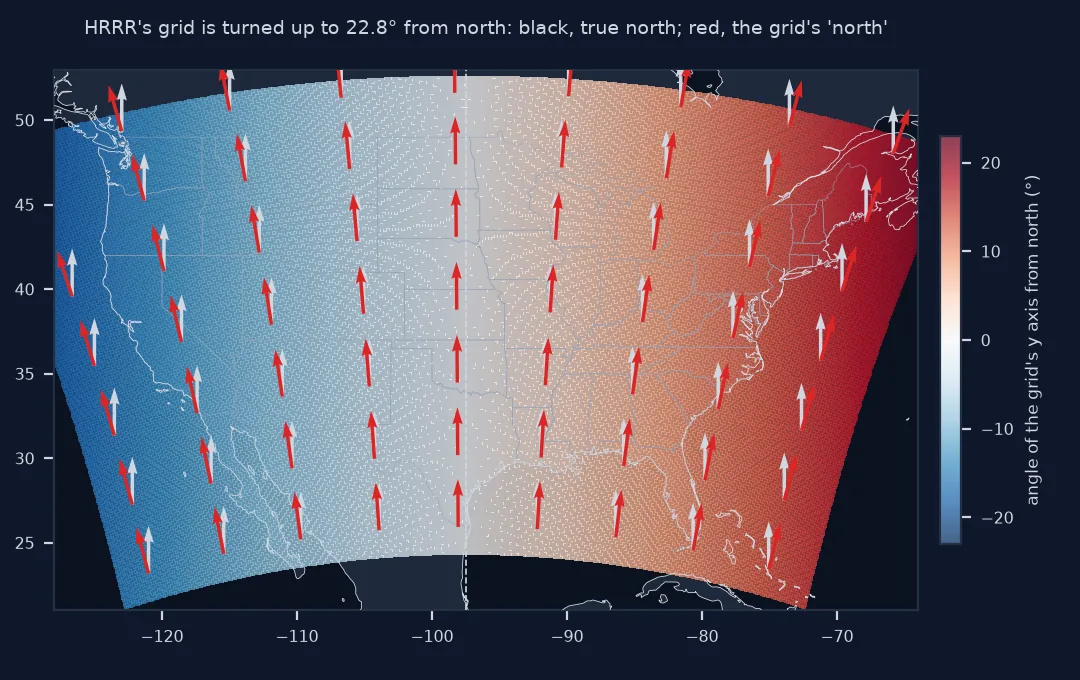
HRRR's u points along the grid's x axis, which is east only along the central meridian, 97.5°W. Elsewhere the grid is turned by the meridian convergence of the Lambert projection, which pyproj computes for each point:
hrrr_crs = pyproj.CRS.from_proj4(f"+proj=lcc +lat_1={W.u10.attrs['GRIB_Latin1InDegrees']} +lat_2={W.u10.attrs['GRIB_Latin2InDegrees']} "
                                 f"+lat_0={W.u10.attrs['GRIB_LaDInDegrees']} +lon_0={W.u10.attrs['GRIB_LoVInDegrees'] - 360} +R=6371229")
alpha = np.radians(pyproj.Proj(hrrr_crs).get_factors(lon, lat).meridian_convergence)
u_e = np.cos(alpha) * W.u10.values + np.sin(alpha) * W.v10.values
v_e = -np.sin(alpha) * W.u10.values + np.cos(alpha) * W.v10.values
print(f"rotation across the grid: {np.degrees(alpha).min():.1f}° to {np.degrees(alpha).max():.1f}°; "
      f"in the Helene box: {np.degrees(alpha[box]).min():.1f}° to {np.degrees(alpha[box]).max():.1f}°")
rotation across the grid: -22.8° to 22.8°; in the Helene box: 4.7° to 13.4°
The rotation changes direction only; the speed is the same before and after.
3. Compare the storm with the best track
speed = np.hypot(u_e, v_e)
gust = open_group("data/hrrr_helene_03z.grib2", shortName="gust").gust.values
mslp = open_group("data/hrrr_helene_03z.grib2", shortName="mslma").mslma.values / 100
i, j, k = (np.argmax(np.where(box, speed, 0)), np.argmax(np.where(box, gust, 0)), np.argmin(np.where(box, mslp, 2000)))
bt = BEST.loc["2024-09-27 03:00"]
off_km = pyproj.Geod(ellps="WGS84").inv(lon.flat[k], lat.flat[k], bt.lon, bt.lat)[2] / 1000
print(f"HRRR lowest pressure {mslp.flat[k]:.1f} hPa at {lat.flat[k]:.2f}°N {abs(lon.flat[k]):.2f}°W; best track {bt.pres:.0f} hPa, {off_km:.0f} km away")
print(f"HRRR strongest 10 m wind {speed.flat[i] * 1.94384:.0f} kt; strongest gust {gust.flat[j] * 1.94384:.0f} kt; best track {bt.vmax:.0f} kt sustained")
HRRR lowest pressure 958.1 hPa at 29.58°N 83.87°W; best track 939 hPa, 49 km away
HRRR strongest 10 m wind 84 kt; strongest gust 122 kt; best track 120 kt sustained
HRRR's strongest sustained wind, 84 knots, is closer to the best track's 120 than the GFS's 77 knots three hours earlier, but still well short; its gust field reaches about the best track's sustained value. The best track is NHC's post-storm analysis of the strongest one-minute wind anywhere in the storm, while a model grid point is a 3 km average, so a gap is expected even from a good model.
What the GRIB header says about the earth
The data used on this page
The NOAA HRRR bucket on AWS (noaa-hrrr-bdp-pds), surface file (wrfsfc) of the 03 UTC analysis on 27 September 2024: 10 m UGRD and VGRD, surface GUST and MSLMA sea-level pressure; and the National Hurricane Center's best track for Hurricane Helene (AL09).
import gzip
from pathlib import Path

import numpy as np
import pandas as pd
import pyproj
import requests
import xarray as xr

Path("data").mkdir(exist_ok=True)

def grib_subset(url, wanted, path):
    """Download the GRIB messages whose .idx line contains one of `wanted`."""
    lines = requests.get(url + ".idx", timeout=60).text.splitlines()
    starts = [int(line.split(":")[1]) for line in lines]
    with open(path, "wb") as f:
        for i, line in enumerate(lines):
            if any(f":{w}:" in line for w in wanted):
                end = starts[i + 1] - 1 if i + 1 < len(lines) else ""
                f.write(requests.get(url, headers={"Range": f"bytes={starts[i]}-{end}"}, timeout=120).content)
    return Path(path).stat().st_size

def open_group(path, **keys):
    return xr.open_dataset(path, engine="cfgrib", decode_timedelta=False,
                           backend_kwargs={"indexpath": "", "filter_by_keys": keys}).load()

F = Path("data/bal092024.dat.gz")
if not F.exists():
    F.write_bytes(requests.get("https://ftp.nhc.noaa.gov/atcf/archive/2024/bal092024.dat.gz", timeout=60).content)
bt = pd.read_csv(gzip.open(F, "rt"), header=None, usecols=[2, 6, 7, 8, 9], names=["time", "lat", "lon", "vmax", "pres"],
                 skipinitialspace=True, dtype=str)
bt["time"] = pd.to_datetime(bt.time, format="%Y%m%d%H")
bt["lat"] = bt.lat.str[:-1].astype(float) / 10
bt["lon"] = -bt.lon.str[:-1].astype(float) / 10
BEST = bt.drop_duplicates("time").set_index("time").astype({"vmax": int, "pres": int})
b3 = BEST.loc["2024-09-27 03:00"]
print(f"best track at 03 UTC: {b3.lat}°N {abs(b3.lon)}°W, {b3.vmax:.0f} kt, {b3.pres:.0f} hPa")
best track at 03 UTC: 30.0°N 83.7°W, 120 kt, 939 hPa
Example 1: what the GRIB header says about the earth
The radius in the projection above is not a guess; HRRR's GRIB messages declare a spherical earth of radius 6,371,229 m:
import eccodes

with open("data/hrrr_helene_03z.grib2", "rb") as f:
    h = eccodes.codes_grib_new_from_file(f)
    print({k: eccodes.codes_get(h, k) for k in ("shapeOfTheEarth", "LoVInDegrees", "Latin1InDegrees", "DxInMetres")})
    eccodes.codes_release(h)
{'shapeOfTheEarth': 6, 'LoVInDegrees': 262.5, 'Latin1InDegrees': 38.5, 'DxInMetres': 3000.0}
Example 2: cutting the grid to a smaller rectangle
A mask keeps the full array; for plotting or saving, cut the x and y ranges that contain the box instead:
ys, xs = np.where(box)
sub = W.isel(y=slice(ys.min(), ys.max() + 1), x=slice(xs.min(), xs.max() + 1))
print(f"sub-grid {sub.sizes['y']} × {sub.sizes['x']} ({sub.u10.size / W.u10.size:.1%} of the full grid)")
sub-grid 512 × 518 (13.9% of the full grid)
Why Lambert grid columns lean
A Lambert conformal projection maps the globe onto a cone tangent at 38.5°N. Grid columns follow the cone's straight lines, which coincide with meridians only on the central meridian; east of it the grid's "up" points east of north, and west of it, west of north. The angle grows with distance from the central meridian, by sin(38.5°) times the longitude difference, about 22° at the corners of the CONUS domain. HRRR stores u and v along the grid axes because that is what the model integrates, and every product made from them has to rotate them before talking about north, east or compass directions.
The extra resolution shows in the storm. At 3 km, HRRR resolves an eyewall that the 27 km GFS smooths away: a deeper low, stronger winds, and gusts as strong as the best track's peak sustained wind. It also places the centre within tens of kilometres of the best track at landfall, a reminder that an analysis is itself an estimate.
Surface files, pressure and gusts
- Surface vs pressure files:
wrfsfchas near-surface fields;wrfprshas pressure levels;wrfnathas model levels. - Sea-level pressure: the surface file carries
MSLMA(MAPS reduction) rather thanPRMSL; values differ slightly. - Archive: HRRR on AWS starts on 30 July 2014; the model has been upgraded since, so a long record mixes model versions.
- Gusts: HRRR's
GUSTis a model diagnostic, not an observed gust. - Longitude: 2D longitudes run from 237° to 299° east; subtract 360 for west-negative.
Internal links
- How to download GFS wind data from AWS — the global model, same byte-range method
- How to calculate wind speed and direction from u and v — after rotation
FAQ
Where can I download HRRR data?
From the public AWS bucket noaa-hrrr-bdp-pds, under hrrr.YYYYMMDD/conus/, with an .idx index next to each GRIB2 file.
Are HRRR winds relative to true north?
No. HRRR's u and v are relative to its Lambert conformal grid; rotate them by the meridian convergence before computing directions.
How do I rotate HRRR winds to earth-relative?
Compute the meridian convergence α with pyproj for each point, then u_e = cos α · u + sin α · v and v_e = −sin α · u + cos α · v.
What resolution is HRRR?
3 km over the contiguous United States, updated every hour.