
How to Calculate Monthly Rainfall Totals in Python
On this page
Problem statement
Monthly rainfall totals, wet days and the heaviest single day are the basic statistics of precipitation. They are also easy to get wrong, because rainfall differs from temperature in ways that break simple code. A missing day is not a dry day, but sum() treats it as one. Trace amounts are recorded as zero with a flag. A month's total depends on every single day being present. And comparing a month with normal needs a percentage, not a difference.
This page computes monthly precipitation totals, wet days and maximum daily falls for Washington Reagan National Airport from the GHCN-Daily record. It handles missing days and trace flags, compares 2024 with the 1991-2020 normal, and finds the wettest and driest months of a record going back to 1937.
Quick answer
Sum each month only if it is complete, and count wet days at a threshold:
P = G.PRCP
m = P.groupby([P.index.year, P.index.month]).agg(total="sum", days="count", wet=lambda s: (s >= 1.0).sum(), max_day="max")
m.index.names = ["year", "month"]
m["dim"] = [pd.Period(f"{y}-{mo:02d}").days_in_month for y, mo in m.index]
m["complete"] = m.days == m.dim
y24 = m.loc[2024]
print(y24[["total", "wet", "max_day"]].round(1).T.to_string())
print(f"2024 total {y24.total.sum():.0f} mm; months complete: {y24.complete.sum()} of 12")
month 1 2 3 4 5 6 7 8 9 10 11 12
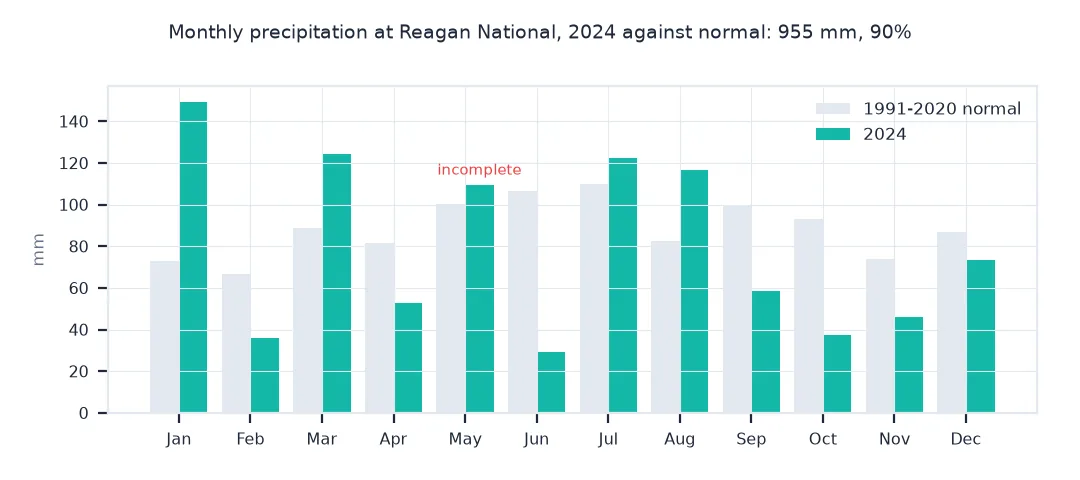
total 149.3 35.9 124.2 52.6 109.4 29.4 122.5 116.4 58.7 37.6 46.2 73.2
wet 11.0 5.0 9.0 5.0 13.0 3.0 10.0 7.0 11.0 1.0 7.0 9.0
max_day 56.9 18.8 40.9 26.2 20.8 13.0 39.9 45.7 14.5 37.1 19.6 22.9
2024 total 955 mm; months complete: 11 of 12
2024 brought 955 mm, from 149.3 mm in January to 29.4 mm in June. The wettest day was 56.9 mm in January, and October had a single wet day. Only 11 of 12 months are complete, so the annual total is a lower bound.
Missing days, trace amounts, comparison with normal
1. Missing days
Count the months with missing days across the record, and what treating them as dry would do:
inc = m[~m.complete]
ym = lambda t: f"{int(t[0])}-{int(t[1]):02d}"
print(f"incomplete months since {int(m.index[0][0])}: {len(inc)} of {len(m)}; most recent: {ym(inc.index[-1]) if len(inc) else 'none'}")
print(f"months with 5 or more missing days: {(inc.dim - inc.days >= 5).sum()}")
incomplete months since 1937: 55 of 1056; most recent: 2024-05
months with 5 or more missing days: 54
55 of the 1,056 months since 1937 are incomplete, the most recent May 2024, and 54 of them are missing five days or more.
2. Trace amounts
A trace, precipitation too small to measure, is stored as 0 with the measurement flag T. Count them:
flags = G.PRCP_ATTRIBUTES.fillna(",,").str.split(",", expand=True)[0]
trace = (flags == "T") & (G.PRCP == 0)
print(f"days recorded as trace since 1937: {trace.loc['1937':].sum():,}; in 2024: {trace.loc['2024'].sum()}")
print(f"2024 days with measurable precipitation (> 0 mm): {(P.loc['2024'] > 0).sum()}; with at least 1 mm: {(P.loc['2024'] >= 1).sum()}")
days recorded as trace since 1937: 4,437; in 2024: 39
2024 days with measurable precipitation (> 0 mm): 123; with at least 1 mm: 91
4,437 days since 1937, 39 of them in 2024, are recorded as trace: precipitation fell but too little to measure. In 2024, 123 days had a measurable amount and 91 at least 1 mm. The threshold changes the count of wet days by a third.
3. Against the normal
Express each month as a percentage of its 1991-2020 normal:
norm = m.loc[1991:2020][lambda d: d.complete].groupby(level="month").total.mean()
pct = (y24.total / norm * 100).round(0)
pct.index = pd.to_datetime(pct.index, format="%m").strftime("%b")
print(pct.astype(int).to_dict())
print(f"2024: {y24.total.sum() / norm.sum():.0%} of the normal annual total of {norm.sum():.0f} mm")
{'Jan': 205, 'Feb': 54, 'Mar': 140, 'Apr': 65, 'May': 109, 'Jun': 28, 'Jul': 111, 'Aug': 141, 'Sep': 59, 'Oct': 40, 'Nov': 63, 'Dec': 84}
2024: 90% of the normal annual total of 1062 mm
January 2024 had 205% of its normal precipitation and June only 28%. The year as a whole reached 90% of the normal 1,062 mm, counting the incomplete May.
Rainfall records
The data used on this page
The GHCN-Daily record for USW00013743, Washington Reagan National Airport, from NOAA's National Centers for Environmental Information. Precipitation is stored in tenths of mm.
from pathlib import Path

import pandas as pd
import requests

Path("data").mkdir(exist_ok=True)
CSV = Path("data/USW00013743.csv")
if not CSV.exists():
    r = requests.get("https://www.ncei.noaa.gov/data/global-historical-climatology-network-daily/access/USW00013743.csv", timeout=600)
    r.raise_for_status(); CSV.write_bytes(r.content)
G = pd.read_csv(CSV, usecols=["DATE", "PRCP", "PRCP_ATTRIBUTES"], parse_dates=["DATE"]).set_index("DATE")
G = G.loc["1937":"2024"].copy()
G["PRCP"] = G.PRCP / 10
print(f"{G.PRCP.notna().sum():,} days with a precipitation value, 1937-2024")
30,514 days with a precipitation value, 1937-2024
From 1937 to 2024 there are 30,514 days with a precipitation value.
Example 1: records
The wettest and driest complete months and the wettest days:
full = m[m.complete]
print(f"wettest month: {ym(full.total.idxmax())} with {full.total.max():.0f} mm; driest: {ym(full.total.idxmin())} with {full.total.min():.1f} mm")
print(G.PRCP.nlargest(3).to_string())
wettest month: 1955-08 with 364 mm; driest: 1963-10 with 0.0 mm
DATE
1972-06-21 155.2
1942-08-08 144.5
1955-08-12 138.2
The wettest complete month on record is August 1955, at 364 mm, when the remnants of hurricanes Connie and Diane passed. October 1963 recorded no measurable precipitation at all. The wettest day was 21 June 1972, 155.2 mm, during Hurricane Agnes.
Sums and counts are sensitive to every day
Precipitation statistics are sums and counts, which makes them sensitive to every single day in a way temperature means are not. A monthly mean temperature with three missing days is still a good estimate; a monthly rainfall total with three missing days may have missed the month's only storm. The safe rule is to compute totals only for complete months, or for months with very few missing days if that is documented, and to never fill missing days with zero. Wet days need a threshold: 1 mm is the usual climatological choice, so that dew and trace amounts do not count. GHCN marks trace precipitation with a T flag and a value of zero.
Rainfall is also skewed and variable. One heavy day can make a month, a year's total can swing by half from one year to the next, and a difference of 50 mm means something different in a wet month and a dry one. That is why monthly comparisons with normal are expressed as percentages, and why long records are needed before calling a month exceptional. The daily maximum and the count of heavy days, such as those over 25 mm, often say more about flooding than the total does.
Snow, accumulations and undercatch
- Snow:
PRCPincludes the water equivalent of snow;SNOWis snowfall depth, a different quantity. - Accumulated values: GHCN flags multi-day accumulations; treat such a value as a total over several days, not one.
- Gauge undercatch: wind makes gauges catch less, especially snow; station totals are a lower bound.
- Gridded rainfall: reanalysis precipitation is a model product; prefer gauges or radar for local totals.
Internal links
- How to get NOAA GHCN daily weather station data in Python — the record used here
- Fixing gaps and missing values in weather station data — missing days in depth
- Rainfall return periods explained — how rare a heavy day is
FAQ
How do I calculate monthly rainfall totals in pandas?
Group daily precipitation by year and month, sum it, and keep only months where every day has a value.
Should missing rainfall days be treated as zero?
No; a missing day may have been wet. Flag the month as incomplete instead.
What is a wet day?
Climatologically, a day with at least 1 mm of precipitation.
How do I compare a month's rainfall with normal?
Divide the month's total by the 30-year mean for that month and express it as a percentage.