
Crash Exposure and Rates Explained
On this page
Problem statement
A crash rate is deaths divided by something, and the something decides the answer. Divide by residents and you measure how many people a place loses; by licensed drivers, how dangerous driving is for those allowed to do it; by registered vehicles, how often a vehicle is involved; by vehicle miles travelled, how often travel ends in a death. Each is called "the" crash rate somewhere, and they rank places differently. Choosing among them is choosing a question.
This page computes all four for the 50 US states and the District of Columbia in 2023, from FARS deaths, Census population estimates and three Federal Highway Administration tables: licensed drivers (DL-22), registered vehicles (MV-1) and vehicle miles (VM-2). It compares the rankings and finds the states whose position depends most on the denominator.
Quick answer
Put deaths and the four denominators in one table, keyed by state name, and compute each rate:
R = DEN.join(DEATHS)
R["per_100k_residents"] = R.deaths / R.residents * 1e5
R["per_100k_drivers"] = R.deaths / R.drivers * 1e5
R["per_100k_vehicles"] = R.deaths / R.vehicles * 1e5
R["per_100m_miles"] = R.deaths / (R.vmt_millions * 1e6) * 1e8
RATES = ["per_100k_residents", "per_100k_drivers", "per_100k_vehicles", "per_100m_miles"]
us = R.sum()
print(f"US: {us.deaths / us.residents * 1e5:.1f} per 100k residents, {us.deaths / us.drivers * 1e5:.1f} per 100k drivers, "
      f"{us.deaths / us.vehicles * 1e5:.1f} per 100k vehicles, {us.deaths / (us.vmt_millions * 1e6) * 1e8:.2f} per 100M miles")
print(R[RATES].rank(ascending=False).astype(int).sort_values("per_100k_residents").head(5).to_string())
US: 12.2 per 100k residents, 17.3 per 100k drivers, 14.4 per 100k vehicles, 1.26 per 100M miles
per_100k_residents per_100k_drivers per_100k_vehicles per_100m_miles
Mississippi 1 1 1 1
Wyoming 2 2 18 12
New Mexico 3 3 3 8
South Carolina 4 8 6 3
Arkansas 5 6 14 10
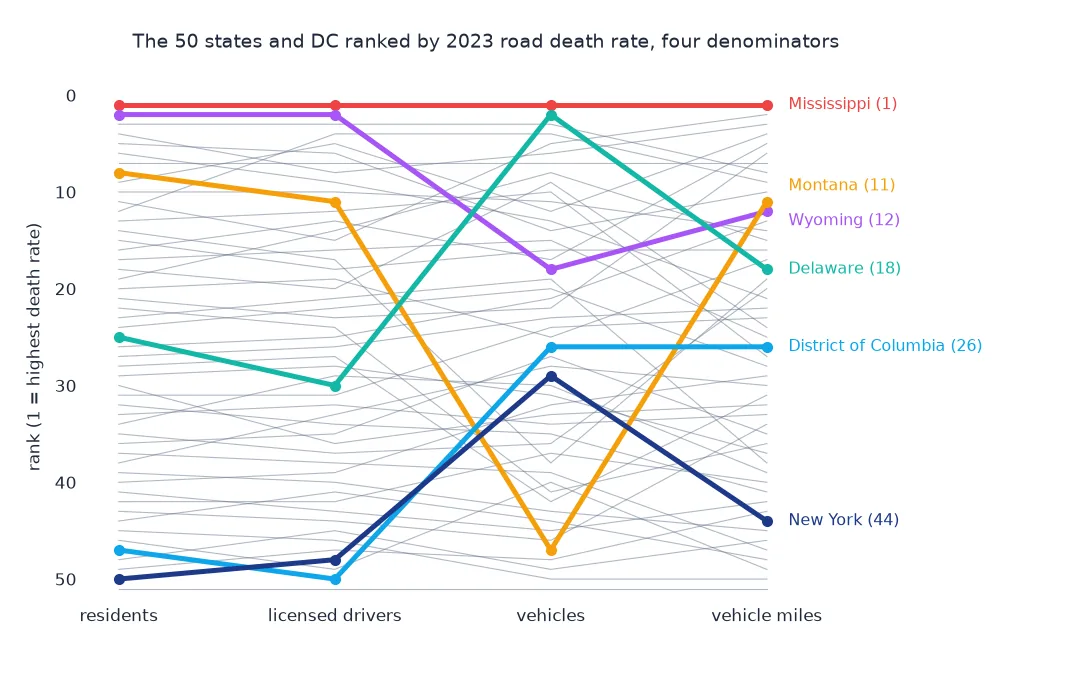
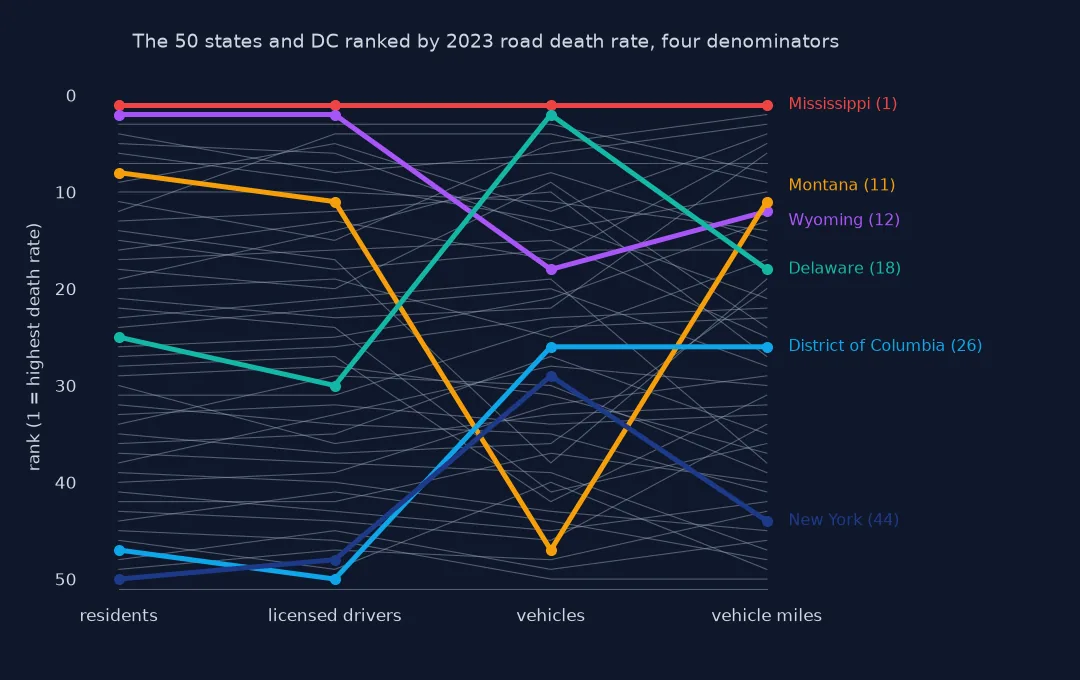
The same 41,025 deaths give 12.2 per 100,000 residents, 17.3 per 100,000 licensed drivers, 14.4 per 100,000 vehicles and 1.26 per 100 million miles. Mississippi is worst on all four. Wyoming, second per resident and per driver, is 18th per vehicle and 12th per mile.
Read FHWA tables, compare rankings, find states that move
1. Read the FHWA tables
The FHWA sheets have multi-row headers and state names with footnote markers such as "Alabama (2)", and two of them abbreviate the District of Columbia as "Dist. of Col.". Clean the names, keep the 51 rows that match Census state names, and check that nothing is missing:
print(f"states matched: {len(DEN)}; missing values: {int(DEN.isna().sum().sum())}")
print(f"drivers {DEN.drivers.sum() / 1e6:.1f} million; vehicles {DEN.vehicles.sum() / 1e6:.1f} million; "
      f"VMT {DEN.vmt_millions.sum() / 1e6:.2f} trillion miles; residents {DEN.residents.sum() / 1e6:.1f} million")
states matched: 51; missing values: 0
drivers 237.7 million; vehicles 284.6 million; VMT 3.25 trillion miles; residents 334.9 million
All 51 rows match on all four denominators. The country had 237.7 million licensed drivers, 284.6 million registered vehicles and 3.25 trillion vehicle miles for 334.9 million residents.
2. Compare the rankings
print(R[RATES].corr(method="spearman").round(2).to_string()) per_100k_residents per_100k_drivers per_100k_vehicles per_100m_miles
per_100k_residents 1.00 0.98 0.76 0.85
per_100k_drivers 0.98 1.00 0.77 0.84
per_100k_vehicles 0.76 0.77 1.00 0.77
per_100m_miles 0.85 0.84 0.77 1.00
Per resident and per driver are almost the same ranking, 0.98, because drivers are a fairly stable share of residents. Per vehicle agrees least with the others, 0.76 to 0.77.
3. Find the states that move most
ranks = R[RATES].rank(ascending=False)
R["rank_spread"] = ranks.max(axis=1) - ranks.min(axis=1)
print(ranks.assign(spread=R.rank_spread).sort_values("spread", ascending=False).head(6).astype(int).to_string())
print(f"drivers per resident: {(R.drivers / R.residents).min():.2f} to {(R.drivers / R.residents).max():.2f}; "
      f"vehicles per resident: {(R.vehicles / R.residents).min():.2f} to {(R.vehicles / R.residents).max():.2f}")
per_100k_residents per_100k_drivers per_100k_vehicles per_100m_miles spread
Montana 8 11 47 11 39
Delaware 25 30 2 18 28
District of Columbia 47 50 26 26 24
South Dakota 14 17 38 19 24
New York 50 48 29 44 21
North Dakota 22 24 41 36 19
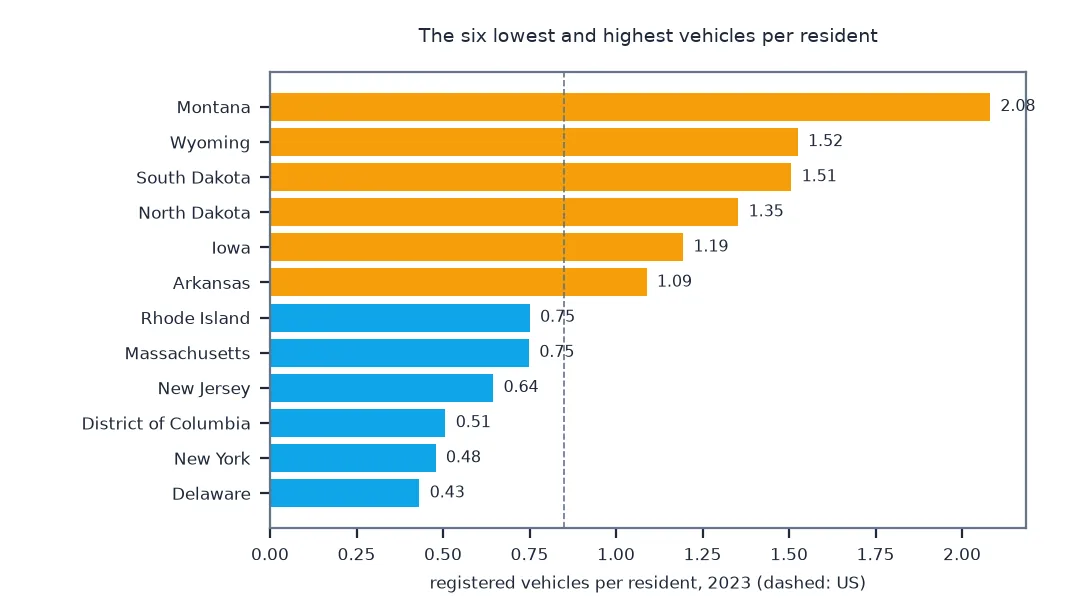
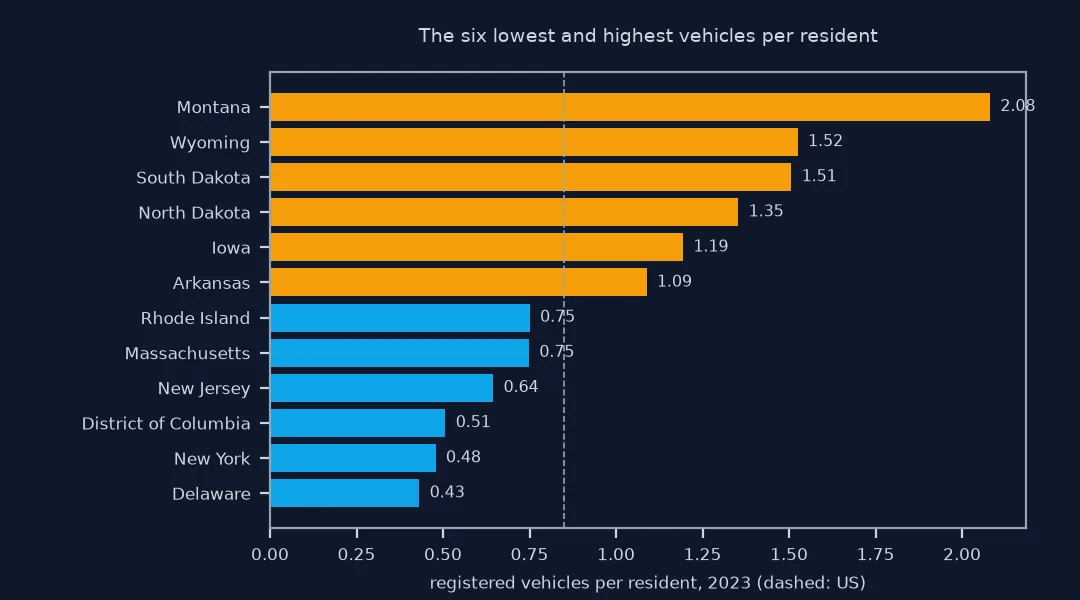
drivers per resident: 0.63 to 0.86; vehicles per resident: 0.43 to 2.08
Montana moves 39 places: 8th per resident, 47th per vehicle, with more than two registered vehicles per resident, the most of any state. Delaware is the reverse, 25th per resident and 2nd per vehicle. Vehicles per resident range almost fivefold, from 0.43 to 2.08, which is why the per-vehicle rate disagrees most.
One state, four rates
The data used on this page
NHTSA's FARS 2023 crash file; the Census Bureau's 2023 state population estimates; and the Federal Highway Administration's Highway Statistics 2023 tables DL-22 (licensed drivers by age), MV-1 (registered vehicles) and VM-2 (vehicle miles travelled).
import re
import zipfile
from pathlib import Path

import pandas as pd
import requests

Path("data").mkdir(exist_ok=True)
H = "https://www.fhwa.dot.gov/policyinformation/statistics/2023/xls/"
SRC = {"FARS2023NationalCSV.zip": "https://static.nhtsa.gov/nhtsa/downloads/FARS/2023/National/FARS2023NationalCSV.zip",
       "NST-EST2023-ALLDATA.csv": "https://www2.census.gov/programs-surveys/popest/datasets/2020-2023/state/totals/NST-EST2023-ALLDATA.csv",
       "dl22_2023.xlsx": H + "dl22.xlsx", "mv1_2023.xlsx": H + "mv1.xlsx", "vm2_2023.xlsx": H + "vm2.xlsx"}
for name, url in SRC.items():
    if not Path("data", name).exists():
        Path("data", name).write_bytes(requests.get(url, timeout=600).content)

clean = lambda s: re.sub(r"\s*\(\d+\)", "", str(s)).strip().replace("Dist. of Col.", "District of Columbia")
pop = pd.read_csv("data/NST-EST2023-ALLDATA.csv").query("SUMLEV == 40")
pop = pop[pop.NAME != "Puerto Rico"].set_index("NAME")
dl = pd.read_excel("data/dl22_2023.xlsx", sheet_name="TOTAL", header=None)
dl = dl.assign(name=dl[0].map(clean)).set_index("name")
drivers = dl.loc[dl.index.isin(pop.index), list(range(1, 16))].astype(float).sum(axis=1)   # 15 age bands
mv = pd.read_excel("data/mv1_2023.xlsx", sheet_name=0, header=None)
mv = mv.assign(name=mv[0].map(clean)).set_index("name")
vehicles = mv.loc[mv.index.isin(pop.index), 15].astype(float)                               # all motor vehicles
vm = pd.read_excel("data/vm2_2023.xlsx", sheet_name="A", header=None)
vm = vm.assign(name=vm[0].map(clean)).set_index("name")
vmt = vm.loc[vm.index.isin(pop.index), 17].astype(float)                                    # total VMT, millions
DEN = pd.DataFrame({"residents": pop.POPESTIMATE2023, "drivers": drivers, "vehicles": vehicles, "vmt_millions": vmt})
A = pd.read_csv(zipfile.ZipFile("data/FARS2023NationalCSV.zip").open("FARS2023NationalCSV/accident.csv"), encoding="latin1",
                low_memory=False, usecols=["STATENAME", "FATALS"])
DEATHS = A.groupby("STATENAME").FATALS.sum().rename("deaths")
print(f"{len(DEN)} rows, the 50 states and DC; {DEATHS.sum():,} deaths")
51 rows, the 50 states and DC; 41,025 deaths
Example 1: one state, four rates
The District of Columbia and Wyoming sit at opposite ends of almost every exposure measure:
for st in ("District of Columbia", "Wyoming", "Mississippi"):
    r = R.loc[st]
    print(f"{st}: residents rank {int(ranks.loc[st, 'per_100k_residents'])}, drivers {int(ranks.loc[st, 'per_100k_drivers'])}, "
          f"vehicles {int(ranks.loc[st, 'per_100k_vehicles'])}, miles {int(ranks.loc[st, 'per_100m_miles'])}; "
          f"{r.vmt_millions * 1e6 / r.residents:,.0f} miles per resident")
District of Columbia: residents rank 47, drivers 50, vehicles 26, miles 26; 5,126 miles per resident
Wyoming: residents rank 2, drivers 2, vehicles 18, miles 12; 16,298 miles per resident
Mississippi: residents rank 1, drivers 1, vehicles 1, miles 1; 13,928 miles per resident
DC ranks 47th per resident and 26th per mile: its residents drive 5,126 miles a year each. Wyoming's drive 16,298, and the order reverses. Only Mississippi is first however exposure is measured.
Exposure is opportunity for a crash
Exposure is the amount of opportunity for a crash: people, drivers, vehicles or miles. A rate divides harm by exposure so that places of different sizes and habits can be compared, and the choice of exposure decides what is being compared. Deaths per resident is the public health view: it includes pedestrians, passengers and visitors' crashes, and it is high where people drive a lot. Deaths per mile driven is the road safety view: it asks how dangerous travel is, and it is high where each mile is risky. Drivers and vehicles fall in between, and both carry their own distortions, such as fleets registered in one state and driven elsewhere.
The rankings agree broadly, because some states are dangerous on every measure, and disagree exactly where travel habits differ most. That is the information: a state that is high per resident and average per mile has a mileage problem more than a road problem, and a state that is high per mile has roads that are dangerous to use. None of these denominators fits the deaths of pedestrians and cyclists, whose exposure is walking and cycling, for which there is no state-level count in these tables.
Footnotes, registrations and licensed drivers
- Footnotes: FHWA tables mark estimated or adjusted values with footnote numbers in the state name; read them before relying on a single state.
- Registrations: vehicles registered in one state and used in another, such as rental and commercial fleets, distort per-vehicle rates.
- Licensed drivers: licences, not active drivers; older drivers who have stopped driving still hold them.
- Person miles: VMT counts vehicle miles, not person miles; occupancy differs by state.
- Years: all five sources are for 2023 here; mixing years shifts rates by the change in the denominator.
Internal links
- How to calculate road death rates per vehicle mile in Python — the VM-2 rate in detail
- How to calculate crime rates per resident in Python — the same question for crime
- How to map fatal road crashes in the US with FARS in Python — the deaths
FAQ
What is the best denominator for road crash rates?
It depends on the question: residents for public health, vehicle miles for road safety, licensed drivers for driver risk; show more than one when places are compared.
Why do states rank differently on different crash rates?
Because residents of different states drive different distances and own different numbers of vehicles; rates per resident absorb those differences, rates per mile remove them.
Where can I get licensed drivers and registered vehicles by state?
From the Federal Highway Administration's Highway Statistics tables DL-22 and MV-1, published each year as Excel files.
What is a crash exposure measure?
A measure of the opportunity for crashes, such as population, drivers, vehicles or miles travelled, used as the denominator of a rate.