
How to Estimate Alcohol-Impaired Road Deaths with FARS in Python
On this page
Problem statement
"How many road deaths involve a drunk driver?" sounds like a count, but most drivers in fatal crashes are never tested for alcohol, and the ones who are tested are not a random sample: police test where they suspect drinking, and surviving drivers are tested less often than those killed. Counting only test results undercounts, and assuming the untested were sober undercounts more. NHTSA's answer is multiple imputation: for every crash, FARS publishes ten plausible values of the highest driver blood alcohol concentration (BAC), filled in from the crash's circumstances where no test exists.
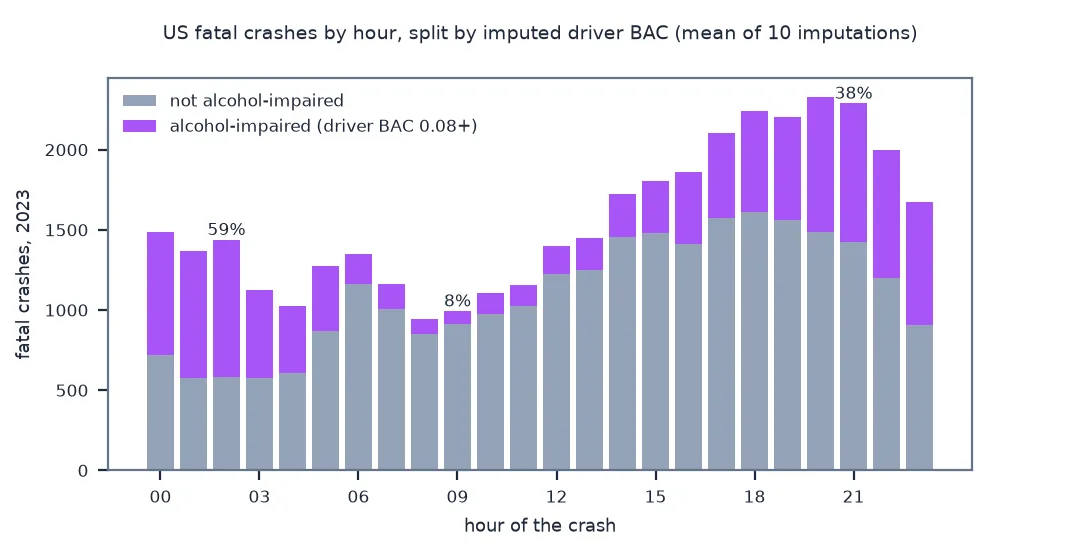
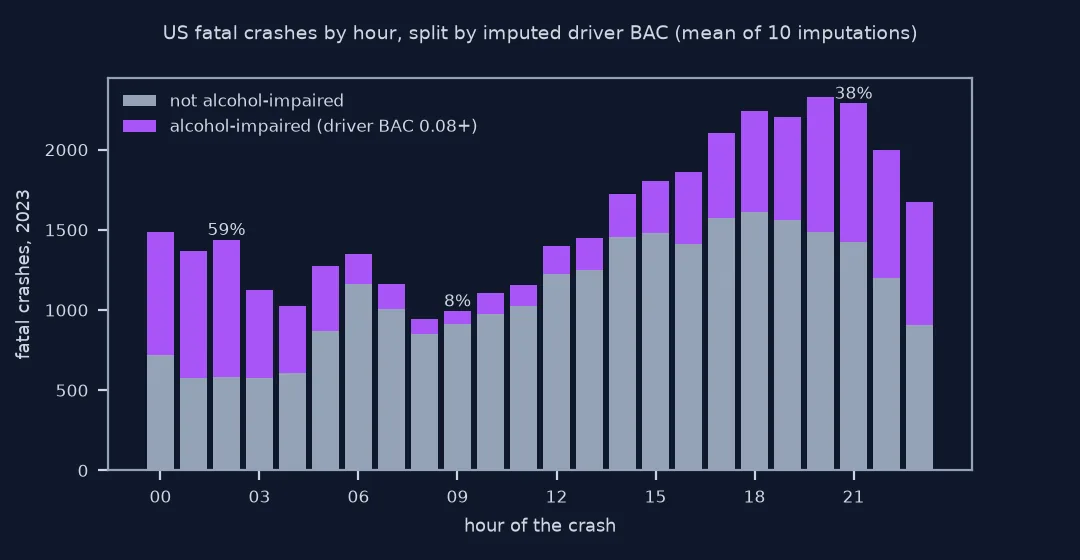
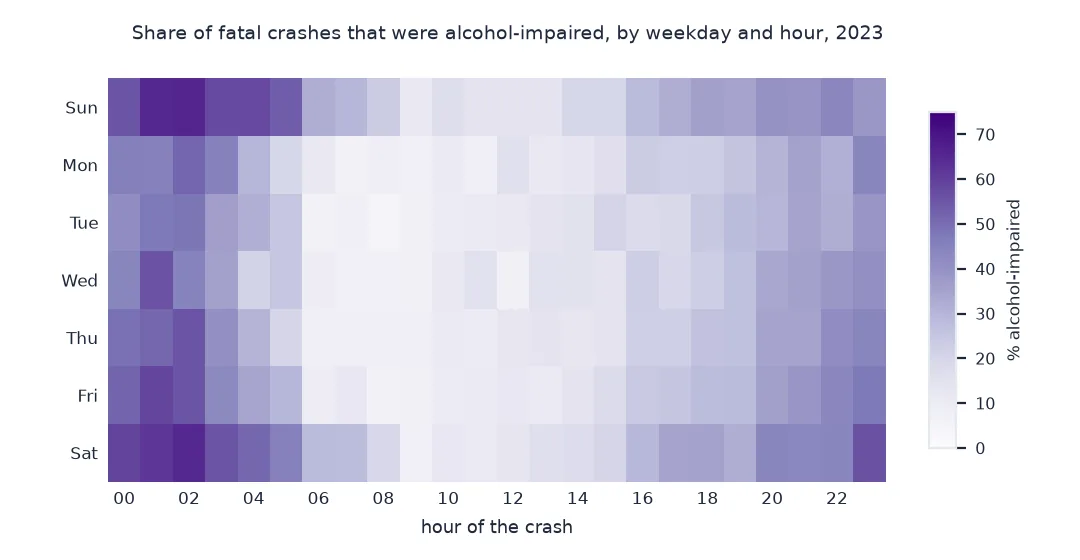
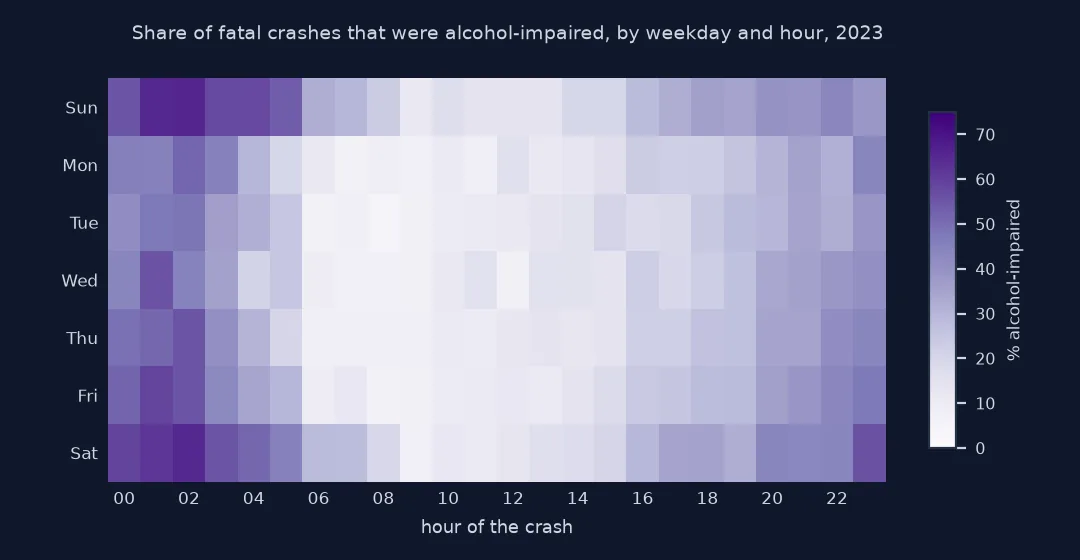
This page measures how much of FARS 2023 has a BAC test result, estimates deaths in alcohol-impaired-driving crashes (a driver at or above 0.08 g/dL) from the ten imputed values, reports the spread between imputations, and shows how sharply the share changes with the hour.
Quick answer
Join the crash file to MIDRVACC.CSV, the multiply imputed highest driver BAC, and average the result over its ten columns:
X = A.merge(MI, on="ST_CASE", how="left")
per_imputation = np.array([((X[c] >= 8) * X.FATALS).sum() for c in IMP])  # BAC in hundredths: 8 is 0.08 g/dL
print(f"deaths in alcohol-impaired-driving crashes: {per_imputation.mean():,.0f} ({per_imputation.mean() / A.FATALS.sum():.1%} of {A.FATALS.sum():,})")
print(f"range across the 10 imputations: {per_imputation.min():,} to {per_imputation.max():,}")
deaths in alcohol-impaired-driving crashes: 12,382 (30.2% of 41,025)
range across the 10 imputations: 12,192 to 12,587
Averaged over the ten imputations, 12,382 of 2023's 41,025 road deaths, 30.2%, were in crashes where a driver was at or above 0.08 g/dL. The imputations range from 12,192 to 12,587: the missing tests leave an uncertainty of a few hundred deaths, not thousands.
Who was tested, why they are unrepresentative, combined imputations
1. See how many drivers were tested
The person file records whether each driver was tested and the result; codes from 940 up mean no usable result:
D = P[P.PER_TYP == 1]
tested = D.ALC_RES < 940
print(f"drivers in fatal crashes: {len(D):,}; with a BAC result: {tested.sum():,} ({tested.mean():.1%})")
print(D.ALC_STATUSNAME.value_counts().to_string())
print(f"among drivers with a result, at or above 0.08: {(D.ALC_RES[tested] >= 80).mean():.1%}")
positive = ((D.ALC_RES >= 80) & tested).sum()
print(f"drivers with a result at or above 0.08: {positive:,}; as a share of all drivers, treating the untested as sober: {positive / len(D):.1%}")
drivers in fatal crashes: 58,125; with a BAC result: 22,760 (39.2%)
ALC_STATUSNAME
Test Not Given 25384
Test Given 24104
Not Reported 7214
Reported as Unknown if Tested 1423
among drivers with a result, at or above 0.08: 29.5%
drivers with a result at or above 0.08: 6,716; as a share of all drivers, treating the untested as sober: 11.6%
Only 39.2% of the 58,125 drivers have a usable BAC result. Counting positives alone finds 6,716 drivers over the limit, and treating the untested as sober would put the impaired share of all drivers at 11.6%.
2. Why the tested drivers are not representative
Testing depends on whether the driver died:
D2 = D.assign(killed=D.INJ_SEV == 4, tested=tested)
print(D2.groupby("killed").tested.mean().rename({True: "drivers killed", False: "drivers who survived"}).map("{:.1%}".format).to_string())
killed
drivers who survived 19.9%
drivers killed 63.7%
Drivers who died were tested in 63.7% of cases, survivors in 19.9%. Whether a driver is tested depends on how the crash ended, so tested drivers are not a sample from which the untested can be judged.
3. Combine the imputations properly
Each imputation is one plausible complete dataset. The estimate is the mean over them; its uncertainty adds the spread between them to the ordinary sampling variance, following Rubin's rules. With a census such as FARS, the between-imputation part is the uncertainty that matters:
m = len(IMP)
between = per_imputation.var(ddof=1)
print(f"estimate {per_imputation.mean():,.0f}; between-imputation standard deviation {np.sqrt(between * (1 + 1 / m)):,.0f}")
share = [((X[c] >= 8) * X.FATALS).sum() / X.FATALS.sum() for c in IMP]
print(f"share of deaths: {np.mean(share):.1%} ± {np.sqrt(np.var(share, ddof=1) * (1 + 1 / m)):.1%}")
estimate 12,382; between-imputation standard deviation 140
share of deaths: 30.2% ± 0.3%
The between-imputation standard deviation is 140 deaths, or 0.3 percentage points on the share.
Alcohol-impaired deaths by hour
The data used on this page
NHTSA's FARS 2023 national file: accident.csv, person.csv and MIDRVACC.CSV, the multiply imputed highest driver BAC for each crash, ten values per crash in hundredths of a gram per decilitre.
import zipfile
from pathlib import Path

import numpy as np
import pandas as pd
import requests

Path("data").mkdir(exist_ok=True)
F = Path("data/FARS2023NationalCSV.zip")
if not F.exists():
    F.write_bytes(requests.get("https://static.nhtsa.gov/nhtsa/downloads/FARS/2023/National/FARS2023NationalCSV.zip", timeout=600).content)
Z = zipfile.ZipFile(F)
A = pd.read_csv(Z.open("FARS2023NationalCSV/accident.csv"), encoding="latin1", low_memory=False, usecols=["ST_CASE", "FATALS", "HOUR", "DAY_WEEK"])
P = pd.read_csv(Z.open("FARS2023NationalCSV/person.csv"), encoding="latin1", low_memory=False,
                usecols=["ST_CASE", "PER_TYP", "INJ_SEV", "ALC_RES", "ALC_STATUSNAME"])
MI = pd.read_csv(Z.open("FARS2023NationalCSV/MIDRVACC.CSV"), encoding="latin1")
IMP = [f"A{i}" for i in range(1, 11)]
print(f"{len(A):,} crashes; imputed driver BAC for {len(MI):,} of them; {len(IMP)} imputations")
37,769 crashes; imputed driver BAC for 37,712 of them; 10 imputations
Example 1: the hour of the crash
Average the alcohol-impaired indicator over the imputations for each crash, then over crashes in each hour:
X["ai"] = np.mean([X[c] >= 8 for c in IMP], axis=0)
by_hour = X[X.HOUR < 24].groupby("HOUR").ai.mean()
print(f"highest: {by_hour.idxmax():02d}:00 at {by_hour.max():.0%}; lowest: {by_hour.idxmin():02d}:00 at {by_hour.min():.0%}")
night = X[X.HOUR.isin([0, 1, 2, 3])].ai.mean(); day = X[X.HOUR.between(8, 15)].ai.mean()
print(f"crashes between midnight and 04:00: {night:.0%} alcohol-impaired; 08:00 to 16:00: {day:.0%}")
highest: 02:00 at 59%; lowest: 09:00 at 8%
crashes between midnight and 04:00: 55% alcohol-impaired; 08:00 to 16:00: 13%
At 02:00, 59% of fatal crashes were alcohol-impaired; at 09:00, 8%. Between midnight and 04:00 the share is 55%, more than four times the daytime 13%.
Multiple imputation, explained
Multiple imputation replaces each missing value not with one guess but with several draws from a model of what it could have been, given what else is known about the crash, such as the time, the day, the vehicles involved and whether police reported alcohol involvement. Analysing each completed dataset and averaging the results gives an estimate that uses the circumstances of untested crashes rather than ignoring them, and the spread across draws shows how much the missing tests matter.
The alternative approaches both fail in predictable directions. Counting positive tests only treats every untested driver as sober and gives far too few. Using the share among tested drivers assumes testing is random, when drivers who die are tested much more often than those who survive. The imputed estimate sits between the naive answers and close to the tested share in this year, but the agreement is a coincidence of two biases offsetting, not a validation.
NHTSA's published figures for alcohol-impaired-driving deaths are computed this way, which is why they rarely round to the counts an analyst gets from the person file.
Units, pedestrians and drugs
- Units: imputed BAC is in hundredths of g/dL (8 = 0.08);
ALC_RESin the person file is in thousandths (80 = 0.080). - Crashes without an imputation: a few crashes have no driver to impute, such as those with only non-motorists; they are absent from
MIDRVACC. - Pedestrians:
MIACC.CSVimputes the highest BAC among drivers and non-occupants; use it to include impaired pedestrians. - Drugs: the drug files record tests, not impairment, and have no imputation; drug-involvement counts are not comparable to alcohol estimates.
- State comparisons: imputation models are national; small-state estimates carry wide between-imputation spreads.
Internal links
- How to map fatal road crashes in the US with FARS in Python — the FARS files
- How to analyse pedestrian deaths with FARS in Python — the person file
FAQ
How many US road deaths involve alcohol-impaired drivers?
From the FARS 2023 imputed driver BAC, about 12,400 deaths, 30% of the total, were in crashes with a driver at 0.08 g/dL or above.
Why can't I just count positive BAC tests in FARS?
Because most drivers in fatal crashes, 61% in 2023, have no test result, and testing is far more common for drivers who were killed.
How do I use the FARS multiple imputation files?
Join MIDRVACC.CSV to accident.csv on ST_CASE, compute the statistic separately for each of the columns A1 to A10, and average the ten results.
When are alcohol-impaired crashes most common?
At night: in 2023, 55% of fatal crashes between midnight and 04:00 were alcohol-impaired, against about one in ten during the morning.