
Why Are Some of My Crash Points in the Arctic or the Wrong State?
On this page
Problem statement
You map five years of FARS fatal crashes and a few hundred points appear at 77.78° north, in the Arctic Ocean, or off the edge of the map at a longitude of 777. A few dozen more sit in the wrong state, or just across a border. Nothing is wrong with your projection. FARS stores missing coordinates as codes rather than blanks, and two of the latitude codes, 77.7777 and 88.8888, are perfectly valid latitudes, so a range check lets them through. The rest are real coordinates that disagree with the crash's own state code, which is worth checking for any point dataset that records both.
This page counts the coded coordinates in FARS 2019–2023, shows what a naive filter keeps, and checks every remaining point against the boundary of the state FARS says it is in, measuring how far outside the misplaced ones are.
Quick answer
Filter the codes explicitly, by value, before building points:
LAT_CODES, LON_CODES = {77.7777, 88.8888, 99.9999}, {777.7777, 888.8888, 999.9999}
coded = A.LATITUDE.isin(LAT_CODES) | A.LONGITUD.isin(LON_CODES)
naive = A[(A.LATITUDE.between(-90, 90)) & (A.LONGITUD.between(-180, 180))]
print(f"{len(A):,} crashes 2019-2023; coded coordinates: {coded.sum()} ({coded.mean():.2%})")
print(f"kept by a range check on latitude alone: {A.LATITUDE.between(-90, 90)[coded].sum()} coded crashes; by a check on both: {len(naive) - (~coded).sum()}")
print(pd.crosstab(A.LATITUDE.where(A.LATITUDE.isin(LAT_CODES), 0), A.LONGITUD.where(A.LONGITUD.isin(LON_CODES), 0)).to_string())
186,398 crashes 2019-2023; coded coordinates: 703 (0.38%)
kept by a range check on latitude alone: 409 coded crashes; by a check on both: 0
LONGITUD 0.0000 777.7777 888.8888 999.9999
LATITUDE
0.0000 185695 0 0 0
77.7777 0 350 0 0
88.8888 0 0 59 0
99.9999 0 0 0 294
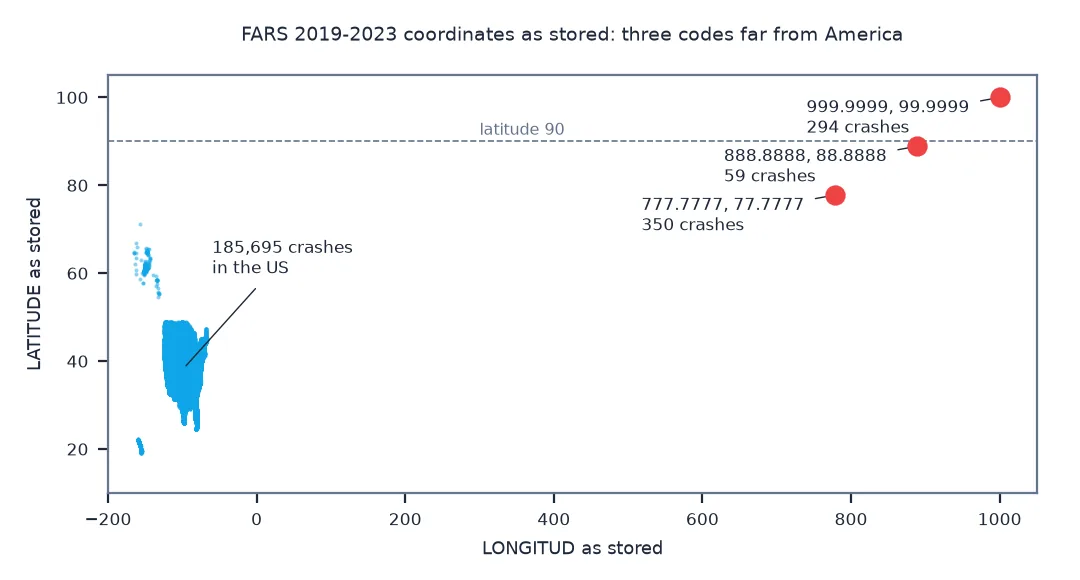
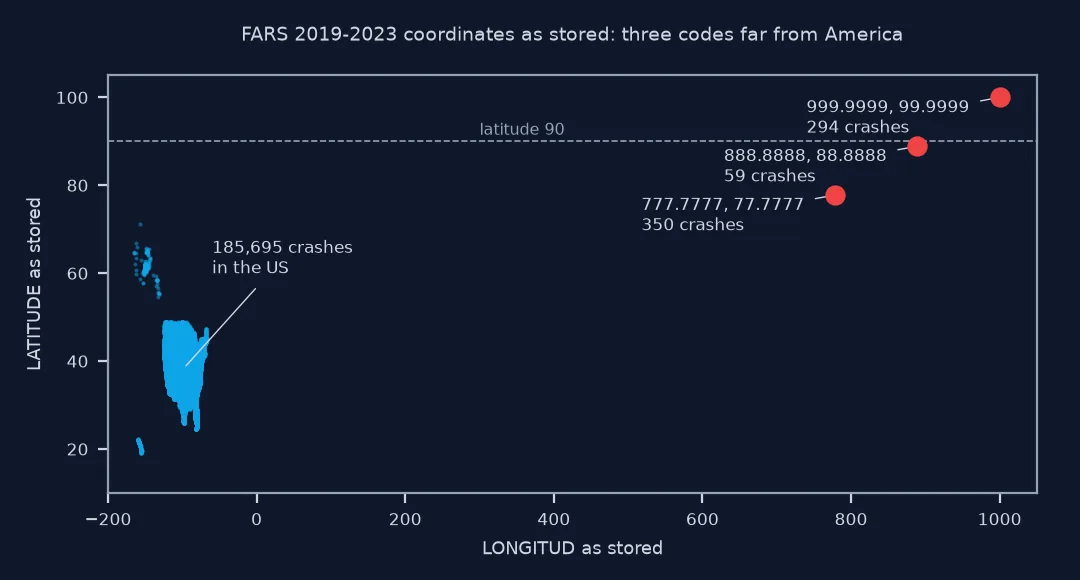
703 of 186,398 crashes, 0.38%, carry coded coordinates, and the codes always come in matching pairs. A range check on latitude alone would keep 409 of them, the 77.7777 and 88.8888 pairs; checking longitude too removes them all, but only because the paired longitude codes are out of range.
What each code means, points against their own state
1. Know what each code means
The codes come in pairs, one for latitude and one for longitude, and mean not reported, not available and unknown in the FARS manual's terms. Count them by year:
by_year = A.assign(coded=coded).groupby("YEAR").coded.agg(["sum", "mean"])
print(by_year.rename(columns={"sum": "coded crashes", "mean": "share"}).round(4).to_string())
coded crashes share
YEAR
2019 68 0.0020
2020 170 0.0047
2021 122 0.0031
2022 214 0.0054
2023 129 0.0034
The share varies from 0.20% in 2019 to 0.54% in 2022, so the codes are a moving part of every year's file, not a one-off.
2. Check points against their own state
Every crash has a STATE code. A point outside that state's boundary is either near a border, where boundary generalisation and coordinate rounding matter, or misplaced:
ok = A[~coded]
P = gpd.GeoDataFrame(ok, geometry=gpd.points_from_xy(ok.LONGITUD, ok.LATITUDE), crs=4326).to_crs(STATES.crs)
J = gpd.sjoin(P, STATES[["STATEFP", "geometry"]], predicate="within", how="left")
off = J[J.STATEFP != J.STATE].to_crs(5070)
own = STATES.set_index("STATEFP").to_crs(5070).geometry
off["km_outside"] = [own[s].distance(g) / 1000 for s, g in zip(off.STATE, off.geometry)]
print(f"points outside their own state: {len(off)} of {len(J):,}; in no state at all: {J.STATEFP.isna().sum()}")
print(off.km_outside.describe(percentiles=[0.5, 0.9]).round(2).to_string())
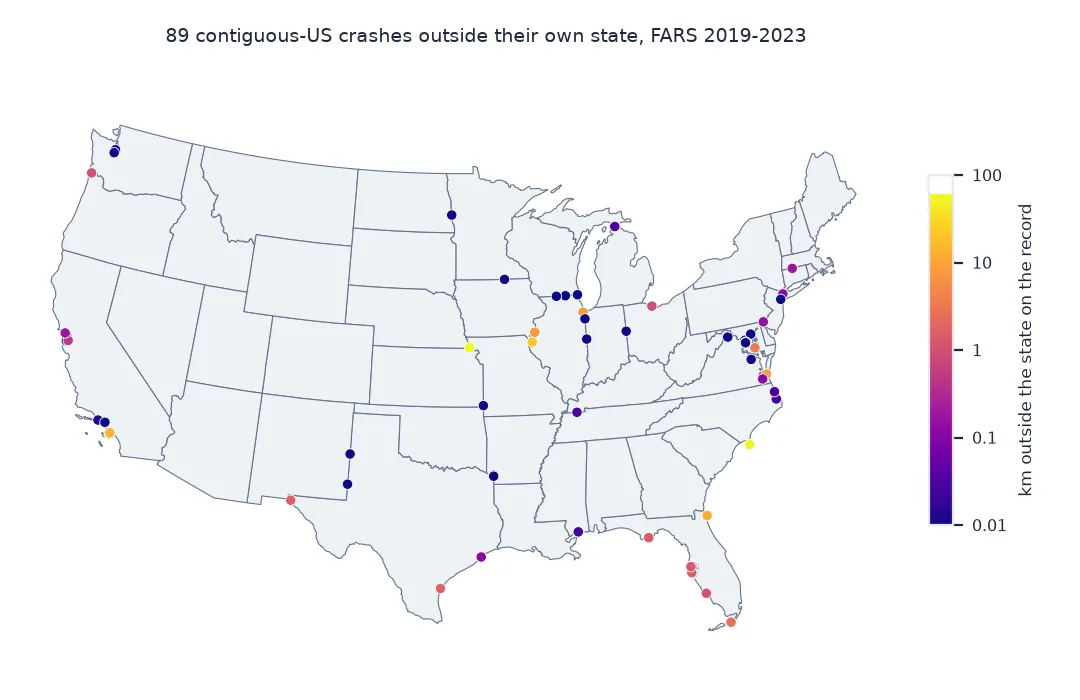
points outside their own state: 92 of 185,695; in no state at all: 65
count 92.00
mean 2.76
std 8.99
min 0.00
50% 0.11
90% 4.12
max 60.75
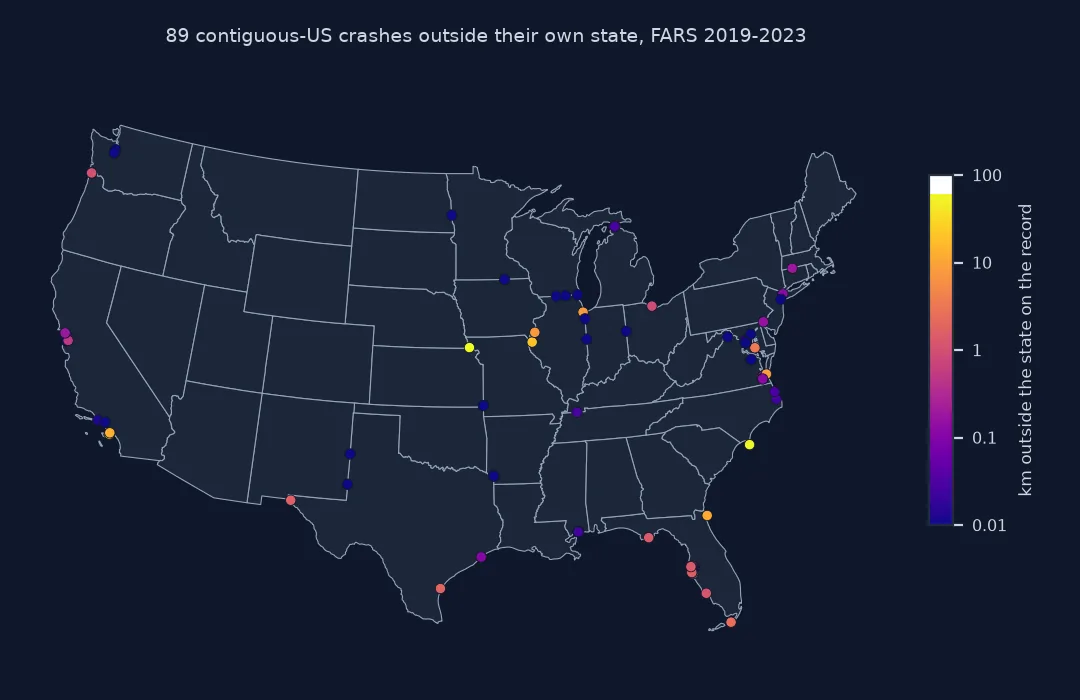
Of the 185,695 crashes with real coordinates, 92 fall outside the state their record names, 65 of them outside any state, mostly offshore. Half are within 110 metres of the right state.
3. Decide what to do with each kind
near = off.km_outside < 1
print(f"within 1 km of their state: {near.sum()} (keep; border and coastline precision)")
print(f"more than 1 km away: {(~near).sum()}; more than 10 km: {(off.km_outside > 10).sum()} (flag or drop)")
print(off[~near].sort_values("km_outside", ascending=False)[["YEAR", "STATE", "LATITUDE", "LONGITUD", "km_outside"]].head(4).round(2).to_string(index=False))
within 1 km of their state: 60 (keep; border and coastline precision)
more than 1 km away: 32; more than 10 km: 6 (flag or drop)
YEAR STATE LATITUDE LONGITUD km_outside
2019 19 40.04 -95.51 60.75
2019 45 33.68 -78.00 54.10
2019 19 40.23 -91.24 21.10
2019 6 33.50 -118.11 20.08
60 of the 92 are within a kilometre of their state, the precision of coastlines and borders. 32 are further and 6 more than 10 km away, such as an Iowa crash placed 61 km away; these are worth flagging, and checking against the crash's county and road.
What a naive map would show
The data used on this page
NHTSA's FARS national files for 2019 to 2023, crash level, and the Census Bureau's 2023 cartographic boundary file for states at 1:500,000.
import zipfile
from pathlib import Path

import geopandas as gpd
import pandas as pd
import requests

Path("data").mkdir(exist_ok=True)
frames = []
for year in range(2019, 2024):
    f = Path(f"data/FARS{year}NationalCSV.zip")
    if not f.exists():
        f.write_bytes(requests.get(f"https://static.nhtsa.gov/nhtsa/downloads/FARS/{year}/National/FARS{year}NationalCSV.zip", timeout=600).content)
    z = zipfile.ZipFile(f)
    a = pd.read_csv(z.open(next(n for n in z.namelist() if n.lower().endswith("accident.csv"))), encoding="latin1", low_memory=False)
    a.columns = [c.replace("", "").upper() for c in a.columns]
    frames.append(a[["STATE", "ST_CASE", "YEAR", "LATITUDE", "LONGITUD"]])
A = pd.concat(frames, ignore_index=True)
S = Path("data/cb_2023_us_state_500k.zip")
if not S.exists():
    S.write_bytes(requests.get("https://www2.census.gov/geo/tiger/GENZ2023/shp/cb_2023_us_state_500k.zip", timeout=300).content)
STATES = gpd.read_file(S).astype({"STATEFP": int})
print(f"{len(A):,} crashes; {len(STATES)} state and territory boundaries")
186,398 crashes; 56 state and territory boundaries
Example 1: what a naive map would show
Count where the naive filter's coded points would land:
arctic = naive[naive.LATITUDE.isin({77.7777, 88.8888})]
print(f"points a latitude-and-longitude range check keeps from the codes: {len(arctic)}")
lat_only = A[A.LATITUDE.between(-90, 90)]
kept = lat_only[lat_only.LATITUDE.isin({77.7777, 88.8888})]
print(f"a latitude-only check keeps {len(kept)} coded points, with longitudes {[float(x) for x in sorted(kept.LONGITUD.unique())]}")
points a latitude-and-longitude range check keeps from the codes: 0
a latitude-only check keeps 409 coded points, with longitudes [777.7777, 888.8888]
Every one of the 409 latitude codes a latitude-only check keeps has a longitude code beside it, 777.7777 or 888.8888, which is why it plots off the edge of a world map.
Missing numbers filled with codes
Many government datasets fill missing numbers with codes, a habit from fixed-width files where a blank field was ambiguous. FARS uses repeated digits: 77.7777, 88.8888 and 99.9999 for latitude, 777.7777, 888.8888 and 999.9999 for longitude, and similar patterns across its other variables, such as 98 and 99 for an unknown hour or age. The codes are documented and consistent, and they are easy to forget because most of them are out of range and fail quietly. The two latitude codes below 90 are the exception: they look like places.
A second check, the point against its record's own state, catches errors of a different kind: transposed or mistyped digits, crashes located at the wrong end of a long road, and points just outside a border because the boundary file is generalised or the coordinates are rounded. Most of the misplaced FARS points are within a few hundred metres of their state and are worth keeping; the handful many kilometres away are worth flagging. The same check works for any dataset that records an administrative area beside the coordinates.
Filtering by both coordinates and county checks
- Filter by both: the codes come in pairs here, but filtering on latitude and longitude separately protects against a dataset where they do not.
- Boundary precision: the 1:20,000,000 state file puts many coastal crashes in the sea; use 1:500,000 or finer for point checks.
- Older years: check the coordinate fields in each year's manual before stacking older files.
- Other code fields:
HOUR99,AGE998 and 999,TRAV_SP997 to 999; filter each before arithmetic. - County check:
COUNTYallows the same test at a finer level, with county boundaries.
Internal links
- How to map fatal road crashes in the US with FARS in Python — the FARS files
- How to find clusters of fatal crashes with DBSCAN in Python — where coded points would form false clusters
FAQ
What does a latitude of 77.7777 mean in FARS?
It is a code for a missing location ("not reported"), paired with a longitude of 777.7777; it is not a place in the Arctic.
How do I remove FARS missing coordinates in Python?
Filter the code values explicitly, ~A.LATITUDE.isin({77.7777, 88.8888, 99.9999}), rather than relying on a range check.
How many FARS crashes have no coordinates?
In 2019–2023, 703 of 186,398 crashes, 0.38%, carry coded coordinates.
Why are some crash points in the wrong state?
Most are within a few hundred metres of the border or coast; a few are misplaced by kilometres; check each point against the state its record names.