
Why Did Serious Injuries Jump in My STATS19 Time Series?
On this page
Problem statement
You plot killed-or-seriously-injured collisions for a police force year by year, and one year the share of collisions classed as serious leaps by half and stays there. Nothing happened on the roads. The force changed how it records injuries: from officers judging severity at the scene to an injury-based system, CRASH or similar, in which the officer records the injuries and the severity follows from them. Injury-based recording classifies more injuries as serious, so every force that switches produces a step in its series, and the national total drifts upwards as forces switch one after another.
This page uses the last five years of STATS19 collisions, 2021–2025, to find the forces that switched, measures the step in their recorded KSI share, and shows how far the DfT's adjusted severity, which estimates what each collision would have been under injury-based recording, removes it.
Quick answer
Use the adjusted severity column for any series that spans a change of recording method:
C["ksi_recorded"] = C.collision_severity.isin([1, 2])
C["ksi_adjusted"] = (C.collision_severity == 1) + C.collision_adjusted_severity_serious
Y = C.groupby("collision_year").agg(collisions=("collision_index", "size"), injury_based=("collision_injury_based", "mean"),
                                    ksi_recorded=("ksi_recorded", "sum"), ksi_adjusted=("ksi_adjusted", "sum"))
print(Y.round(3).to_string())
print(f"2021 to 2025: recorded KSI {Y.ksi_recorded.iloc[-1] / Y.ksi_recorded.iloc[0] - 1:+.1%}, adjusted {Y.ksi_adjusted.iloc[-1] / Y.ksi_adjusted.iloc[0] - 1:+.1%}")
collisions injury_based ksi_recorded ksi_adjusted
collision_year
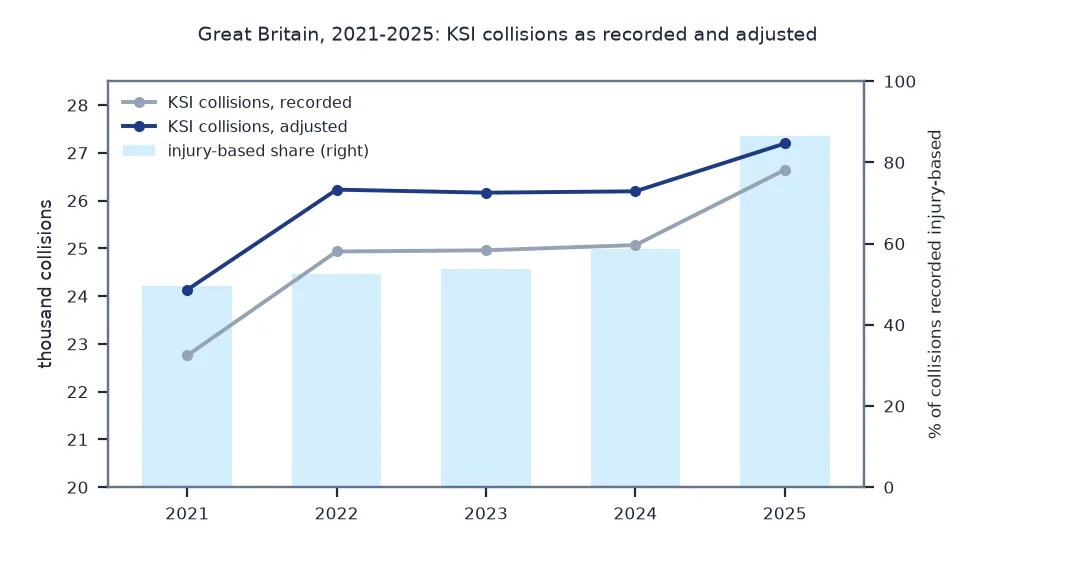
2021 101087 0.496 22758 24132.075
2022 106004 0.526 24935 26229.329
2023 104258 0.537 24960 26166.024
2024 100927 0.588 25069 26195.027
2025 101525 0.865 26644 27195.780
2021 to 2025: recorded KSI +17.1%, adjusted +12.7%
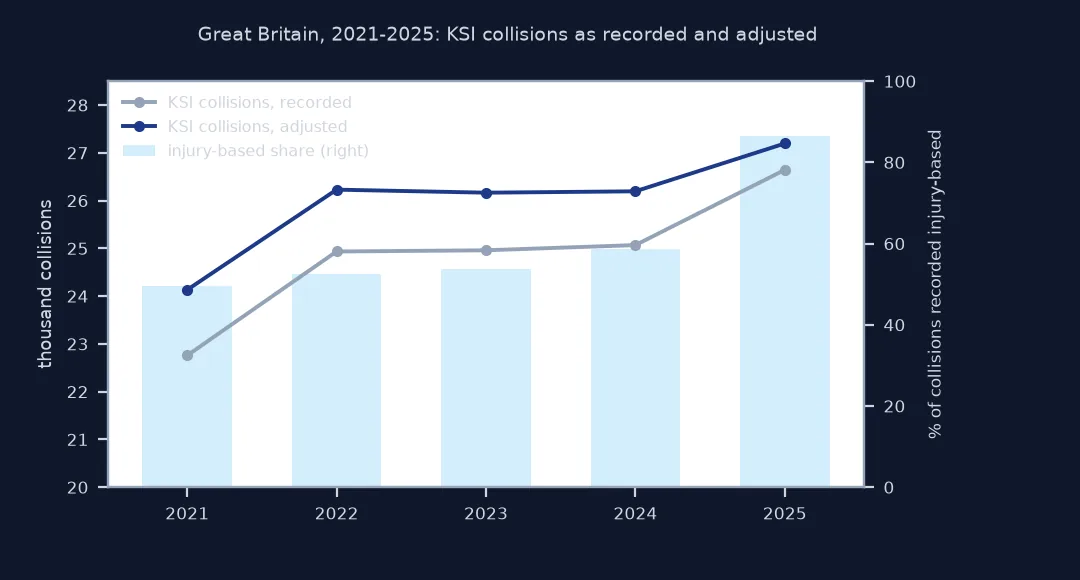
The share of collisions recorded by injury-based systems rose from 49.6% in 2021 to 86.5% in 2025, most of it in the last year. Recorded KSI collisions rose 17.1% over the period, adjusted ones 12.7%: about a quarter of the apparent increase is the change of method.
Forces that switched, the size of the step, every switch
1. Find the forces that switched
The collision_injury_based flag says, for each collision, whether it was recorded with an injury-based system. A force that switched has years near 0 and years near 1:
F = C.groupby(["police_force", "collision_year"]).collision_injury_based.mean().unstack()
switched = F[(F.max(axis=1) > 0.9) & (F.min(axis=1) < 0.1)]
switched.index = switched.index.map(FORCE_NAMES)
print(f"forces that switched within 2021-2025: {len(switched)}")
print(switched.round(2).to_string())
forces that switched within 2021-2025: 9
collision_year 2021 2022 2023 2024 2025
police_force
Metropolitan Police 0.00 0.0 0.00 0.00 0.91
Cheshire 0.00 0.0 0.00 0.40 1.00
Cleveland 0.00 0.0 0.00 0.74 1.00
Derbyshire 0.00 0.0 0.00 0.11 1.00
Nottinghamshire 0.06 1.0 1.00 1.00 1.00
Leicestershire 0.00 0.0 0.00 1.00 1.00
Northamptonshire 0.00 0.0 0.00 1.00 1.00
Avon and Somerset 0.00 0.0 0.00 0.00 1.00
Dyfed-Powys 0.00 0.0 0.69 1.00 1.00
Nine forces switched within the five years, most of them in 2024 or 2025. The Metropolitan Police appears among them because its flag changes in 2025.
2. Measure the step
For one force that switched in 2025, compare recorded and adjusted KSI shares year by year:
f = C[C.police_force == 52].groupby("collision_year").agg(injury_based=("collision_injury_based", "mean"),
                                                         recorded=("ksi_recorded", "mean"), adjusted=("ksi_adjusted", "mean"))
print(FORCE_NAMES[52]); print(f.round(3).to_string())
print(f"2024 to 2025: recorded {f.recorded[2025] / f.recorded[2024] - 1:+.0%}; adjusted {f.adjusted[2025] / f.adjusted[2024] - 1:+.0%}")
Avon and Somerset
injury_based recorded adjusted
collision_year
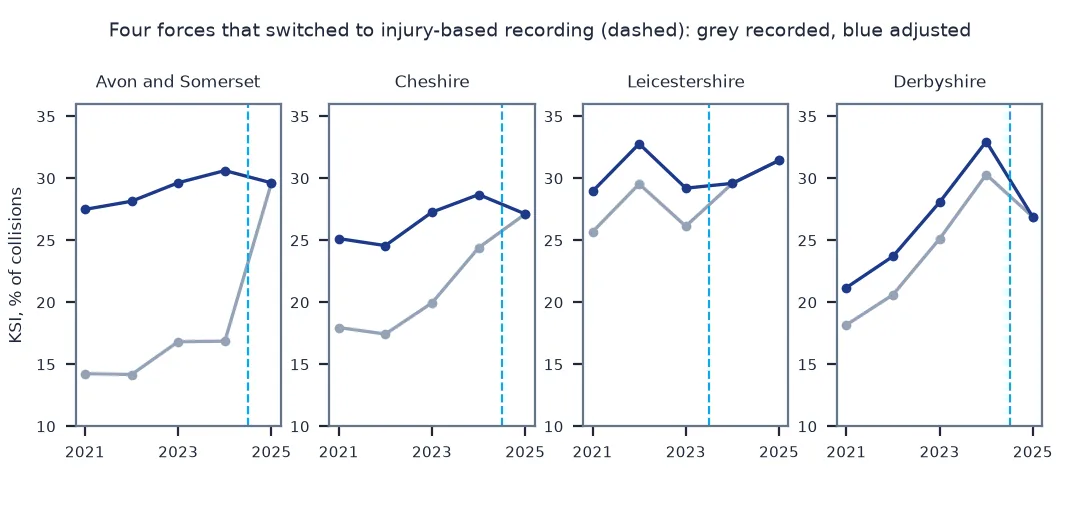
2021 0.001 0.143 0.275
2022 0.000 0.142 0.282
2023 0.000 0.168 0.297
2024 0.000 0.169 0.306
2025 1.000 0.296 0.296
2024 to 2025: recorded +76%; adjusted -3%
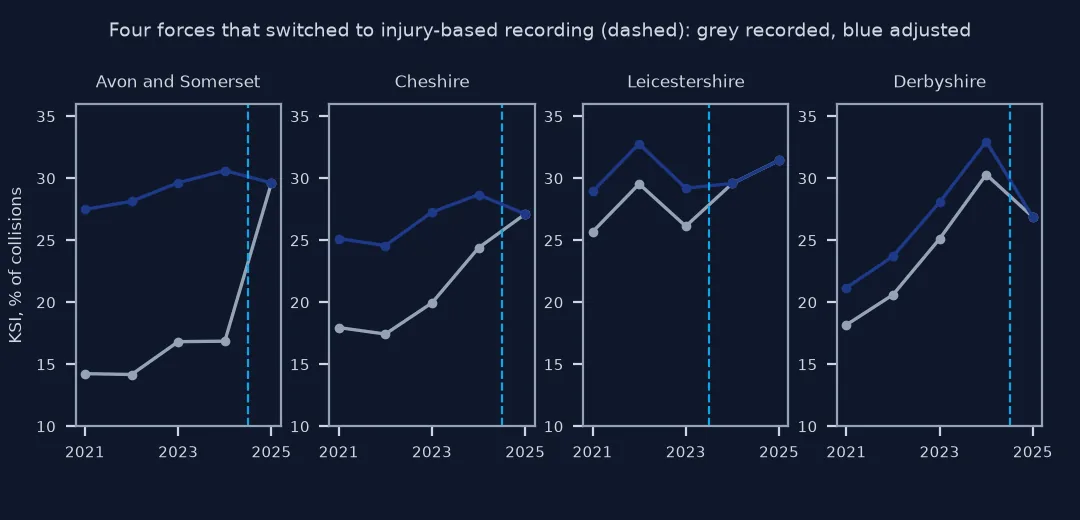
Avon and Somerset's recorded KSI share rises from 16.9% of collisions in 2024 to 29.6% in 2025, 76% higher, the year its flag goes from 0 to 1. Its adjusted share was already about 30% before the switch and barely moves.
3. Check every switching force
Average the change across all forces in their switch year:
rows = []
for code in switched.index.map({v: k for k, v in FORCE_NAMES.items()}):
    s = C[C.police_force == code].groupby("collision_year").agg(ib=("collision_injury_based", "mean"), rec=("ksi_recorded", "mean"), adj=("ksi_adjusted", "mean"))
    first = s.index[s.ib > 0.9][0]
    if first - 1 in s.index:
        rows.append({"force": FORCE_NAMES[code], "switch year": first, "recorded change": s.rec[first] / s.rec[first - 1] - 1, "adjusted change": s.adj[first] / s.adj[first - 1] - 1})
R = pd.DataFrame(rows).sort_values("recorded change", ascending=False)
print(R.round(3).to_string(index=False))
print(f"median: recorded {R['recorded change'].median():+.1%}, adjusted {R['adjusted change'].median():+.1%}")
force switch year recorded change adjusted change
Avon and Somerset 2025 0.757 -0.032
Nottinghamshire 2022 0.276 -0.064
Cleveland 2025 0.231 0.172
Leicestershire 2024 0.132 0.013
Cheshire 2025 0.112 -0.054
Dyfed-Powys 2024 0.105 0.029
Metropolitan Police 2025 0.076 0.076
Northamptonshire 2024 -0.002 0.241
Derbyshire 2025 -0.113 -0.185
median: recorded +11.2%, adjusted +1.3%
In the switch year the median force's recorded KSI share rose 11.2% and its adjusted share 1.3%. The adjustment removes most of the step, but not every force's series is smooth afterwards: Cleveland's and Northamptonshire's adjusted shares still rose by 17% and 24%, and Derbyshire's fell 18%, a reminder that the adjustment is a model applied collision by collision.
A force whose figures already matched
The data used on this page
The Department for Transport's road safety open data, the collision file for the last five years (dft-road-casualty-statistics-collision-last-5-years.csv, 2021–2025), and the ONS local authority to police force area lookup for December 2023, used to name forces.
from pathlib import Path

import pandas as pd
import requests

Path("data").mkdir(exist_ok=True)
F5 = Path("data/dft-road-casualty-statistics-collision-last-5-years.csv")
if not F5.exists():
    F5.write_bytes(requests.get("https://data.dft.gov.uk/road-accidents-safety-data/dft-road-casualty-statistics-collision-last-5-years.csv", timeout=900).content)
LU = Path("data/lad23_pfa23_lookup.csv")
if not LU.exists():
    url = "https://services1.arcgis.com/ESMARspQHYMw9BZ9/arcgis/rest/services/LAD23_CSP23_PFA23_EW_LU/FeatureServer/0/query"
    rows, offset = [], 0
    while True:
        d = requests.get(url, timeout=120, params={"where": "1=1", "outFields": "LAD23CD,PFA23NM", "f": "json", "resultOffset": offset}).json()
        rows += [f["attributes"] for f in d["features"]]; offset += len(d["features"])
        if not d.get("exceededTransferLimit"):
            break
    pd.DataFrame(rows).to_csv(LU, index=False)
C = pd.read_csv(F5, low_memory=False)
PFA = pd.read_csv(LU).drop_duplicates("LAD23CD").set_index("LAD23CD").PFA23NM
lad = C.groupby("police_force").local_authority_ons_district.agg(lambda v: v.mode()[0])
FORCE_NAMES = lad.map(PFA).where(~lad.str.startswith("S"), "Police Scotland").to_dict()
print(f"{len(C):,} collisions, {C.collision_year.min()}-{C.collision_year.max()}; {len(FORCE_NAMES)} police forces")
513,801 collisions, 2021-2025; 44 police forces
Example 1: a force whose figures already matched
The Metropolitan Police's recorded and adjusted KSI shares are identical in every year, whatever the flag says:
m = C[C.police_force == 1].groupby("collision_year").agg(flag=("collision_injury_based", "mean"), recorded=("ksi_recorded", "mean"), adjusted=("ksi_adjusted", "mean"))
print(m.round(3).to_string())
print(f"largest gap between recorded and adjusted: {(m.recorded - m.adjusted).abs().max():.4f}")
flag recorded adjusted
collision_year
2021 0.001 0.150 0.150
2022 0.001 0.161 0.161
2023 0.001 0.156 0.156
2024 0.001 0.170 0.170
2025 0.906 0.183 0.183
largest gap between recorded and adjusted: 0.0000
The Met's adjusted and recorded shares are identical in every year, including the four in which its flag reads about 0, so its own series has no step to remove.
How severity is decided has changed
Severity in STATS19 has always been recorded by police, but the way it is decided has changed. Under the older approach the officer judges whether an injury is serious; under injury-based systems the officer records the injury, a broken limb, a head injury, and the system assigns severity from a fixed list. Analysis for the DfT found that injury-based recording classes more casualties as seriously injured, so a force's series steps up when it switches. With forces adopting CRASH or similar systems at different times, both force-level and national series contain steps that have nothing to do with road safety.
The DfT's response was to model, for every collision recorded by officer judgement, the probability that it would have been classified as serious under injury-based recording, and to publish those probabilities in the open data. Summing them gives an adjusted serious count, comparable across forces and years. For a force recording by injury-based methods the adjustment is zero, and for a force recording by judgement it is usually upwards, though it can be downwards for individual forces. The flag column shows the switch; the adjusted columns are what to analyse.
Partial years and revised adjustments
- Partial years: forces often switch mid-year, so the switch year itself mixes both methods; compare the years either side.
- The flag is not the whole story: a force can show recorded and adjusted figures that match while its flag is 0; trust the adjusted columns.
- Adjustments can be revised: the adjustment is modelled, and the DfT can update it; keep the download date with any adjusted series.
- Casualty level: the casualty file has the same adjusted columns for casualties, which is what most published KSI statistics count.
- Fatal is unaffected: deaths are defined the same way under both systems; only serious and slight move.
Internal links
- How to map UK road collisions from STATS19 in Python — the adjustment in one year
- How to map road casualty rates by local authority in Python — adjusted KSI by area
- Why do my crime counts change every time I download the data? — another series that moves under you
FAQ
Why did serious road injuries increase in my police force area?
Often because the force switched to an injury-based recording system such as CRASH, which classes more injuries as serious; check collision_injury_based by year.
How do I make STATS19 serious injury counts comparable over time?
Use collision_adjusted_severity_serious (or the casualty-level equivalent) and sum it, adding fatal collisions for KSI.
How big is the effect of switching to CRASH?
For Avon and Somerset, which switched in 2025, the recorded KSI share rose from 16.9% to 29.6% of collisions while the adjusted share stayed near 30%.
Can the adjustment lower serious counts?
Yes, for some forces recording by officer judgement the adjusted share is below the recorded one.