
Why Are My Crashes on the Wrong Day of the Week?
On this page
Problem statement
You chart fatal crashes by day of the week and Monday comes out as one of the worst days, nearly as bad as the weekend. It is not. Crash datasets code the weekday as a number, and both FARS and STATS19 start their week on Sunday: 1 is Sunday, 7 is Saturday. Python starts on Monday: pandas' dayofweek is 0 for Monday, and isoweekday is 1 for Monday. Map one convention onto the other and every crash moves one day, so Sunday's crashes are labelled Monday and Saturday's Sunday, with no error and a plausible-looking chart.
This page checks the weekday codes of FARS 2023 and STATS19 2023 against their own dates, shows the chart that the off-by-one produces, and recomputes the weekday from the date, which removes the question entirely.
Quick answer
Compute the weekday from the date instead of trusting a code, or check the code against it:
A["weekday"] = A.date.dt.day_name()
check = pd.crosstab(A.DAY_WEEK, A.weekday)
print(check[["Sunday", "Monday", "Saturday"]].to_string())
print(f"FARS DAY_WEEK 1 is {list(A[A.DAY_WEEK == 1].weekday.unique())}; 7 is {list(A[A.DAY_WEEK == 7].weekday.unique())}")
weekday Sunday Monday Saturday
DAY_WEEK
1 6054 0 0
2 0 4872 0
3 0 0 0
4 0 0 0
5 0 0 0
6 0 0 0
7 0 0 6600
FARS DAY_WEEK 1 is ['Sunday']; 7 is ['Saturday']
Every crash coded 1 fell on a Sunday and every crash coded 7 on a Saturday: the code is consistent, just Sunday-first.
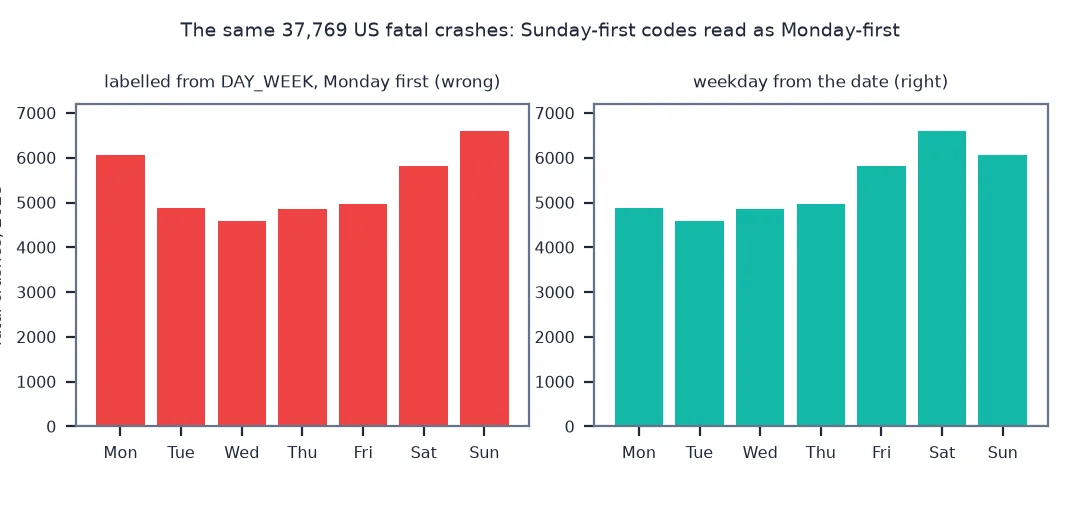
See the wrong chart, check STATS19, look at weekends
1. See the wrong chart
A list of names starting on Monday, indexed by the FARS code, labels every day wrongly:
WRONG = dict(zip(range(1, 8), ["Monday", "Tuesday", "Wednesday", "Thursday", "Friday", "Saturday", "Sunday"]))
wrong = A.DAY_WEEK.map(WRONG).value_counts()
right = A.weekday.value_counts()
order = ["Monday", "Tuesday", "Wednesday", "Thursday", "Friday", "Saturday", "Sunday"]
print(pd.DataFrame({"labelled from the code, Monday first": wrong, "from the date": right}).loc[order].to_string())
labelled from the code, Monday first from the date
Monday 6054 4872
Tuesday 4872 4592
Wednesday 4592 4854
Thursday 4854 4974
Friday 4974 5823
Saturday 5823 6600
Sunday 6600 6054
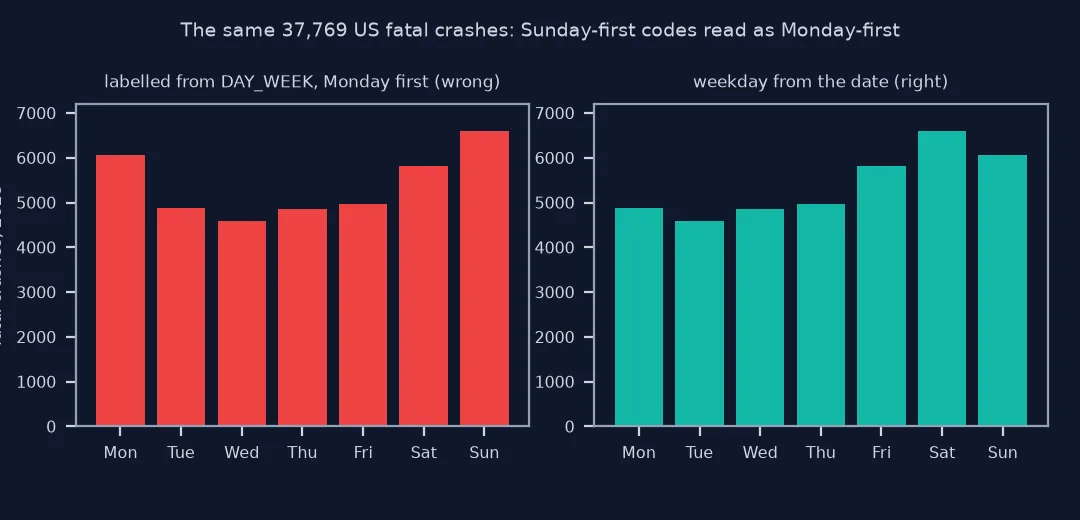
Labelled Monday-first, Monday gets Sunday's 6,054 crashes and becomes the third-worst day; the real Monday, with 4,872, is the second-quietest. Every bar is one day out, and nothing in the chart looks wrong.
2. Check STATS19 the same way
STATS19's day_of_week uses the same convention, and its dates are written day first:
S["d"] = pd.to_datetime(S.date, format="%d/%m/%Y")
print(pd.crosstab(S.day_of_week, S.d.dt.day_name())[["Sunday", "Monday", "Saturday"]].to_string())
d Sunday Monday Saturday
day_of_week
1 11699 0 0
2 0 14288 0
3 0 0 0
4 0 0 0
5 0 0 0
6 0 0 0
7 0 0 14182
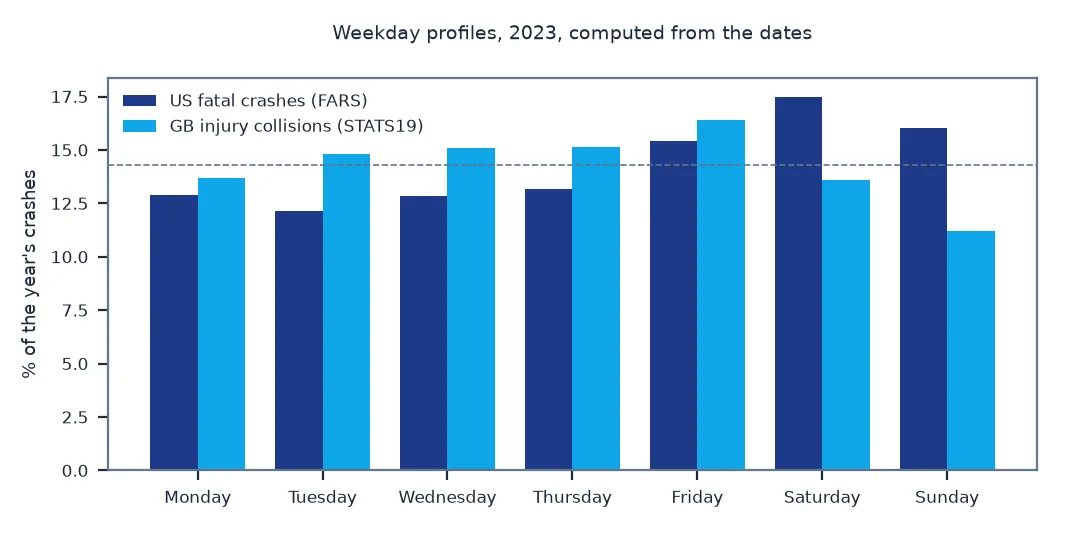
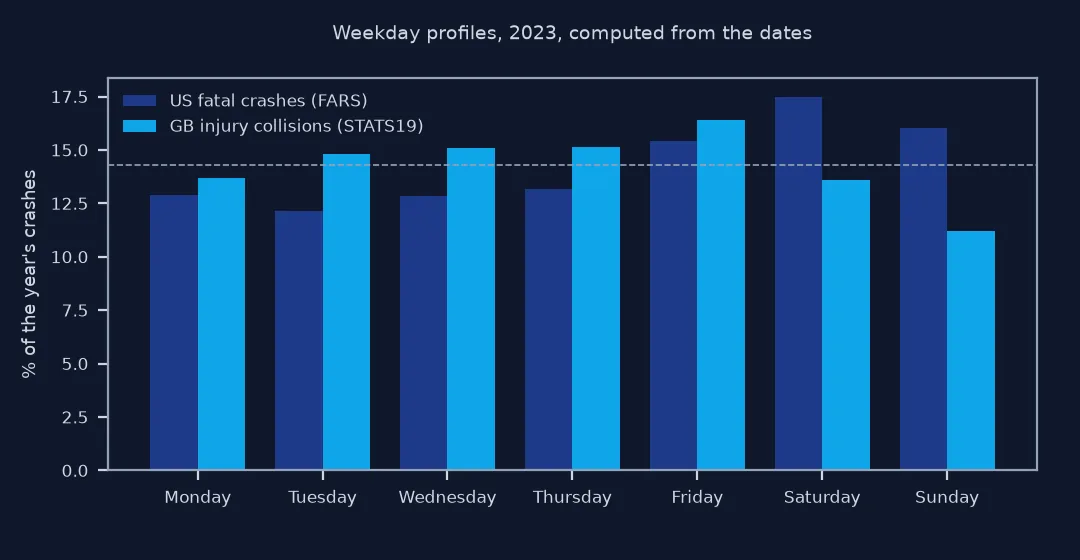
STATS19 codes 1 for Sunday and 7 for Saturday too. Its injury collisions have a different weekly shape from US fatal crashes: 14,288 on Mondays against 11,699 on Sundays.
3. Look at the weekend properly
With correct labels, the busiest days for fatal crashes are Saturday and Sunday, and Monday is among the quietest:
r = right.loc[order]
print(r.to_string())
print(f"weekend share of fatal crashes: {(r['Saturday'] + r['Sunday']) / r.sum():.1%} (two days in seven: {2 / 7:.1%})")
weekday
Monday 4872
Tuesday 4592
Wednesday 4854
Thursday 4974
Friday 5823
Saturday 6600
Sunday 6054
weekend share of fatal crashes: 33.5% (two days in seven: 28.6%)
With the right labels, Saturday and Sunday hold 33.5% of fatal crashes, against 28.6% for two days in seven; Tuesday is the quietest day.
Three Python weekday conventions
The data used on this page
NHTSA's FARS 2023 crash file and the Department for Transport's STATS19 2023 collision file.
import zipfile
from pathlib import Path

import pandas as pd
import requests

Path("data").mkdir(exist_ok=True)
SRC = {"FARS2023NationalCSV.zip": "https://static.nhtsa.gov/nhtsa/downloads/FARS/2023/National/FARS2023NationalCSV.zip",
       "dft-road-casualty-statistics-collision-2023.csv": "https://data.dft.gov.uk/road-accidents-safety-data/dft-road-casualty-statistics-collision-2023.csv"}
for name, url in SRC.items():
    if not Path("data", name).exists():
        Path("data", name).write_bytes(requests.get(url, timeout=600).content)
A = pd.read_csv(zipfile.ZipFile("data/FARS2023NationalCSV.zip").open("FARS2023NationalCSV/accident.csv"), encoding="latin1", low_memory=False,
                usecols=["ST_CASE", "YEAR", "MONTH", "DAY", "DAY_WEEK", "HOUR"])
A["date"] = pd.to_datetime(dict(year=A.YEAR, month=A.MONTH, day=A.DAY))
S = pd.read_csv("data/dft-road-casualty-statistics-collision-2023.csv", low_memory=False, usecols=["collision_index", "date", "day_of_week", "time"])
print(f"FARS: {len(A):,} crashes, {(A.HOUR == 99).sum()} with an unknown hour; STATS19: {len(S):,} collisions, {S.time.isna().sum()} without a time")
FARS: 37,769 crashes, 271 with an unknown hour; STATS19: 104,258 collisions, 0 without a time
Example 1: the three Python conventions
pandas and the standard library number weekdays in three ways; only an explicit name avoids confusion:
d = pd.Timestamp("2023-01-01")                                         # a Sunday
print(f"{d:%A}: dayofweek {d.dayofweek}, isoweekday {d.isoweekday()}, strftime %w {d:%w}, FARS-style {(d.dayofweek + 1) % 7 + 1}")
print(f"FARS code from pandas: (dayofweek + 1) % 7 + 1 matches DAY_WEEK for {(((A.date.dt.dayofweek + 1) % 7 + 1) == A.DAY_WEEK).mean():.1%} of crashes")
Sunday: dayofweek 6, isoweekday 7, strftime %w 0, FARS-style 1
FARS code from pandas: (dayofweek + 1) % 7 + 1 matches DAY_WEEK for 100.0% of crashes
The same Sunday is 6 in pandas' dayofweek, 7 in isoweekday, 0 in %w and 1 in FARS; (dayofweek + 1) % 7 + 1 converts pandas to FARS exactly.
No single weekday numbering
There is no single convention for numbering weekdays. ISO 8601, which Python's isoweekday follows, counts Monday as 1 and Sunday as 7; pandas' dayofweek counts Monday as 0; C's %w and the US habit of a Sunday-first calendar count Sunday as 0 or 1. FARS and STATS19 both use 1 for Sunday. Each is internally consistent, and an analysis that crosses them without checking shifts every weekday by one.
The error survives because it produces a believable chart. Fatal crashes peak at the weekend; shifted by a day, they peak on Sunday and Monday, and a story about Monday-morning drivers writes itself. The cure is to stop translating codes: compute the weekday from the date, which every crash dataset has, or at least cross-tabulate the code against the computed weekday once, as here. The same habit applies to months that start at 0 in some libraries and to hours where midnight may be 0 or 24.
Unknown hours, day-first dates and night crashes
- Unknown hours: FARS uses 99 for an unknown hour, 271 crashes in 2023; drop them before counting by hour, or the 24 hours will not add up to the total.
- Dates without times: weekday from a date is safe; weekday from a timestamp needs the right time zone near midnight.
- Day-first dates: STATS19 writes dates as day/month/year; pass
format="%d/%m/%Y"or months and days swap for the first twelve days of each month. - Night crashes: a crash at 01:00 on Saturday is a Friday-night crash in most people's minds; define "night of" separately if that matters.
- Labels in the data: FARS files include
DAY_WEEKNAMEbeside the code; use it when present.
Internal links
- How to analyse crime by hour and day of week in Python — weekday patterns in crime data
- How to estimate alcohol-impaired road deaths with FARS in Python — a weekday-by-hour heat map
- How to map fatal road crashes in the US with FARS in Python — the FARS crash file
FAQ
What does DAY_WEEK 1 mean in FARS?
Sunday; 7 is Saturday. STATS19's day_of_week uses the same convention.
Why does Monday look like a bad day for crashes in my chart?
Probably because the codes were labelled Monday-first; FARS's Sunday crashes, code 1, then appear as Monday.
How do I get the weekday from a date in pandas?
Use df.date.dt.day_name() for a label, or dt.dayofweek, where Monday is 0 and Sunday 6.
Which day has the most fatal crashes?
In FARS 2023, Saturday, followed by Sunday; the weekend holds about a third of fatal crashes.