
How to Map Fatal Road Crashes in the US with FARS in Python
On this page
Problem statement
The Fatality Analysis Reporting System (FARS) is the US census of fatal road crashes: every crash on a public road in which someone died within 30 days, with dozens of variables about the crash, the vehicles and the people. NHTSA publishes it each year as a set of linked CSV files. Getting from the download to a map takes reading the right file, telling crashes from deaths, recognising the codes FARS uses for missing values, and choosing a denominator before comparing states.
This page downloads the FARS 2023 national file, counts crashes and deaths, removes the coded-missing coordinates, maps the crashes, and computes deaths per 100,000 residents by state with the Census Bureau's 2023 population estimates.
Quick answer
Read accident.csv from the zip, one row per crash, and sum FATALS for deaths:
A = pd.read_csv(Z.open("FARS2023NationalCSV/accident.csv"), encoding="latin1", low_memory=False)
print(f"{len(A):,} fatal crashes, {A.FATALS.sum():,} deaths in {A.STATE.nunique()} states and DC")
by_state = A.groupby("STATENAME").FATALS.sum().sort_values(ascending=False)
print(by_state.head(4).to_string())
37,769 fatal crashes, 41,025 deaths in 51 states and DC
STATENAME
Texas 4294
California 4169
Florida 3375
Georgia 1610
FARS 2023 records 37,769 fatal crashes in which 41,025 people died. Texas and California each lost over 4,000 people, Florida 3,375; the counts follow population and miles driven as much as risk.
Crashes, vehicles and people, coded-missing points, state rates
1. Crashes, vehicles and people
FARS has one file per level: accident.csv for crashes, vehicle.csv for vehicles, person.csv for every person involved, killed or not. Deaths are a field on the crash and a code on each person:
print(f"crashes with more than one death: {(A.FATALS > 1).sum():,} ({(A.FATALS > 1).mean():.1%}); most in one crash: {A.FATALS.max()}")
P = pd.read_csv(Z.open("FARS2023NationalCSV/person.csv"), encoding="latin1", low_memory=False, usecols=["ST_CASE", "INJ_SEV", "PER_TYP"])
print(f"people in person.csv: {len(P):,}; coded as killed (INJ_SEV 4): {(P.INJ_SEV == 4).sum():,}")
crashes with more than one death: 2,641 (7.0%); most in one crash: 8
people in person.csv: 92,768; coded as killed (INJ_SEV 4): 41,025
7.0% of crashes killed more than one person, up to eight in one crash. The person file lists 92,768 people involved, of whom 41,025 are coded as killed, matching the crash file's total exactly.
2. Remove coded-missing coordinates
FARS writes missing coordinates as codes, not blanks. Some of them, such as a latitude of 77.7777, are valid numbers:
codes_lat, codes_lon = {77.7777, 88.8888, 99.9999}, {777.7777, 888.8888, 999.9999}
bad = A.LATITUDE.isin(codes_lat) | A.LONGITUD.isin(codes_lon)
print(f"crashes with coded coordinates: {bad.sum()} ({bad.mean():.2%}); of those with latitude under 90: {(bad & (A.LATITUDE < 90)).sum()}")
PTS = gpd.GeoDataFrame(A[~bad], geometry=gpd.points_from_xy(A.LONGITUD[~bad], A.LATITUDE[~bad]), crs=4326)
print(f"mappable crashes: {len(PTS):,}; latitude {PTS.LATITUDE.min():.1f} to {PTS.LATITUDE.max():.1f}")
crashes with coded coordinates: 129 (0.34%); of those with latitude under 90: 93
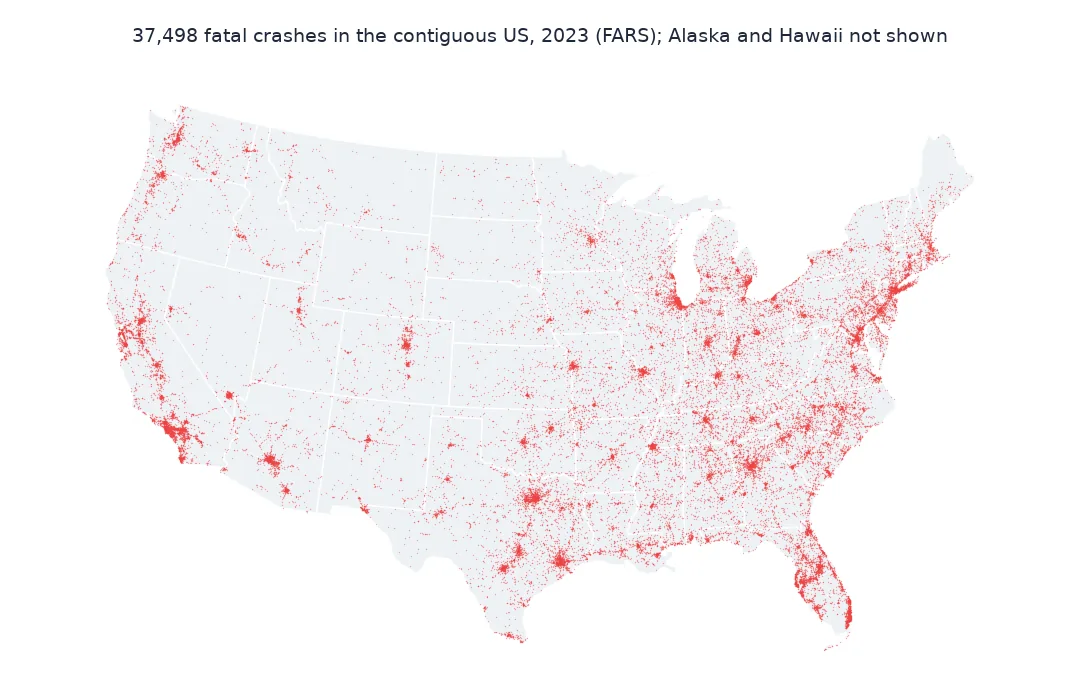
mappable crashes: 37,640; latitude 19.1 to 64.9
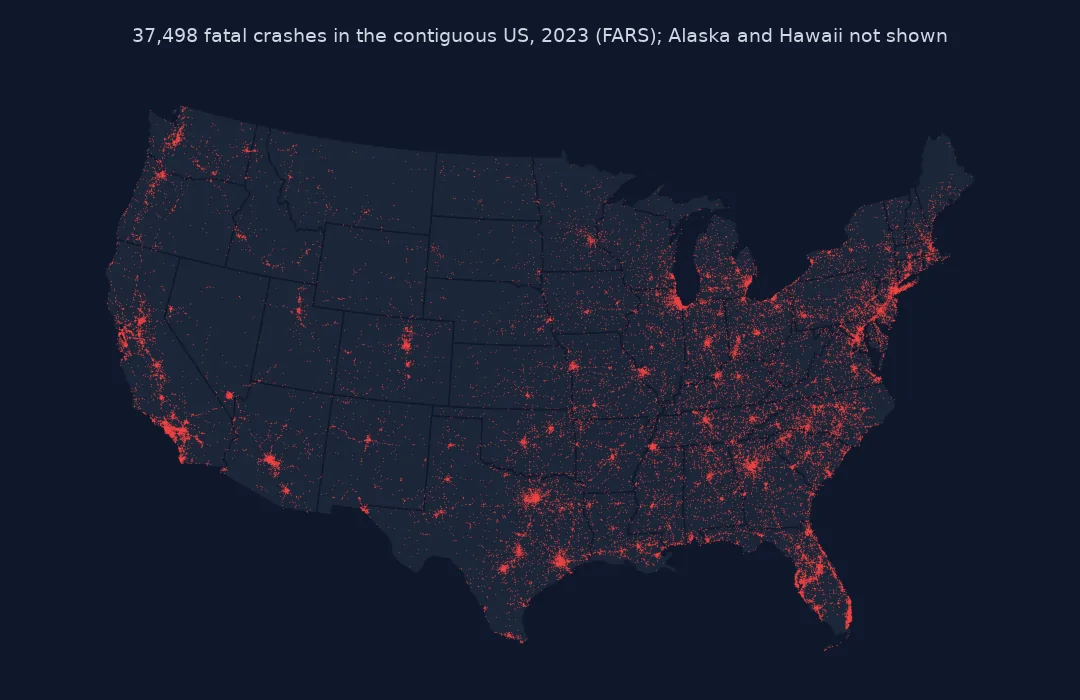
129 crashes, 0.34%, carry coded coordinates. 93 of them have a latitude below 90, 77.7777 or 88.8888, which a range check would accept and a map would put in the Arctic Ocean. With all codes removed, the 37,640 mappable crashes run from Hawaii at 19.1°N to Alaska at 64.9°N.
3. Deaths per 100,000 residents by state
Join the Census Bureau's 2023 resident population estimates on the state FIPS code:
deaths = A.groupby("STATE").FATALS.sum()
pop = POP.set_index("STATE").POPESTIMATE2023
S = pd.DataFrame({"state": POP.set_index("STATE").NAME, "deaths": deaths, "residents": pop}).dropna().astype({"deaths": int})
S["per_100k"] = S.deaths / S.residents * 1e5
print(f"US: {S.deaths.sum() / S.residents.sum() * 1e5:.1f} deaths per 100,000")
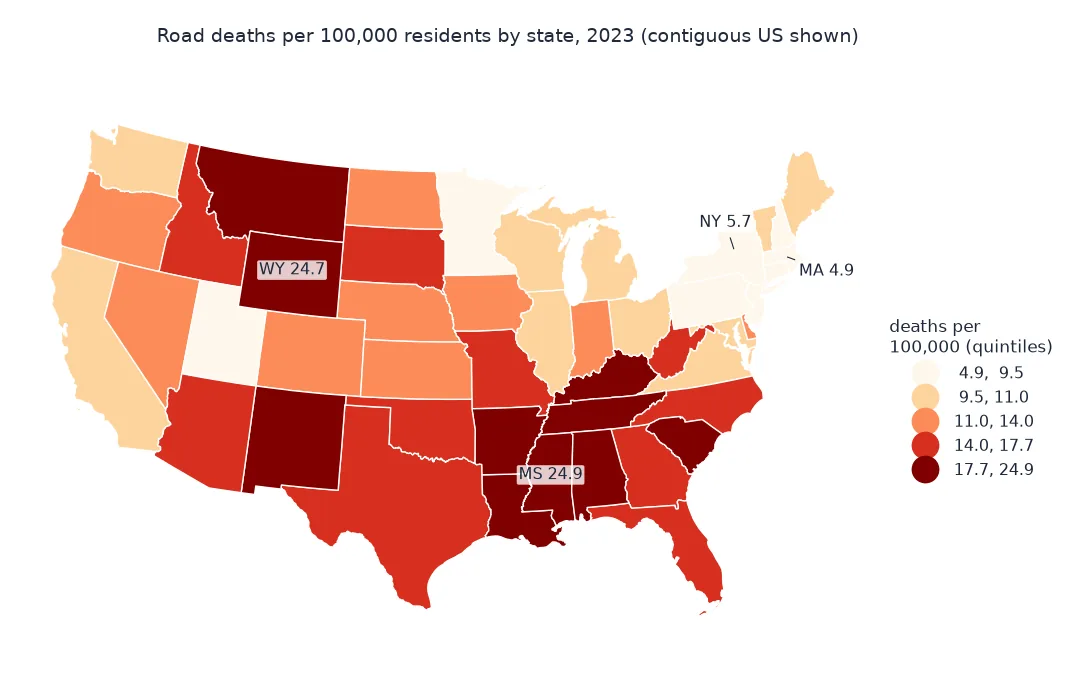
print(S.sort_values("per_100k", ascending=False).iloc[[0, 1, 2, -3, -2, -1]][["state", "deaths", "per_100k"]].round(1).to_string(index=False))
US: 12.2 deaths per 100,000
state deaths per_100k
Mississippi 733 24.9
Wyoming 144 24.7
New Mexico 440 20.8
Rhode Island 71 6.5
New York 1117 5.7
Massachusetts 342 4.9
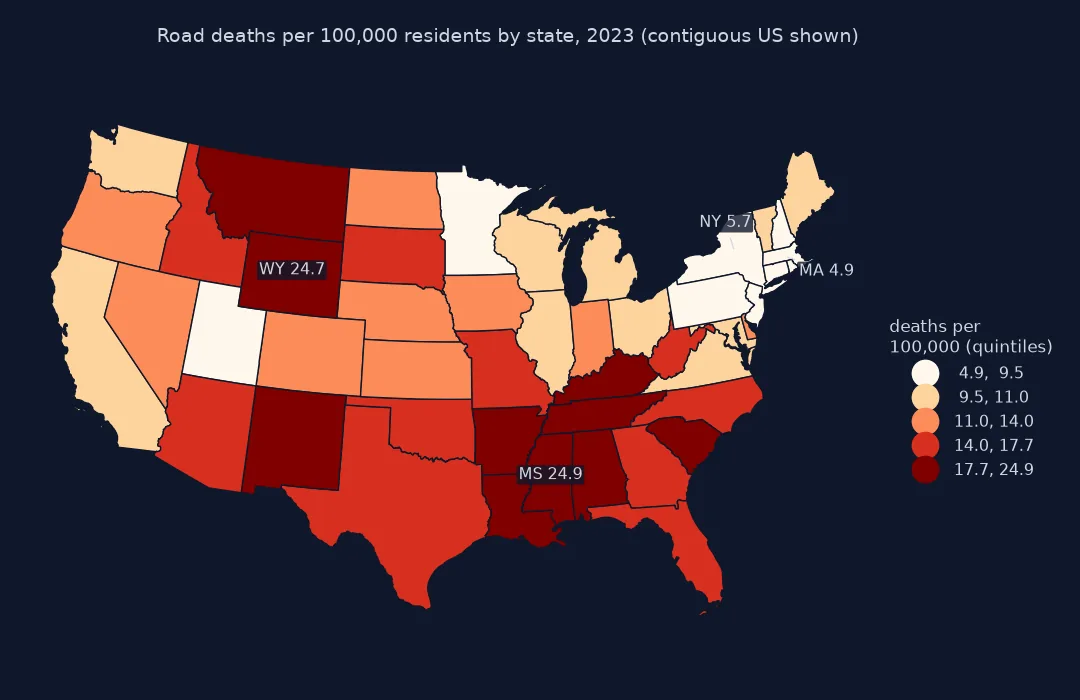
The US rate is 12.2 deaths per 100,000 residents. Mississippi and Wyoming are highest at about 25, five times Massachusetts at 4.9; New York, with 1,117 deaths, has the second-lowest rate.
When fatal crashes happen
The data used on this page
NHTSA's Fatality Analysis Reporting System 2023 national CSV file, and the Census Bureau's state population estimates (NST-EST2023-ALLDATA), vintage 2023. The FARS file covers the 50 states and the District of Columbia.
import zipfile
from pathlib import Path

import geopandas as gpd
import pandas as pd
import requests

Path("data").mkdir(exist_ok=True)
SRC = {"FARS2023NationalCSV.zip": "https://static.nhtsa.gov/nhtsa/downloads/FARS/2023/National/FARS2023NationalCSV.zip",
       "NST-EST2023-ALLDATA.csv": "https://www2.census.gov/programs-surveys/popest/datasets/2020-2023/state/totals/NST-EST2023-ALLDATA.csv"}
for name, url in SRC.items():
    if not Path("data", name).exists():
        Path("data", name).write_bytes(requests.get(url, timeout=600).content)
Z = zipfile.ZipFile("data/FARS2023NationalCSV.zip")
POP = pd.read_csv("data/NST-EST2023-ALLDATA.csv")
POP = POP[POP.SUMLEV == 40]                                             # states, DC and Puerto Rico
print(f"{len(Z.namelist()) - 1} files in the FARS zip; {len(POP)} state-level population rows")
33 files in the FARS zip; 52 state-level population rows
Example 1: when fatal crashes happen
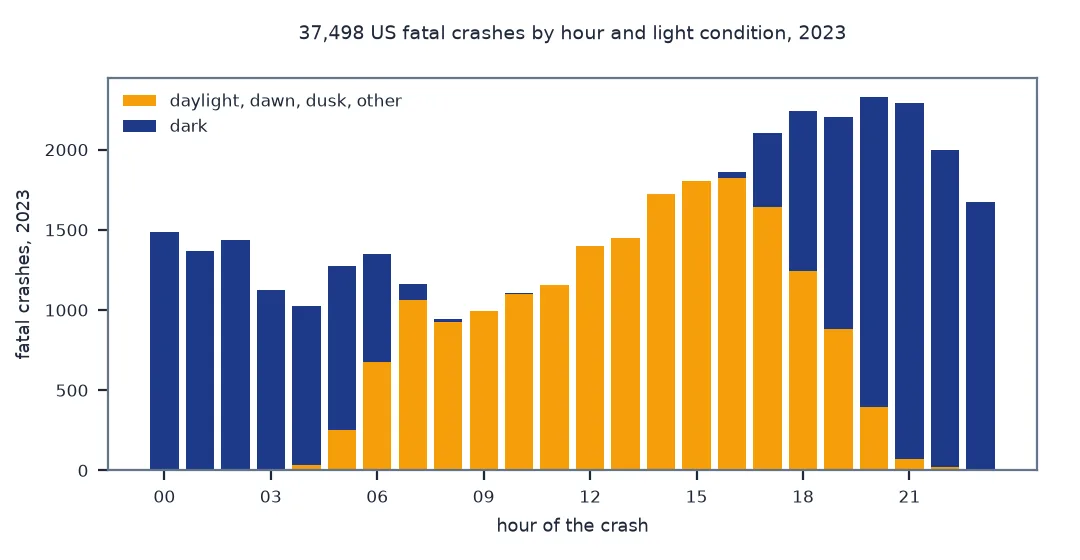
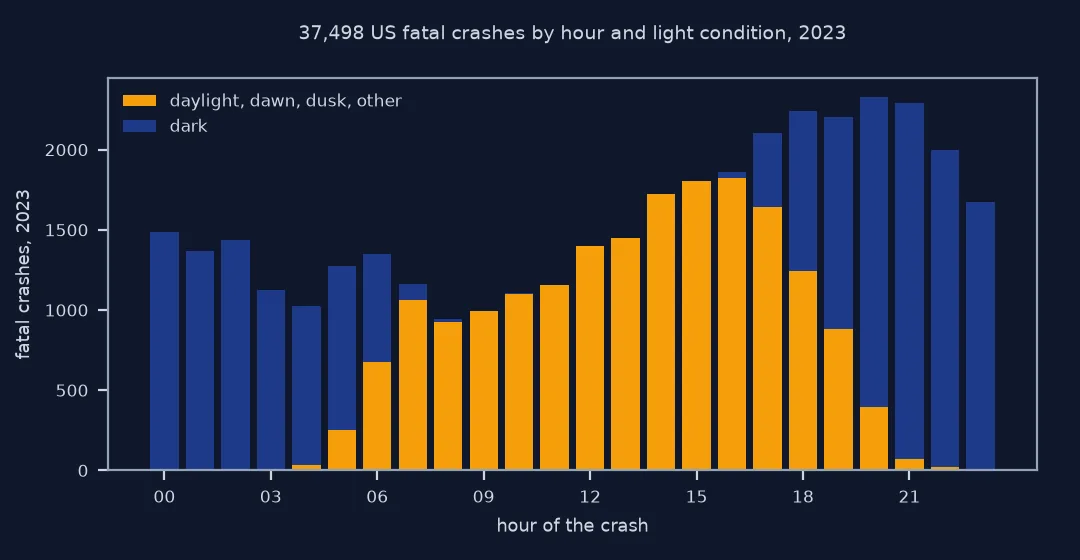
The crash file carries the hour and the light condition. Count crashes by both:
known = A[A.HOUR < 24]
dark = known.LGT_CONDNAME.str.startswith("Dark")
print(f"crashes with a known hour: {len(known):,} of {len(A):,}")
print(f"in the dark: {dark.mean():.1%}; peak hour: {known.HOUR.value_counts().idxmax():02d}:00; "
      f"quietest: {known.HOUR.value_counts().idxmin():02d}:00")
print(known.LGT_CONDNAME.value_counts().head(4).to_string())
crashes with a known hour: 37,498 of 37,769
in the dark: 50.2%; peak hour: 20:00; quietest: 08:00
LGT_CONDNAME
Daylight 16820
Dark - Not Lighted 10150
Dark - Lighted 8240
Dusk 980
Half of fatal crashes, 50.2%, happened in the dark, 10,150 of them on unlit roads. The peak hour is 20:00 and the quietest 08:00.
FARS is a census, not a sample
FARS is a census, not a sample: analysts in every state code each fatal crash from police reports, death certificates, medical records and other sources, to a common manual. That makes it the most complete national crash record anywhere, and also explains its quirks. It counts only crashes in which someone died within 30 days, on a public road, involving a motor vehicle in transport; it records missing values as codes defined in the manual, which differ by variable; and its files are revised between the first release and the final one.
Deaths per resident is the simplest rate, and it is useful for public health comparisons, but it mixes risk with exposure. States where people drive long distances on rural roads have more deaths per resident partly because they drive more. Deaths per 100 million vehicle miles travelled is the standard exposure-based rate; the two rankings differ, and which one answers a question depends on whether it is about people or about roads.
Name columns, encoding and release versions
- Name columns: recent FARS CSVs include a
...NAMEcolumn beside each coded one, such asSTATENAMEandLGT_CONDNAME; older years have only the codes. - Encoding: the files use Latin-1, not UTF-8; city names with accents fail to decode otherwise.
- Unknown hour:
HOUR99 means unknown; filter it before counting by hour. - Puerto Rico: Puerto Rico crashes are not in the national file, although the Census file has a Puerto Rico row; join on the states in FARS.
- Release versions: each year appears first as an annual report file and later as a final file; totals change slightly between them.
Internal links
- How to calculate crime rates per resident in Python — rates and denominators
- How to analyse crime by hour and day of week in Python — counting by hour
FAQ
How do I download FARS data in Python?
Download the national CSV zip for a year from static.nhtsa.gov/nhtsa/downloads/FARS/<year>/National/, open it with zipfile, and read accident.csv with encoding="latin1".
How many people died in US road crashes in 2023?
The FARS 2023 national file as downloaded for this page records 41,025 deaths in 37,769 crashes.
What do 77.7777 and 99.9999 mean in FARS coordinates?
They are codes for missing locations, not places; latitude codes 77.7777 and 88.8888 are valid numbers, so filter the codes explicitly.
Which state has the most road deaths per person?
In 2023, Mississippi had the highest rate, as computed on this page from FARS deaths and Census population estimates.