
How to Analyse Speeding-Related Crashes with FARS in Python
On this page
Problem statement
Speed is named in a large share of fatal crashes, but "speeding" in crash data is not a measured speed. FARS records, for each vehicle, whether the police report says the driver was speeding: exceeding the limit, going too fast for conditions, racing, or speeding with no detail. The actual travel speed is recorded for a minority of vehicles. Analysing speeding therefore means working at the vehicle level, rolling up to crashes, and being clear that the measure is an officer's judgement written into a report.
This page uses the FARS 2023 vehicle file to flag speeding-related vehicles and crashes, counts the deaths in those crashes, splits them by road type, links drivers' ages from the person file, and checks how often a travel speed was recorded at all.
Quick answer
Flag vehicles with SPEEDREL 2 to 5, and call a crash speeding-related if any of its vehicles is:
V["speeding"] = V.SPEEDREL.isin([2, 3, 4, 5])                          # too fast for conditions, over the limit, racing, unspecified
crash_speeding = V.groupby("ST_CASE").speeding.any()
A["speeding"] = A.ST_CASE.map(crash_speeding).fillna(False).astype(bool)
print(f"speeding-related crashes: {A.speeding.sum():,} of {len(A):,}; deaths in them: {A.FATALS[A.speeding].sum():,} ({A.FATALS[A.speeding].sum() / A.FATALS.sum():.1%})")
print(V.SPEEDRELNAME[V.speeding].value_counts().to_string())
speeding-related crashes: 10,657 of 37,769; deaths in them: 11,913 (29.0%)
SPEEDRELNAME
Yes, Too Fast for Conditions 4555
Yes, Exceeded Speed Limit 4115
Yes, Specifics Unknown 2043
Yes, Racing 145
10,657 of 2023's 37,769 fatal crashes, 28%, had at least one driver coded as speeding, and 11,913 people died in them, 29.0% of all deaths. Too fast for conditions is the most common code, ahead of exceeding the limit.
Kinds of speeding, road types, driver ages
1. See what kind of speeding
The four "yes" codes mean different things: too fast for conditions can be below the limit on a wet road. Count vehicles by code, and how many have no answer:
print(V.SPEEDRELNAME.value_counts().to_string())
unknown = V.SPEEDRELNAME.isin(["Reported as Unknown", "No Driver Present/Unknown if Driver Present"])
print(f"vehicles with no usable answer: {unknown.mean():.1%}")
SPEEDRELNAME
No 43971
Yes, Too Fast for Conditions 4555
Yes, Exceeded Speed Limit 4115
Reported as Unknown 3313
Yes, Specifics Unknown 2043
No Driver Present/Unknown if Driver Present 366
Yes, Racing 145
vehicles with no usable answer: 6.3%
6.3% of vehicles have no usable answer, which the crash-level flag treats as not speeding; the share of speeding-related deaths is a floor in that sense.
2. Speeding by road type
Join the crash's functional class and compare the share of deaths in speeding-related crashes:
by_road = A.groupby("FUNC_SYSNAME").apply(lambda d: pd.Series({"deaths": d.FATALS.sum(), "speeding_share": d.FATALS[d.speeding].sum() / d.FATALS.sum()}),
                                          include_groups=False)
print(by_road[by_road.deaths >= 1000].sort_values("speeding_share", ascending=False).round(3).to_string())
deaths speeding_share
FUNC_SYSNAME
Local 4133.0 0.362
Minor Collector 1257.0 0.356
Major Collector 6711.0 0.317
Other Freeways and Expressways 1651.0 0.311
Interstate 5236.0 0.279
Minor Arterial 9374.0 0.276
Other Principal Arterial 12378.0 0.257
Speeding is coded most often on local roads and minor collectors, 36% of deaths, and least on principal arterials, 26%, though those carry three times as many deaths.
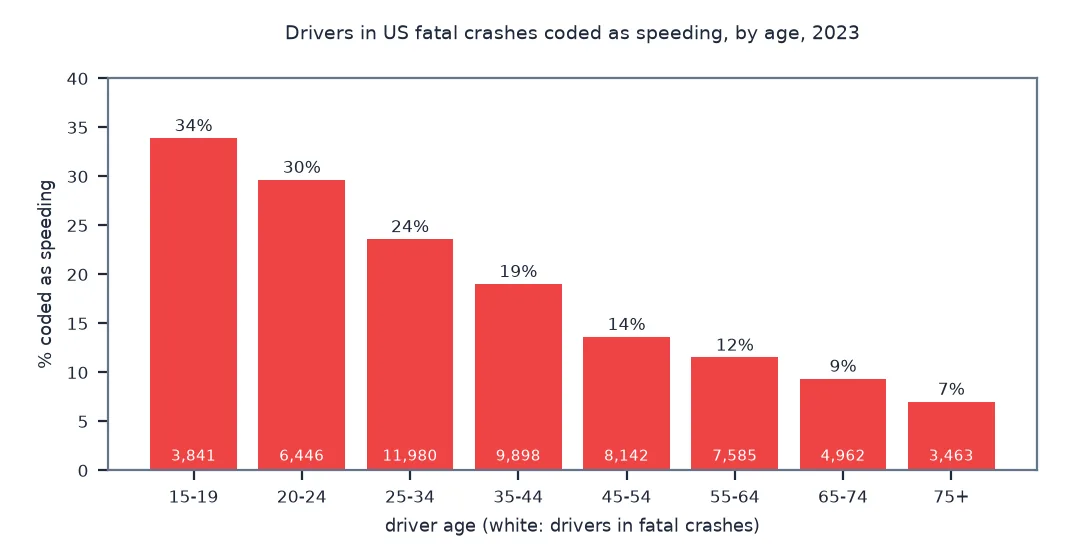
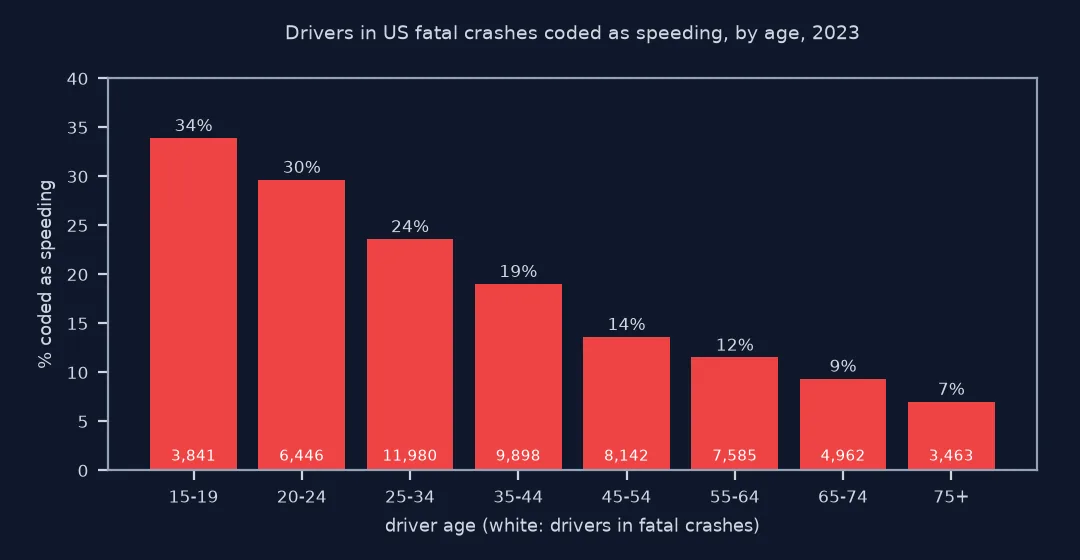
3. Speeding by driver age
Driver ages are in the person file, one row per person, with PER_TYP 1 for drivers; join on crash and vehicle number:
d = V.merge(P[P.PER_TYP == 1][["ST_CASE", "VEH_NO", "AGE"]], on=["ST_CASE", "VEH_NO"], how="inner")
d = d[d.AGE < 998]
bands = pd.cut(d.AGE, [15, 20, 25, 35, 45, 55, 65, 75, 100], right=False)
print(d.groupby(bands, observed=True).speeding.agg(["size", "mean"]).rename(columns={"size": "drivers", "mean": "speeding"}).round(3).to_string())
drivers speeding
AGE
[15, 20) 3841 0.339
[20, 25) 6446 0.297
[25, 35) 11980 0.236
[35, 45) 9898 0.190
[45, 55) 8142 0.136
[55, 65) 7585 0.115
[65, 75) 4962 0.094
[75, 100) 3463 0.070
The share falls steadily with age, from 33.9% of drivers aged 15 to 19 to 7.0% of those 75 and over.
How often a speed was recorded
The data used on this page
NHTSA's FARS 2023 national file: vehicle.csv (speeding, travel speed, posted limit, driver drinking), accident.csv and person.csv.
import zipfile
from pathlib import Path

import pandas as pd
import requests

Path("data").mkdir(exist_ok=True)
F = Path("data/FARS2023NationalCSV.zip")
if not F.exists():
    F.write_bytes(requests.get("https://static.nhtsa.gov/nhtsa/downloads/FARS/2023/National/FARS2023NationalCSV.zip", timeout=600).content)
Z = zipfile.ZipFile(F)
V = pd.read_csv(Z.open("FARS2023NationalCSV/vehicle.csv"), encoding="latin1", low_memory=False,
                usecols=["ST_CASE", "VEH_NO", "SPEEDREL", "SPEEDRELNAME", "TRAV_SP", "VSPD_LIM", "DR_DRINK"])
A = pd.read_csv(Z.open("FARS2023NationalCSV/accident.csv"), encoding="latin1", low_memory=False,
                usecols=["ST_CASE", "FATALS", "FUNC_SYSNAME", "HOUR"])
P = pd.read_csv(Z.open("FARS2023NationalCSV/person.csv"), encoding="latin1", low_memory=False, usecols=["ST_CASE", "VEH_NO", "PER_TYP", "AGE"])
print(f"{len(V):,} vehicles in {len(A):,} crashes")
58,508 vehicles in 37,769 crashes
Example 1: how often a speed was recorded
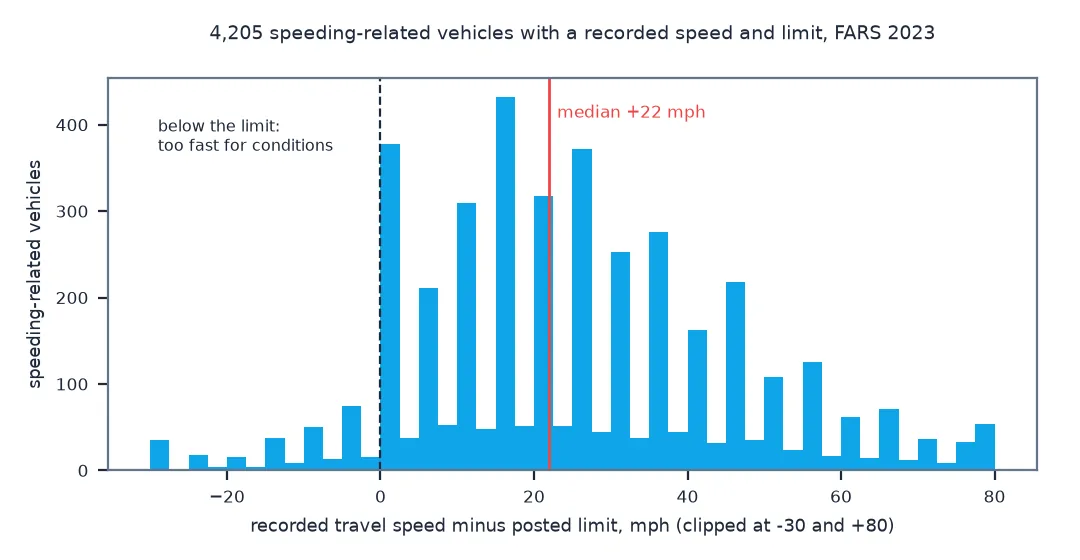
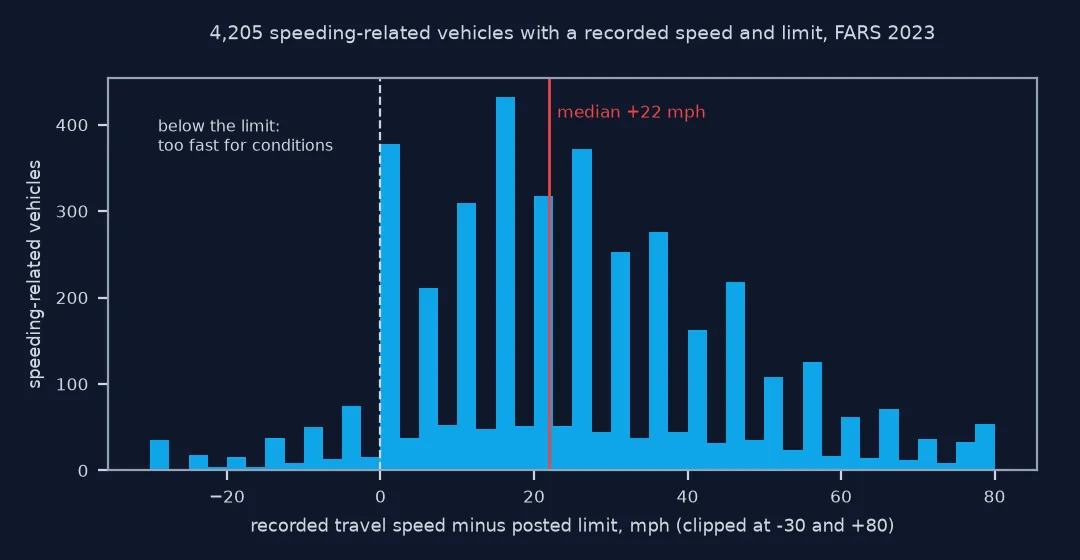
TRAV_SP is the travel speed in mph when known; 997 means over 151 mph, 998 not reported and 999 unknown:
known = V.TRAV_SP < 997
print(f"vehicles with a recorded travel speed: {known.mean():.1%}; among speeding-related vehicles: {known[V.speeding].mean():.1%}")
s = V[known & V.speeding & (V.VSPD_LIM < 98)]
print(f"speeding-related with speed and limit: {len(s):,}; median over the limit {(s.TRAV_SP - s.VSPD_LIM).median():.0f} mph")
print(f"speeding-related drivers also coded as drinking: {(V.DR_DRINK[V.speeding] == 1).mean():.1%}; other drivers: {(V.DR_DRINK[~V.speeding] == 1).mean():.1%}")
vehicles with a recorded travel speed: 38.5%; among speeding-related vehicles: 39.2%
speeding-related with speed and limit: 4,205; median over the limit 22 mph
speeding-related drivers also coded as drinking: 36.3%; other drivers: 12.7%
Only 38.5% of vehicles have a travel speed, and speeding-related ones are no better recorded, at 39.2%. Where speed and limit are both known, speeding drivers were a median 22 mph over. 36.3% of speeding drivers were also coded as drinking, against 12.7% of the rest.
Where the speeding variable comes from
FARS's speeding variable comes from the police crash report as interpreted by the FARS analyst: the officer's statement that a driver was exceeding the limit, driving too fast for conditions or racing, or a charge that implies it. It is a judgement, made after the crash, often without speed measurement. That makes it consistent enough for national comparisons and weak for fine distinctions, especially where states' report forms differ in how they ask.
Rolling up from vehicles to crashes needs a rule. Here a crash is speeding-related if any vehicle in it was, the usual convention for counting deaths in speeding-related crashes. The resulting share is about three in ten deaths, and the patterns in it are consistent: young drivers are coded as speeding far more often than older ones, and speeding overlaps with drinking. Where a travel speed is recorded, it says how far above the limit drivers were; but it is recorded for a minority of vehicles, about two in five, speeding or not.
Codes, posted limits and crash or vehicle level
- Codes:
SPEEDREL0 is no, 2–5 are the kinds of yes, 8 is no driver present and 9 is unknown; check the codes in each year's manual before stacking years. - Posted limit:
VSPD_LIM98 and 99 mean not reported and unknown. - Crash or vehicle level: a two-vehicle crash with one speeding driver counts once at crash level and once of two at vehicle level; say which.
- Too fast for conditions: this code includes speeds under the limit; "over the limit" alone is a narrower measure.
- Other years: stack several years before splitting by state or age band; single-year counts in small groups are noisy.
Internal links
- How to map fatal road crashes in the US with FARS in Python — the FARS files
- How to estimate alcohol-impaired road deaths with FARS in Python — another police-coded factor
- How to map UK road collisions from STATS19 in Python — severity by speed limit in Britain
FAQ
How do I find speeding-related crashes in FARS?
Read vehicle.csv, flag vehicles with SPEEDREL 2 to 5, and mark a crash as speeding-related if any of its vehicles is flagged.
What share of US road deaths are speeding-related?
In FARS 2023, 29.0% of deaths were in crashes where at least one driver was coded as speeding.
Does FARS record how fast vehicles were going?
Sometimes: TRAV_SP has a travel speed for a minority of vehicles; for most it is not reported.
Which drivers are most often coded as speeding?
The youngest: in 2023, a third of drivers aged 15 to 19 in fatal crashes were coded as speeding, against under one in ten of those 65 and over.