
How to Map Road Casualty Rates by Local Authority in Python
On this page
Problem statement
Local authorities in Great Britain are responsible for most roads and are compared constantly on road safety. A fair comparison needs casualties assigned to the authority where the collision happened, a population to divide by, a severity measure that is comparable across police forces, and a boundary file whose codes match. All four are open: STATS19 records the local authority of each collision, the Office for National Statistics publishes mid-year population estimates through the Nomis API, and the ONS Open Geography Portal serves the boundaries.
This page joins 2023 STATS19 casualties to their local authority, downloads 2023 population estimates from Nomis, computes casualties and adjusted killed-or-seriously-injured casualties per 100,000 residents, finds the codes that do not match, and maps the result.
Quick answer
Count casualties by the collision's local_authority_ons_district, join the Nomis population on the ONS code, and divide:
c = CAS.merge(COL[["collision_index", "local_authority_ons_district"]], on="collision_index")
c["ksi"] = (c.casualty_severity == 1) + c.casualty_adjusted_severity_serious
T = c.groupby("local_authority_ons_district").agg(casualties=("ksi", "size"), ksi=("ksi", "sum")).join(POP)
T["ksi_per_100k"] = T.ksi / T.residents * 1e5
print(f"{len(T)} authorities; Great Britain: {T.ksi.sum() / T.residents.sum() * 1e5:.1f} KSI casualties per 100,000 residents")
print(T.sort_values("ksi_per_100k", ascending=False)[["name", "residents", "ksi", "ksi_per_100k"]].head(5).round(1).to_string())
351 authorities; Great Britain: 43.5 KSI casualties per 100,000 residents
name residents ksi ksi_per_100k
local_authority_ons_district
E09000001 City of London 14514.0 45.0 310.3
E07000035 Derbyshire Dales 72027.0 88.9 123.4
E09000033 Westminster 216343.0 264.0 122.0
W06000023 Powys 134550.0 162.7 121.0
W06000008 Ceredigion 72731.0 79.5 109.3
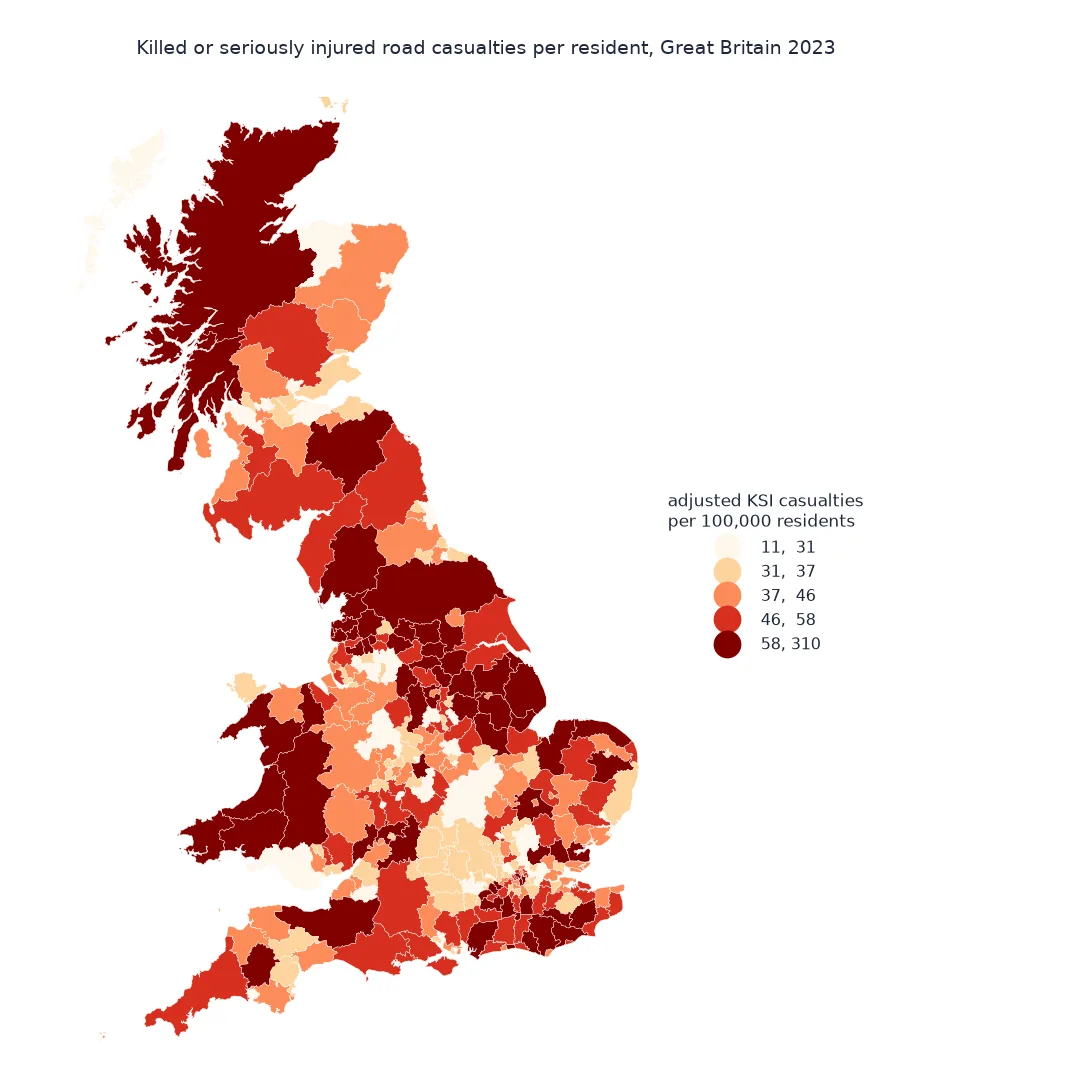
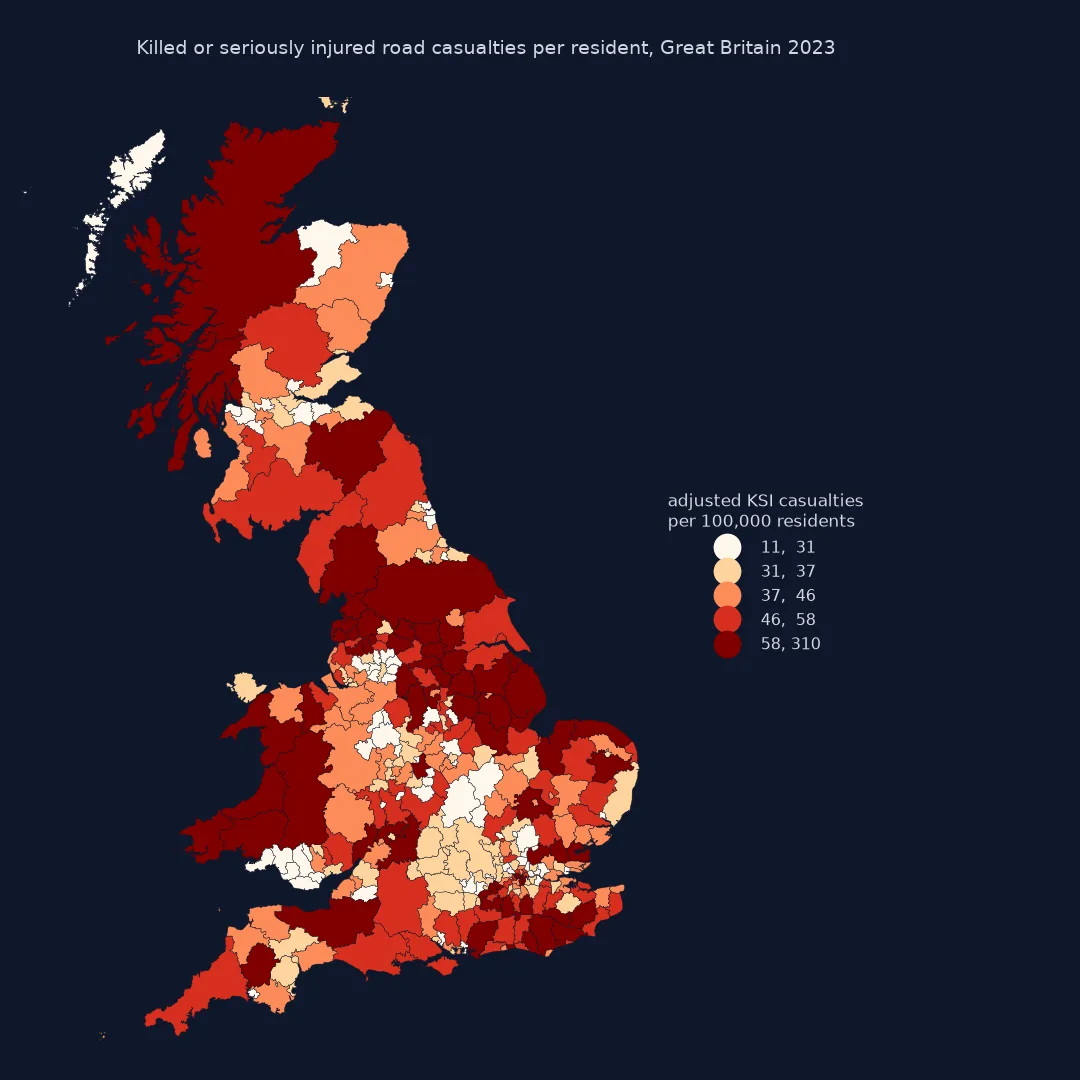
Great Britain had 43.5 adjusted KSI casualties per 100,000 residents in 2023. The City of London tops the list at 310, seven times the national rate; then come Derbyshire Dales, Westminster, Powys and Ceredigion, a mixture of central London and rural authorities.
Matching codes, extremes, urban against rural
1. Check the codes match
The collision file uses 2023 ONS local authority codes, and the population and boundary files must too. Find any code without a population:
missing = T[T.residents.isna()]
print(f"codes in STATS19 without a population: {len(missing)}")
print(missing[["casualties"]].to_string())
T = T.dropna(subset=["residents"])
print(f"boundaries: {len(LAD)}; authorities with casualties and population: {len(T)}")
codes in STATS19 without a population: 1
casualties
local_authority_ons_district
EHEATHROW 30
boundaries: 361; authorities with casualties and population: 350
One code has no population: EHEATHROW, a pseudo-authority for Heathrow Airport with 30 casualties. With it set aside, 350 authorities have both casualties and residents; the other 11 boundaries are Northern Ireland's.
2. Look at the extremes
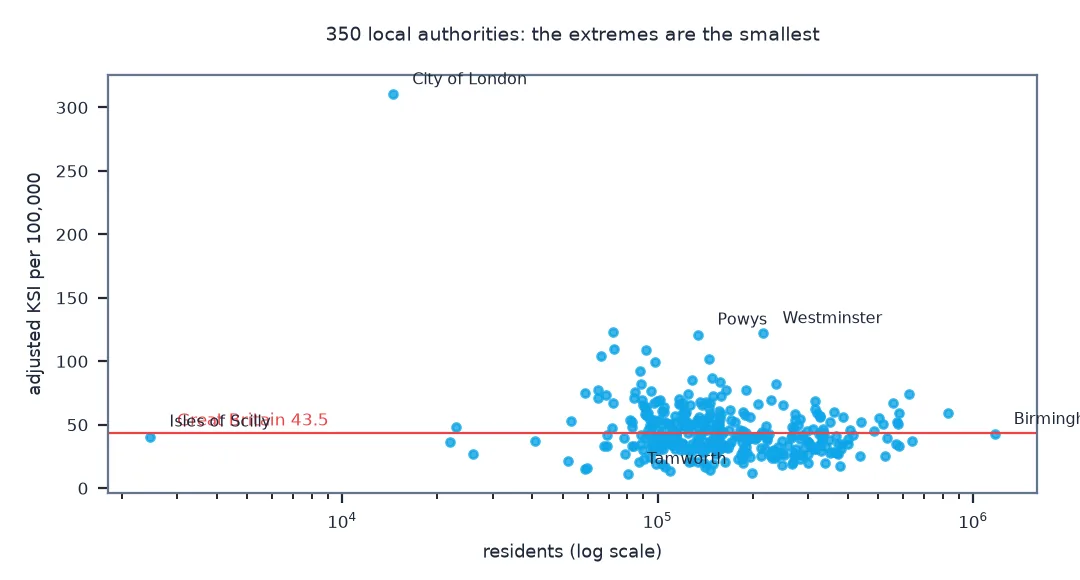
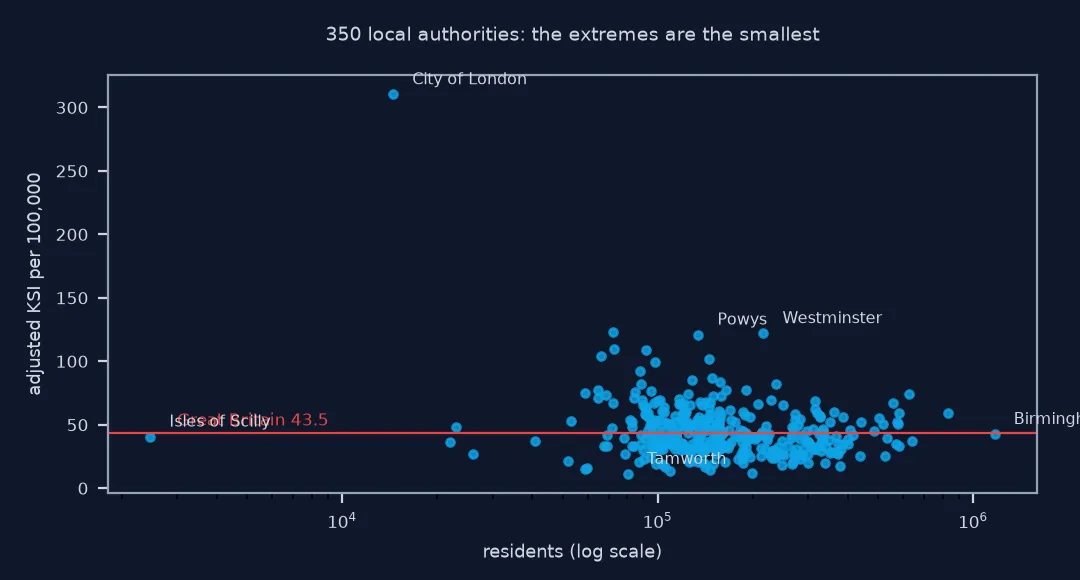
Rates in authorities with few residents and many visitors, such as the City of London, are not comparable with the rest:
print(T.sort_values("residents")[["name", "residents", "casualties", "ksi_per_100k"]].head(3).round(1).to_string())
print(T.sort_values("ksi_per_100k")[["name", "residents", "ksi", "ksi_per_100k"]].head(4).round(1).to_string())
name residents casualties ksi_per_100k
local_authority_ons_district
E06000053 Isles of Scilly 2465.0 4 40.6
E09000001 City of London 14514.0 187 310.3
S12000023 Orkney Islands 22010.0 13 36.3
name residents ksi ksi_per_100k
local_authority_ons_district
E07000199 Tamworth 80476.0 9.0 11.2
E06000022 Bath and North East Somerset 198945.0 23.5 11.8
S12000045 East Dunbartonshire 109340.0 15.0 13.7
W06000013 Bridgend 146692.0 20.7 14.1
The three smallest authorities show why rates need counts beside them: the Isles of Scilly's 40.6 rests on 4 casualties, and the City of London's 310 on a resident population of 14,514. At the other end, Tamworth, Bath and North East Somerset, East Dunbartonshire and Bridgend have rates around a third of the national one.
3. Compare urban and rural
STATS19 classifies each collision as urban or rural; the share of an authority's casualties on rural roads separates the two kinds of place:
c2 = c.merge(COL[["collision_index", "urban_or_rural_area"]], on="collision_index")
rural_share = c2.groupby("local_authority_ons_district").urban_or_rural_area.apply(lambda u: (u == 2).mean())
T["rural_share"] = rural_share
T["ksi_share"] = T.ksi / T.casualties
print(f"correlation of rural share with KSI per 100k: {T.rural_share.corr(T.ksi_per_100k):.2f}; with KSI share of casualties: {T.rural_share.corr(T.ksi_share):.2f}")
correlation of rural share with KSI per 100k: 0.24; with KSI share of casualties: 0.42
The share of an authority's casualties on rural roads correlates weakly with its KSI rate per resident, 0.24, and more strongly with the share of its casualties that are killed or seriously injured, 0.42: rural collisions are more often severe.
A casualty rate map of local authorities
The data used on this page
The Department for Transport's road safety open data for 2023, collision and casualty files; ONS mid-2023 population estimates for local authorities from the Nomis API, dataset NM_2002_1; and the ONS Local Authority Districts (December 2023) boundaries, ultra generalised.
from pathlib import Path

import geopandas as gpd
import pandas as pd
import requests

Path("data").mkdir(exist_ok=True)
BASE = "https://data.dft.gov.uk/road-accidents-safety-data/dft-road-casualty-statistics-{}-2023.csv"
for part in ("collision", "casualty"):
    f = Path(f"data/dft-road-casualty-statistics-{part}-2023.csv")
    if not f.exists():
        f.write_bytes(requests.get(BASE.format(part), timeout=600).content)
P = Path("data/nomis_lad_pop_2023.csv")
if not P.exists():
    P.write_bytes(requests.get("https://www.nomisweb.co.uk/api/v01/dataset/NM_2002_1.data.csv", timeout=120, params={
        "geography": "TYPE424", "date": "2023", "gender": "0", "c_age": "200", "measures": "20100",
        "select": "geography_code,geography_name,obs_value"}).content)
B = Path("data/lad_dec_2023_buc.geojson")
if not B.exists():
    B.write_bytes(requests.get("https://services1.arcgis.com/ESMARspQHYMw9BZ9/arcgis/rest/services/"
                               "Local_Authority_Districts_December_2023_Boundaries_UK_BUC/FeatureServer/0/query", timeout=120,
                               params={"where": "1=1", "outFields": "LAD23CD,LAD23NM", "f": "geojson", "resultRecordCount": 2000}).content)
COL = pd.read_csv("data/dft-road-casualty-statistics-collision-2023.csv", low_memory=False)
CAS = pd.read_csv("data/dft-road-casualty-statistics-casualty-2023.csv", low_memory=False)
POP = pd.read_csv(P).rename(columns={"GEOGRAPHY_CODE": "code", "GEOGRAPHY_NAME": "name", "OBS_VALUE": "residents"}).set_index("code")
LAD = gpd.read_file(B).to_crs(27700)
print(f"{len(CAS):,} casualties; {len(POP)} population rows; {len(LAD)} boundaries")
132,977 casualties; 361 population rows; 361 boundaries
Example 1: the map
Join the rates to the boundaries and draw them in classes, with Northern Ireland, which STATS19 does not cover, left out:
import matplotlib
matplotlib.use("Agg")
import matplotlib.pyplot as plt

gb = LAD[~LAD.LAD23CD.str.startswith("N")].merge(T[["ksi_per_100k"]], left_on="LAD23CD", right_index=True, how="left")
fig, ax = plt.subplots(figsize=(6, 8))
gb.plot(ax=ax, column="ksi_per_100k", scheme="Quantiles", k=5, cmap="OrRd", legend=True, edgecolor="white", linewidth=0.2)
ax.set_axis_off(); fig.savefig("ksi_by_authority.png", dpi=150)
print(f"authorities mapped: {gb.ksi_per_100k.notna().sum()} of {len(gb)}")
authorities mapped: 350 of 350
Every Great Britain authority with residents gets a rate on the map.
What a per-resident casualty rate says
A casualty rate per resident answers how many of a place's people, roughly, are hurt on its roads; it does not say who was hurt or how dangerous the roads are per journey. Casualties are assigned to the authority where the collision happened, not where the casualty lived, so authorities that draw large numbers of visitors, commuters or through traffic, from the City of London to rural authorities crossed by trunk roads, have rates inflated by people who are not residents. The casualty file's casualty_imd_decile and distance band from home give some idea of how many casualties were local.
Severity needs the same care as in any STATS19 comparison: police forces record serious injuries differently, and the adjusted severity column makes counts comparable. With adjusted KSI per 100,000 residents, authorities with more rural casualties rank somewhat higher, and their casualties are more often severe, consistent with higher speeds on rural roads; the relationship is real but loose, and central London ranks among the highest too.
Pseudo codes, boundary changes and small authorities
- Pseudo codes: STATS19 has a few codes that are not local authorities, such as one for Heathrow Airport; report and drop them.
- Boundary changes: authorities merge and split; use population and boundaries for the same vintage as the collision codes.
- Nomis geography types: Nomis has several local authority geography types for different boundary vintages; check the codes returned against the collision data.
- Small authorities: a few authorities, the City of London and the Isles of Scilly among them, have so few residents that rates per resident are meaningless; pool them or show counts.
- Exposure: DfT traffic statistics give vehicle kilometres by authority, the denominator for a per-distance rate.
Internal links
- How to map UK road collisions from STATS19 in Python — the collision file and the severity adjustment
- How to calculate crime rates per resident in Python — the same denominator problem for crime
- How to calculate road death rates per vehicle mile in Python — rates per distance driven
FAQ
How do I calculate road casualty rates by local authority in Python?
Join the STATS19 casualty file to the collision file, count casualties by local_authority_ons_district, join ONS population estimates from Nomis on the code, and divide.
Where can I get UK local authority populations in Python?
The Nomis API: https://www.nomisweb.co.uk/api/v01/dataset/NM_2002_1.data.csv with geography=TYPE424, a date, gender=0, c_age=200 and measures=20100.
Why does the City of London have such a high casualty rate?
Because 14,514 people lived there in mid-2023 while far more work in or travel through it; casualties are counted where they happen, residents where they live.
Which local authorities have the most serious road casualties per resident?
After the City of London, in 2023 they were a mix of rural authorities and central London's Westminster, by adjusted KSI per 100,000 residents.