
Gross vs Net Migration Explained
On this page
Problem statement
"Los Angeles lost 123,000 people to other counties" and "526,000 people moved between Los Angeles and other counties" are both true statements about the same five years. The first is net migration, the second gross. They answer different questions and they can point in different directions. A place can have enormous turnover and almost no net change, or a modest exchange that is almost entirely one-way. Most migration maps show net migration, because it is one number per place, and that number hides most of the movement.
This page explains the two measures and their ratio, migration efficiency. It quantifies them for every US county from the Census county-to-county flows for 2016–2020.
Quick answer
Gross migration is moves in plus moves out; net is moves in minus moves out; efficiency is net divided by gross. Compute all three per county:
by = us.groupby("geoid").agg(inflow=("flow", "sum"), outflow=("counter", "sum"))
by["gross"], by["net"] = by.inflow + by.outflow, by.inflow - by.outflow
by["efficiency"] = by.net / by.gross
print(f"{len(by):,} counties; median efficiency {by.efficiency.abs().median():.0%} "
      f"(net is typically {by.efficiency.abs().median():.0%} of the moves into and out of a county)")
print(f"nationally: {by.inflow.sum():,.0f} moves between counties, net redistribution {by.net.clip(lower=0).sum():,.0f} "
      f"({by.net.clip(lower=0).sum() / by.inflow.sum():.0%} of moves)")
3,221 counties; median efficiency 12% (net is typically 12% of the moves into and out of a county)
nationally: 18,061,885 moves between counties, net redistribution 1,844,172 (10% of moves)
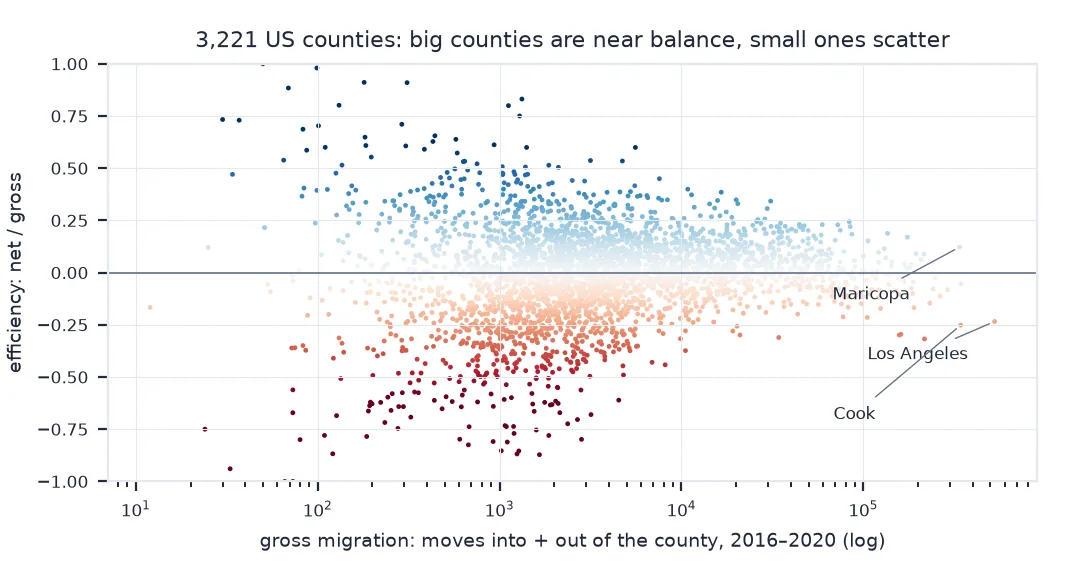
Turnover, redistribution and efficiency
1. Gross measures turnover
Gross migration counts every move into or out of a place. It is what housing markets, school districts and movers feel. Large counties have large gross flows almost by definition:
top = by.join(NAMES).nlargest(5, "gross")
print(top[["name", "gross", "net", "efficiency"]].to_string(index=False, formatters={"gross": "{:,.0f}".format,
      "net": "{:+,.0f}".format, "efficiency": "{:+.0%}".format}))
name gross net efficiency
Los Angeles County, California 526,768 -123,418 -23%
Harris County, Texas 344,753 -18,545 -5%
Cook County, Illinois 343,010 -86,230 -25%
Maricopa County, Arizona 338,342 +41,348 +12%
San Diego County, California 289,931 -23,739 -8%
2. Net measures redistribution
Net migration is what remains when moves in and out cancel. Summed over all counties it is zero, because every out-move is someone else's in-move. Only the positive part, the people a growing county gains, measures how much the country's population is redistributed:
print(f"sum of all county nets: {by.net.sum():+,.0f}; sum of gains {by.net.clip(lower=0).sum():,.0f} = sum of losses {-by.net.clip(upper=0).sum():,.0f}")sum of all county nets: +0; sum of gains 1,844,172 = sum of losses 1,844,172
3. Efficiency measures one-sidedness
Efficiency puts the two together: +100% means everyone moved in and nobody out, 0% a perfect exchange. Most counties are much nearer balance than one-way:
bands = pd.cut(by.efficiency.abs(), [0, 0.05, 0.15, 0.3, 1.0], labels=["<5%", "5–15%", "15–30%", ">30%"], include_lowest=True)
print(bands.value_counts(normalize=True).sort_index().map("{:.0%}".format).to_string())
efficiency
<5% 23%
5–15% 35%
15–30% 26%
>30% 15%
Almost six counties in ten are within 15% of balance: their moves in and out nearly cancel.
Two counties with the same net, different stories
The data used on this page
The Census Bureau's county-to-county migration flows, 2016–2020 ACS (all 52 sheets of the "ins, outs, nets, gross" workbook) and the Census county population estimates file for county names.
from pathlib import Path

import numpy as np
import pandas as pd
import requests

Path("data").mkdir(exist_ok=True)
SRC = {"county-to-county-2016-2020-ins-outs-nets-gross.xlsx": "https://www2.census.gov/programs-surveys/demo/tables/geographic-mobility/2020/"
       "county-to-county-migration-2016-2020/county-to-county-migration-flows/county-to-county-2016-2020-ins-outs-nets-gross.xlsx",
       "co-est2023-alldata.csv": "https://www2.census.gov/programs-surveys/popest/datasets/2020-2023/counties/totals/co-est2023-alldata.csv"}
for name, url in SRC.items():
    if not Path("data", name).exists():
        Path("data", name).write_bytes(requests.get(url, timeout=600).content)
COLS = ["a_st", "a_cty", "b_st", "b_cty", "a_state", "a_county", "b_state", "b_county",
        "flow", "flow_moe", "counter", "counter_moe", "net", "net_moe", "gross", "gross_moe"]
sheets = pd.read_excel("data/county-to-county-2016-2020-ins-outs-nets-gross.xlsx", sheet_name=None, header=None,
                       skiprows=3, names=COLS, dtype=str)
flows = pd.concat(sheets.values())
flows = flows[flows.a_cty.notna() & flows.b_st.notna()].copy()
for c in COLS[8:]:
    flows[c] = pd.to_numeric(flows[c], errors="coerce")
flows["geoid"] = flows.a_st.str[1:] + flows.a_cty
us = flows[flows.b_st.str.fullmatch(r"\d{3}")]
pe = pd.read_csv("data/co-est2023-alldata.csv", encoding="latin-1", dtype={"STATE": str, "COUNTY": str}).query("SUMLEV == 50")
NAMES = pd.Series((pe.CTYNAME + ", " + pe.STNAME).to_numpy(), index=pe.STATE + pe.COUNTY, name="name")
print(f"{len(us):,} county-to-county rows")
406,348 county-to-county rows
Example 1: two counties, same net, different stories
mid = by[(by.net.abs() > 900) & (by.net.abs() < 1100)].join(NAMES).dropna(subset=["name"])
pair = pd.concat([mid.nlargest(1, "gross"), mid.nsmallest(1, "gross")])
print(pair[["name", "inflow", "outflow", "net", "efficiency"]].to_string(index=False,
      formatters={"efficiency": "{:+.0%}".format}))
name inflow outflow net efficiency
Franklin County, Ohio 66999 67983.0 -984.0 -1%
Beaver County, Utah 82 1165.0 -1083.0 -87%
The sum and the difference of the same two flows
Gross and net migration are the sum and the difference of the same two flows. Gross says how much movement a place takes part in; net says how much its population changes because of it. Because most moves are matched by moves in the other direction, net is usually a small fraction of gross. Nationally, the county-to-county moves in five years redistribute only a fraction of the people who moved.
So the choice of measure is a choice of question. Planning for schools, housing or services needs gross, because every arrival and departure is a household to serve. Asking where the country's population is shifting needs net. Asking whether a place's movement is an exchange or a one-way flow needs efficiency, which also puts a big county and a small one on the same scale. Mapping net alone, and how to keep it honest, is in how to map net migration by county.
Moves within a county and from abroad
- Moves within a county are not county-to-county flows and appear in neither measure here.
- Moves from abroad add to gross in-migration but have no measured counterpart out of the country in the ACS; exclude them from net comparisons.
- Rates (per 1,000 residents) are needed to compare counties of different size for either measure.
- Efficiency is undefined when gross is zero and unstable when gross is small.
Internal links
- How to map net migration by county — net as a rate, with significance
- How to test whether a flow is one-way — efficiency for pairs of counties
FAQ
What is the difference between gross and net migration?
Gross is moves in plus moves out (total turnover); net is moves in minus moves out (the change in population from migration).
What is migration efficiency?
Net migration divided by gross migration. It measures how one-sided migration is, from 0% (balanced) to ±100% (entirely one way).
Why is net migration small compared with gross?
Most moves into a place are matched by moves out of it, so the two largely cancel.
Which should I map?
Net for population change, gross for turnover, efficiency for one-sidedness. A net map alone hides most of the movement.