
How to Map Commuting Flows from LEHD LODES in Python
On this page
Problem statement
The Census Bureau's LEHD Origin-Destination Employment Statistics (LODES) say where people live and where they work, for every pair of census blocks in a state. That makes it the most detailed open commuting dataset in the United States, and a natural source for commuting flow maps. Block-to-block pairs are far too fine to map directly, though. Rhode Island alone has tens of thousands of them, most holding one or two jobs. The work is to aggregate them to places people recognise, separate people who work where they live from those who commute out, and then draw the flows between places.
This page turns Rhode Island's 2021 LODES file into a town-to-town commuting table, measures how many people work in their home town, and maps the main flows.
Quick answer
Read the OD file with block codes as strings, attach each block's town from the crosswalk, and sum jobs by home town and work town:
od = pd.read_csv("data/ri_od_main_JT00_2021.csv.gz", dtype={"w_geocode": str, "h_geocode": str})
town = XWALK.set_index("tabblk2020").ctycsub
od["home"], od["work"] = od.h_geocode.map(town), od.w_geocode.map(town)
tt = od.groupby(["home", "work"], as_index=False).S000.sum().rename(columns={"S000": "jobs"})
print(f"{len(od):,} block pairs, {od.S000.sum():,} jobs -> {len(tt):,} town pairs; "
      f"median jobs per block pair {od.S000.median():.0f}")
360,924 block pairs, 380,586 jobs -> 1,466 town pairs; median jobs per block pair 1
What a row is, home-town work against commuting out
1. Know what one row is
Each row is a pair of census blocks with counts of primary and secondary jobs (JT00 is all jobs) held by residents of the home block at the work block. S000 is the total; the other columns split it by age, earnings and industry. The main file covers people who live and work in the state; aux adds jobs in the state held by out-of-state residents:
print(od.columns.tolist())
print(f"block pairs with 1 job: {(od.S000 == 1).mean():.0%}; with 10 or more: {(od.S000 >= 10).mean():.2%}")
['w_geocode', 'h_geocode', 'S000', 'SA01', 'SA02', 'SA03', 'SE01', 'SE02', 'SE03', 'SI01', 'SI02', 'SI03', 'createdate', 'home', 'work']
block pairs with 1 job: 96%; with 10 or more: 0.01%
2. Separate working at home town from commuting out
The diagonal of the town-to-town table holds people who work in the town they live in. It is often the biggest single cell in a row, and it is not a flow between places:
same = tt.home == tt.work
print(f"jobs held in the home town: {tt.loc[same, 'jobs'].sum():,} of {tt.jobs.sum():,} ({tt.loc[same, 'jobs'].sum() / tt.jobs.sum():.0%})")
by_town = tt[same].set_index("home").jobs / tt.groupby("home").jobs.sum()
print("highest share working at home:", ", ".join(f"{NAME[t]} {v:.0%}" for t, v in by_town.nlargest(3).items()))
print("lowest:                       ", ", ".join(f"{NAME[t]} {v:.0%}" for t, v in by_town.nsmallest(3).items()))
top_work = tt.loc[tt.groupby("home").jobs.idxmax()].set_index("home").work
print(f"largest cell in the row is the home town for {(top_work == top_work.index).sum()} towns, "
      f"Providence for {((top_work == PROVIDENCE) & (top_work.index != PROVIDENCE)).sum()} others")
jobs held in the home town: 88,223 of 380,586 (23%)
highest share working at home: New Shoreham 76%, Westerly 46%, Providence 45%
lowest: Exeter 8%, West Greenwich 8%, Foster 8%
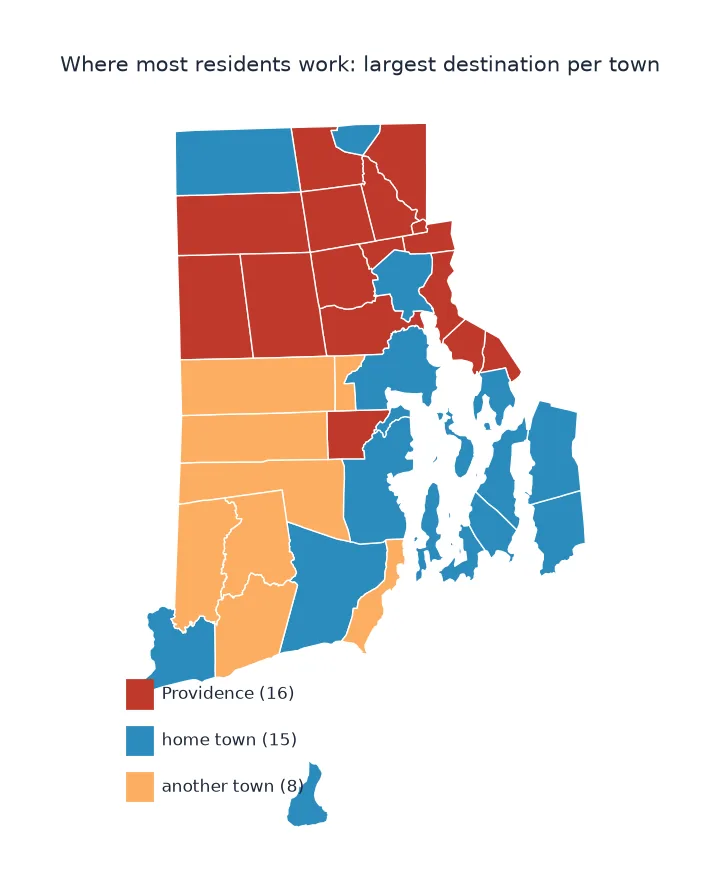
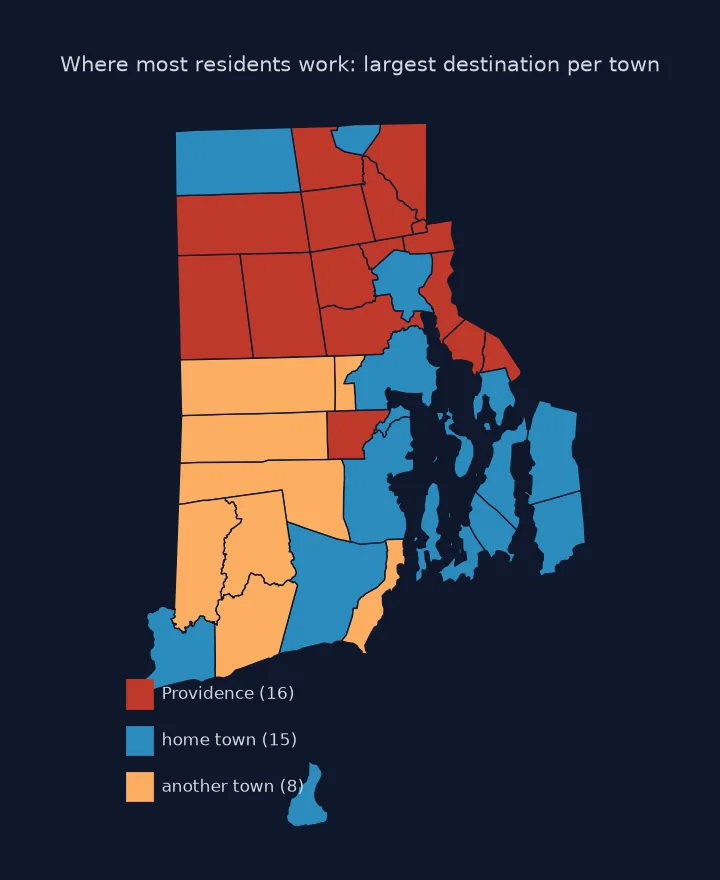
largest cell in the row is the home town for 15 towns, Providence for 16 others
3. Find the main flows between towns
Drop the diagonal and rank what is left. A handful of destinations dominate:
between = tt[~same].sort_values("jobs", ascending=False)
print(between.head(8).assign(home=lambda d: d.home.map(NAME), work=lambda d: d.work.map(NAME)).to_string(index=False))
to_prov = between[between.work == PROVIDENCE].jobs.sum()
print(f"commuters into Providence from other RI towns: {to_prov:,} ({to_prov / between.jobs.sum():.0%} of all inter-town commuting)")
home work jobs
Cranston Providence 9297
Warwick Providence 7710
Pawtucket Providence 6132
Providence Cranston 5601
East Providence Providence 5145
Providence Warwick 4631
Cranston Warwick 4528
North Providence Providence 4239
commuters into Providence from other RI towns: 66,844 (23% of all inter-town commuting)
4. Map the flows
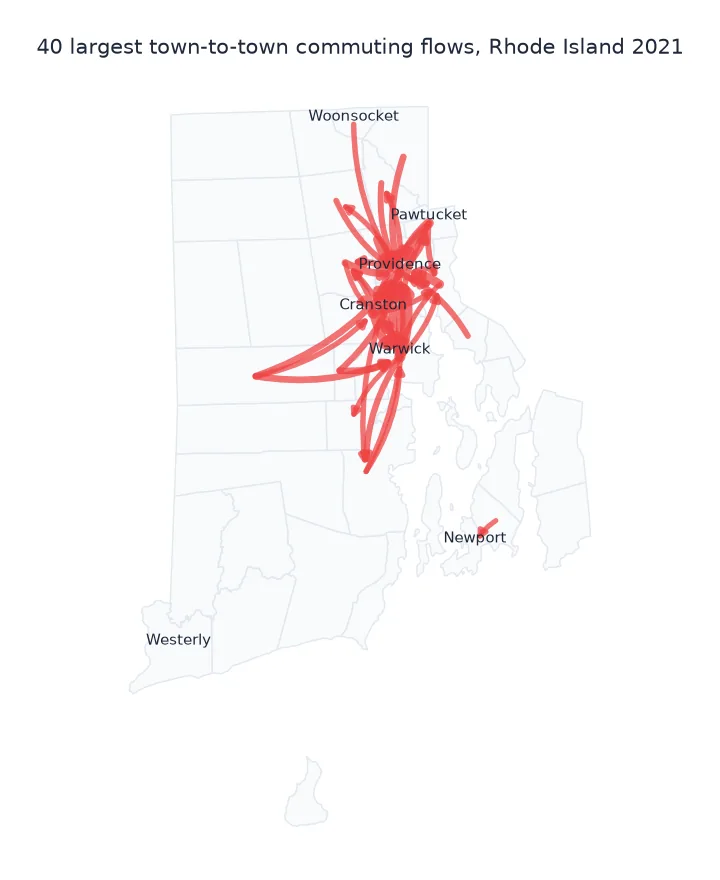
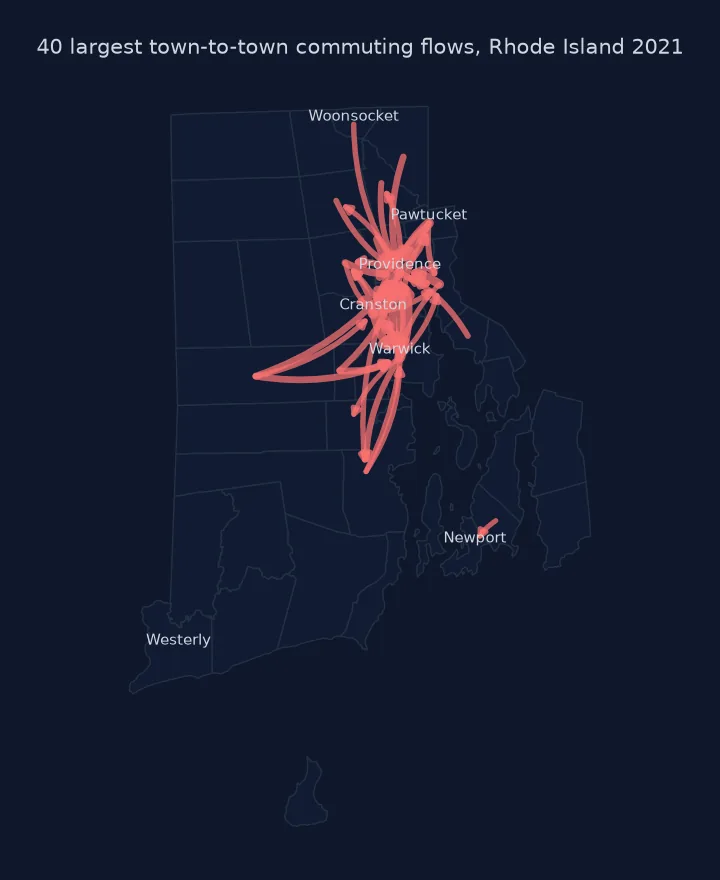
Draw each of the largest inter-town flows from the home town's centroid to the work town's, wider for more jobs, largest on top:
top = between.head(40).sort_values("jobs")
fig, ax = plt.subplots(figsize=(6, 8))
TOWNS.plot(ax=ax, color="#f2f2f2", edgecolor="#bbbbbb", lw=0.4)
for _, r in top.iterrows():
    (x0, y0), (x1, y1) = CENTROID[r.home], CENTROID[r.work]
    ax.annotate("", (x1, y1), (x0, y0), arrowprops=dict(arrowstyle="-|>", lw=0.3 + 4 * np.sqrt(r.jobs / top.jobs.max()),
                color="#c0392b", alpha=0.7, connectionstyle="arc3,rad=0.15", shrinkA=0, shrinkB=2))
ax.set_axis_off(); fig.savefig("data/ri_commutes.png", dpi=150)
print(f"40 flows drawn: {top.jobs.sum():,} jobs, {top.jobs.sum() / between.jobs.sum():.0%} of inter-town commuting")
40 flows drawn: 108,741 jobs, 37% of inter-town commuting
A town-to-town matrix for Rhode Island
The data used on this page
LEHD Origin-Destination Employment Statistics version 8 for Rhode Island, 2021: the main OD file for all jobs (JT00) and the block crosswalk; Rhode Island county subdivision (town) outlines from the 2023 cartographic boundary files, projected to Rhode Island State Plane (EPSG:3438).
from pathlib import Path

import geopandas as gpd
import matplotlib
matplotlib.use("Agg")
import matplotlib.pyplot as plt
import numpy as np
import pandas as pd
import requests

Path("data").mkdir(exist_ok=True)
L = "https://lehd.ces.census.gov/data/lodes/LODES8/ri/"
SRC = {"ri_od_main_JT00_2021.csv.gz": L + "od/ri_od_main_JT00_2021.csv.gz", "ri_xwalk.csv.gz": L + "ri_xwalk.csv.gz",
       "cb_2023_44_cousub_500k.zip": "https://www2.census.gov/geo/tiger/GENZ2023/shp/cb_2023_44_cousub_500k.zip"}
for name, url in SRC.items():
    if not Path("data", name).exists():
        Path("data", name).write_bytes(requests.get(url, timeout=600).content)
XWALK = pd.read_csv("data/ri_xwalk.csv.gz", dtype=str, usecols=["tabblk2020", "ctycsub", "ctycsubname"])
TOWNS = gpd.read_file("data/cb_2023_44_cousub_500k.zip").to_crs(3438)
TOWNS = TOWNS[TOWNS.ALAND > 0]
NAME = dict(zip(TOWNS.GEOID, TOWNS.NAME))
CENTROID = {g: (p.x, p.y) for g, p in zip(TOWNS.GEOID, TOWNS.representative_point())}
PROVIDENCE = TOWNS.loc[TOWNS.NAME == "Providence", "GEOID"].iloc[0]
print(f"{len(XWALK):,} blocks in the crosswalk; {len(TOWNS)} towns")
25,649 blocks in the crosswalk; 39 towns
Example 1: a town-to-town matrix
mat = tt.pivot(index="home", columns="work", values="jobs").fillna(0).astype(int)
mat = mat.rename(index=NAME, columns=NAME)
print(mat.shape, "rows = home town, columns = work town")
print(mat.loc[["Providence", "Warwick", "Cranston"], ["Providence", "Warwick", "Cranston"]].to_string())
(39, 39) rows = home town, columns = work town
work Providence Warwick Cranston
home
Providence 24131 4631 5601
Warwick 7710 9808 3753
Cranston 9297 4528 6702
Administrative records, not a survey
LODES is built from administrative records (unemployment insurance wage records and federal employment data), not a survey. So it has no margins of error in the ACS sense. It does have noise added to protect confidentiality, and it counts jobs, not people: a person with two jobs appears twice. The block-to-block detail is real but mostly too sparse to read, so aggregating to towns or tracts is the normal first step, and the right unit depends on the question.
The diagonal decides what the flow map shows. Working in your home town is the largest single destination for 15 of Rhode Island's 39 towns, and drawing it as a flow is meaningless: it would be a line of zero length. Dropping it shows what the map is for, the movement between places. In Rhode Island that movement converges on Providence, with secondary centres in Warwick and Cranston.
Leading zeros, aux files and versions
- Leading zeros: block codes are 15 digits starting with the state code; reading them as integers breaks states with codes below 10.
auxfiles: add them to count jobs in Rhode Island held by residents of Massachusetts or Connecticut.- Coverage: LODES comes from employment records, so self-employment and informal work are largely missing.
- Year and version: LODES8 uses 2020 census blocks; do not mix with LODES7 (2010 blocks) without a crosswalk.
- Noise: small cells are perturbed for confidentiality; aggregate before drawing conclusions about individual blocks.
Internal links
- How to make a flow map in Python — curves, widths and drawing order
- How to build an origin–destination matrix — the table form of these flows
FAQ
What is LODES data?
LEHD Origin-Destination Employment Statistics: Census Bureau counts of jobs by home block and work block, built from administrative employment records, published per state and year.
How do I aggregate LODES to towns or counties?
Join each block code to the LODES crosswalk file, which lists the county, tract, place and county subdivision of every block, and sum the jobs.
What is the difference between the main and aux LODES files?
Main covers jobs where both home and work are in the state; aux covers jobs in the state held by people living in other states.
Does LODES count people or jobs?
Jobs. A person with two jobs is counted twice in JT00 (all jobs); JT01 counts primary jobs only.