
Why Are the Lines on My Flow Map in the Wrong Place?
On this page
Problem statement
A flow line is supposed to connect two places. On some maps the lines miss the map entirely: they huddle in a corner or vanish. On others they connect the right endpoints but take a path that makes no geographic sense, such as a Seattle–Miami line that runs hundreds of kilometres from the shortest route. Both come from the coordinate system of the lines. Either it does not match the basemap, or the line's shape was built in one system and drawn in another. The second is subtle, because there are several reasonable "straight lines" between two places, and over a continent some of them diverge by hundreds of kilometres.
This page reproduces both problems for two long US flows, Los Angeles to New York and Seattle to Miami. It measures how far the different "straight" lines are from the true shortest path, the great circle.
Quick answer
Put lines and basemap in the same projected CRS before plotting. For long flows, densify along the great circle first, then project:
def great_circle(lon1, lat1, lon2, lat2, n=64):
    pts = GEOD.npts(lon1, lat1, lon2, lat2, n)                       # intermediate points on the ellipsoid
    return LineString([(lon1, lat1), *pts, (lon2, lat2)])

lines = gpd.GeoSeries([great_circle(*A, *B) for A, B in PAIRS.values()], crs=4326).to_crs(5070)
print(f"{len(lines)} great-circle lines with {len(lines.iloc[0].coords)} vertices each, now in {lines.crs.to_string()}, "
      f"inside the basemap bounds: {lines.total_bounds[0] >= STATES.total_bounds[0] - 1e5}")
2 great-circle lines with 66 vertices each, now in EPSG:5070, inside the basemap bounds: True
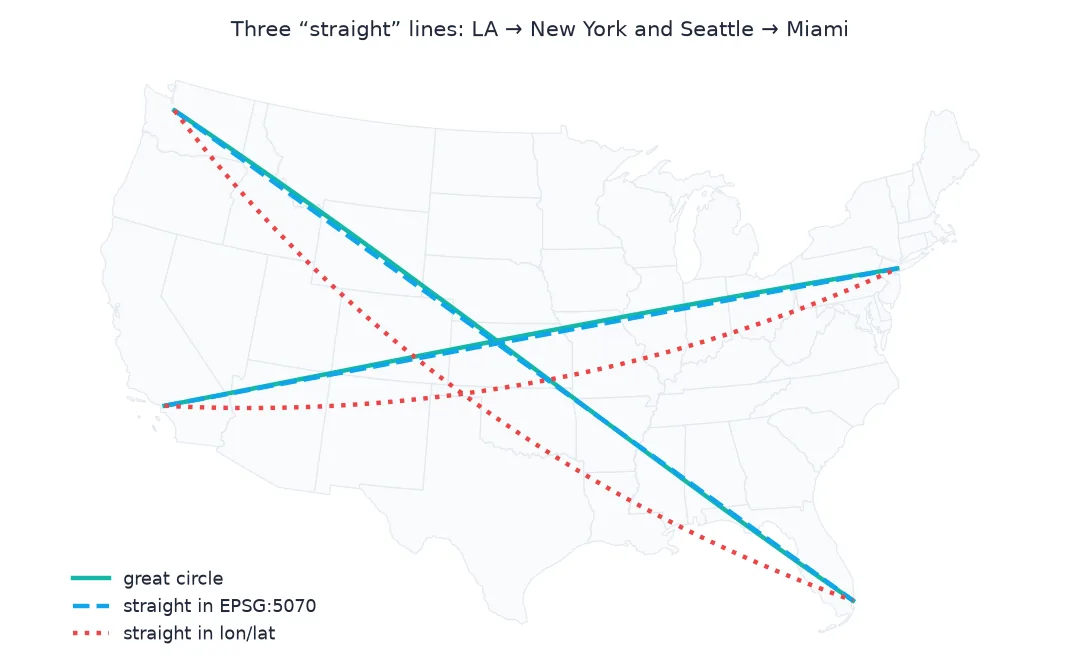
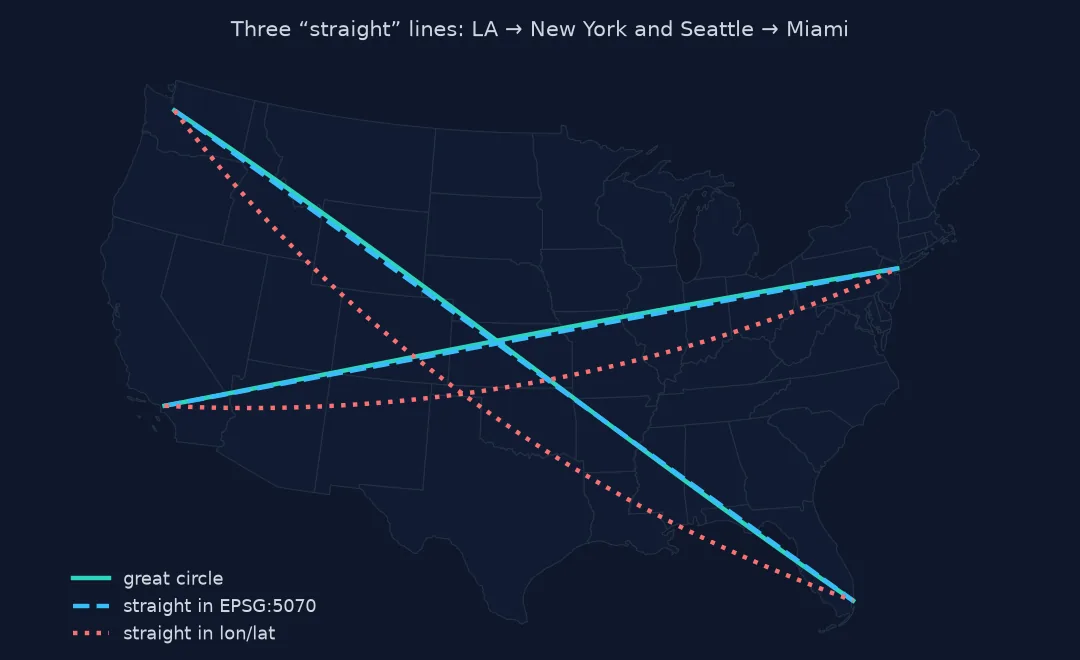
One CRS for lines and basemap, a deliberate straight line
1. Check that lines and basemap share a CRS
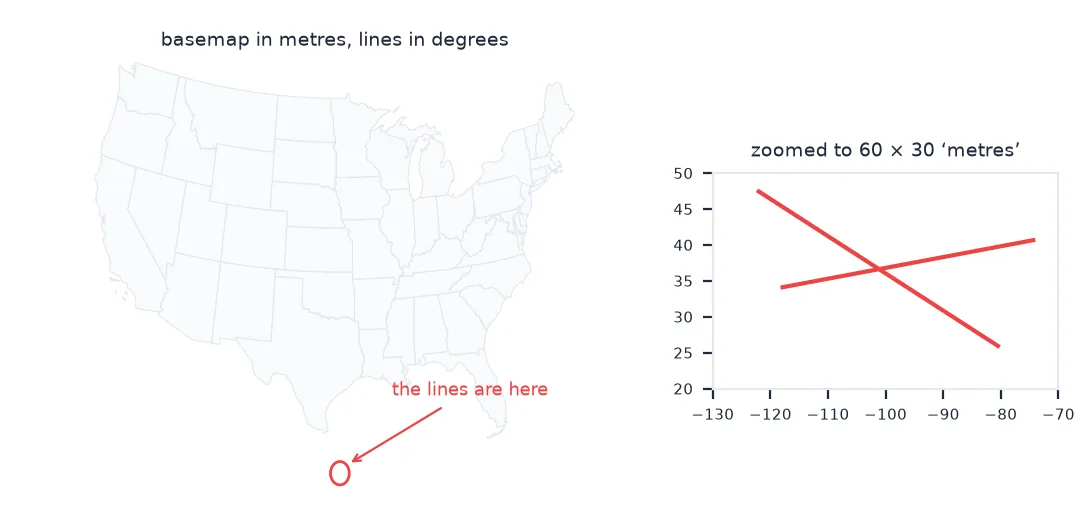
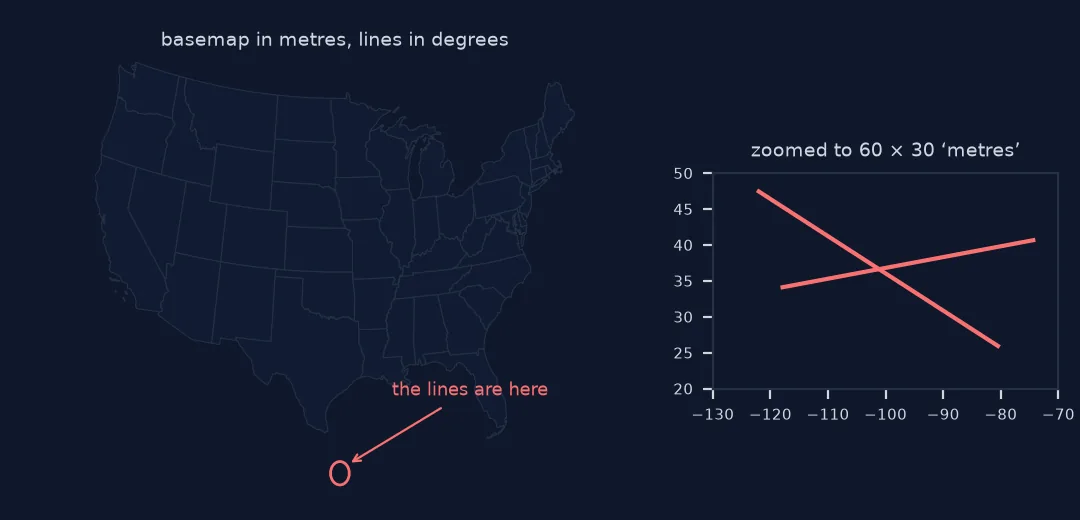
The most common failure: the basemap is projected (metres), the lines are in degrees. Both plot without error, but at completely different scales:
raw = gpd.GeoSeries([LineString([A, B]) for A, B in PAIRS.values()], crs=4326)
print(f"basemap x range: {STATES.total_bounds[0]:,.0f} to {STATES.total_bounds[2]:,.0f} (metres, EPSG:5070)")
print(f"lines x range:   {raw.total_bounds[0]:.1f} to {raw.total_bounds[2]:.1f} (degrees, EPSG:4326)")
print("same CRS:", raw.crs == STATES.crs)
basemap x range: -2,356,114 to 2,258,154 (metres, EPSG:5070)
lines x range: -122.3 to -74.0 (degrees, EPSG:4326)
same CRS: False
Plotted together, the lines occupy a space about 50 units wide near the origin of a map millions of metres across. They are drawn, just invisibly small and in the wrong place. Reproject one layer to the other's CRS.
2. Know which "straight line" you are drawing
Between two points there are three common lines. A two-vertex line, reprojected, is straight in the projected map. A line densified in longitude and latitude, then projected, follows a path of steadily changing longitude and latitude. A great circle is the shortest path on the Earth. Measure how far the first two stray from the third, at their midpoints:
def midpoint_offset_km(line_a, line_b):
    a = line_a.interpolate(0.5, normalized=True); b = line_b.interpolate(0.5, normalized=True)
    return a.distance(b) / 1000

for name, (A, B) in PAIRS.items():
    gc = gpd.GeoSeries([great_circle(*A, *B)], crs=4326).to_crs(5070).iloc[0]
    proj_straight = gpd.GeoSeries([LineString([A, B])], crs=4326).to_crs(5070).iloc[0]
    lonlat_dense = gpd.GeoSeries([LineString(np.linspace(A, B, 64))], crs=4326).to_crs(5070).iloc[0]
    print(f"{name:22s}: straight in EPSG:5070 is {midpoint_offset_km(proj_straight, gc):4.0f} km from the great circle at mid-route; "
          f"straight in lon/lat is {midpoint_offset_km(lonlat_dense, gc):4.0f} km off")
Los Angeles -> New York: straight in EPSG:5070 is 15 km from the great circle at mid-route; straight in lon/lat is 252 km off
Seattle -> Miami : straight in EPSG:5070 is 9 km from the great circle at mid-route; straight in lon/lat is 330 km off
3. Choose deliberately
The line straight in longitude and latitude is the one to avoid: 252 km off the great circle for Los Angeles–New York and 330 km for Seattle–Miami. A straight line in a conic projection such as CONUS Albers happens to stay within 15 km of the great circle, so for US flows drawn in EPSG:5070 two vertices are enough. In Web Mercator or for longer flows that no longer holds, and densifying along the great circle is the safe default. For short flows within a city all three lines are indistinguishable. Curving lines for legibility (as in a flow map with arcs) is a design choice; make it after the geography is right.
Line lengths measured on the ellipsoid
The data used on this page
City coordinates (longitude, latitude) for Los Angeles, New York, Seattle and Miami city halls, approximate to 0.01°; state outlines from the 2023 cartographic boundary files, projected to CONUS Albers (EPSG:5070). Great circles are computed on the WGS 84 ellipsoid with pyproj.Geod.
from pathlib import Path

import geopandas as gpd
import numpy as np
import requests
from pyproj import Geod
from shapely.geometry import LineString

Path("data").mkdir(exist_ok=True)
if not Path("data/cb_2023_us_state_20m.zip").exists():
    Path("data/cb_2023_us_state_20m.zip").write_bytes(requests.get("https://www2.census.gov/geo/tiger/GENZ2023/shp/cb_2023_us_state_20m.zip", timeout=300).content)
STATES = gpd.read_file("data/cb_2023_us_state_20m.zip").query("STUSPS not in ['AK', 'HI', 'PR']").to_crs(5070)
GEOD = Geod(ellps="WGS84")
PAIRS = {"Los Angeles -> New York": ((-118.24, 34.05), (-74.01, 40.71)),
         "Seattle -> Miami": ((-122.33, 47.60), (-80.19, 25.77))}
for name, (A, B) in PAIRS.items():
    print(f"{name}: {GEOD.inv(*A, *B)[2] / 1000:,.0f} km on the ellipsoid")
Los Angeles -> New York: 3,944 km on the ellipsoid
Seattle -> Miami: 4,400 km on the ellipsoid
Example 1: length of each line, measured on the ellipsoid
for name, (A, B) in PAIRS.items():
    gc_len = GEOD.geometry_length(great_circle(*A, *B)) / 1000
    ll_len = GEOD.geometry_length(LineString(np.linspace(A, B, 64))) / 1000
    print(f"{name:22s}: great circle {gc_len:,.0f} km, lon/lat straight line {ll_len:,.0f} km (+{ll_len / gc_len - 1:.1%})")
Los Angeles -> New York: great circle 3,944 km, lon/lat straight line 3,984 km (+1.0%)
Seattle -> Miami : great circle 4,400 km, lon/lat straight line 4,462 km (+1.4%)
Coordinates mean nothing without their system
Coordinates mean nothing without their reference system. A flow table usually stores longitude and latitude, and a basemap is usually projected, so the two must meet in one CRS before plotting. GeoPandas does not reproject on plot: it draws whatever numbers it is given. When the scales differ by a factor of a hundred thousand, the lines collapse into a speck that is easy to mistake for no lines at all.
The shape problem is about what "straight" means. A segment with two vertices is straight in whatever coordinate system it is drawn in. Straight in longitude and latitude is a different path from straight in an Albers projection, and neither is the shortest path on the Earth. Over a few kilometres the differences vanish. Across the United States, a line straight in longitude and latitude runs up to 330 km from the great circle, while a straight line in Albers stays within 15 km. Densifying along the great circle before projecting fixes the geography once, for any projection.
The antimeridian, web maps and pydeck
- Antimeridian: great circles across 180° need splitting, or the line wraps around the whole map.
- Web maps: Leaflet and MapLibre draw straight lines in Web Mercator; densify great circles before sending them.
- pydeck:
ArcLayerdraws screen-space arcs;GreatCircleLayerfollows the great circle. - Short flows (within a city) can stay as two-vertex lines in a local projected CRS.
- Length: measure line lengths on the ellipsoid (
Geod.geometry_length) or in an equal-distance projection, not in degrees.
Internal links
- How to make a flow map in Python — curved lines for legibility, after projecting
- How to make an interactive arc map — arcs in the browser
FAQ
Why do my flow lines not show up on the map?
They are probably in a different CRS from the basemap, usually degrees against metres. Reproject the lines with .to_crs(basemap.crs).
How do I draw great-circle lines in Python?
Use pyproj.Geod.npts to compute intermediate points between the endpoints, build a LineString, then project it like any other geometry.
Is a straight line on a projected map the shortest route?
No; it is straight only in that projection. The shortest route on the Earth is the great circle, which usually looks curved on a map.
When does the difference matter?
For flows longer than a few hundred kilometres. Within a city or region the different lines are visually identical.