
How to Test Whether a Migration Flow Is Really One-Way in Python
On this page
Problem statement
Between any two places, people move both ways. A flow map that draws only the larger direction, or only the net, invites the reader to see a one-way stream. Often, though, the two directions are close, and their difference is smaller than the uncertainty in either estimate. With survey data such as the American Community Survey, the question "do more people move from A to B than from B to A?" has a statistical answer. Compare the difference with its margin of error, which combines the margins of both flows. A related measure, migration efficiency (net divided by gross), says how one-sided an exchange is on a scale from 0 to 100%.
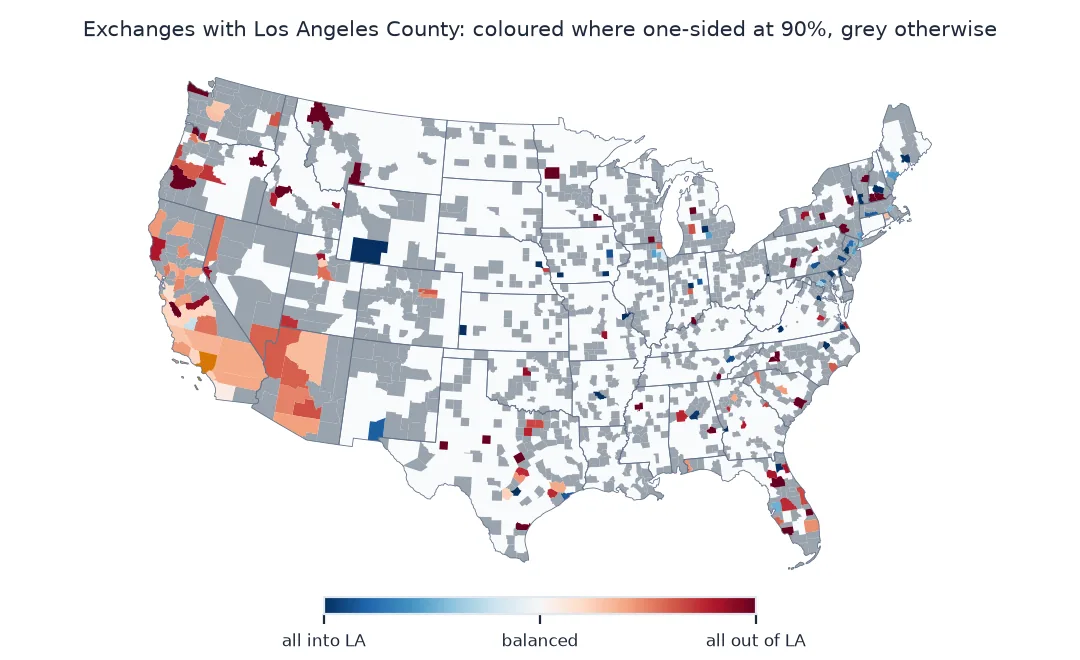
This page tests every county pair that exchanges people with Los Angeles County. It finds which exchanges are significantly one-sided and maps them.
Quick answer
For each pair, take the difference between the two directions, combine their MOEs in quadrature, and call the asymmetry significant when the difference exceeds its MOE:
pairs = us.dropna(subset=["flow", "counter"]).copy()
pairs["diff"] = pairs.counter - pairs.flow                                  # out of LA minus into LA
pairs["diff_moe"] = np.sqrt(pairs.counter_moe.fillna(0) ** 2 + pairs.flow_moe.fillna(0) ** 2)
pairs["significant"] = pairs["diff"].abs() > pairs.diff_moe
pairs["efficiency"] = pairs["diff"] / (pairs.counter + pairs.flow)
print(f"{len(pairs):,} partner counties; significantly one-sided: {pairs.significant.sum():,} "
      f"({pairs.loc[pairs.significant, 'counter'].add(pairs.loc[pairs.significant, 'flow']).sum() / (pairs.counter + pairs.flow).sum():.0%} of all moves between LA and them)")
1,234 partner counties; significantly one-sided: 179 (75% of all moves between LA and them)
Size dependence, one-sidedness, significant directions
1. See how the test depends on size
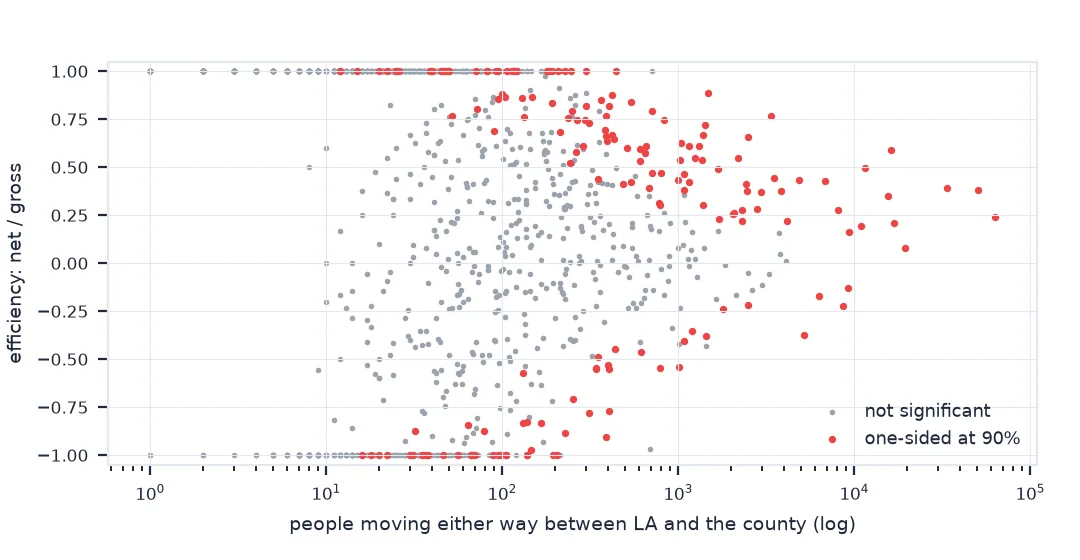
Big exchanges are almost always significant: their margins are small relative to the flows. Small ones almost never are, however lopsided they look:
size = pd.cut(pairs.counter + pairs.flow, [0, 100, 1000, 10000, np.inf], labels=["<100", "100–1k", "1k–10k", "10k+"])
print(pairs.groupby(size, observed=True).agg(pairs=("significant", "size"), significant=("significant", "mean")).to_string(
    formatters={"significant": "{:.0%}".format}))
pairs significant
<100 845 6%
100–1k 312 25%
1k–10k 68 63%
10k+ 9 100%
2. Measure how one-sided the big exchanges are
Migration efficiency is net over gross: 0% for a perfectly balanced exchange, 100% for a one-way stream. For Los Angeles's largest partners:
big = pairs.assign(gross=pairs.counter + pairs.flow).nlargest(10, "gross")
print(big[["b_county", "b_state", "counter", "flow", "efficiency", "significant"]].to_string(index=False,
      formatters={"efficiency": "{:+.0%}".format, "counter": "{:,.0f}".format, "flow": "{:,.0f}".format}))
b_county b_state counter flow efficiency significant
Orange County California 38,761 23,839 +24% True
San Bernardino County California 34,920 15,590 +38% True
Riverside County California 23,292 10,232 +39% True
San Diego County California 10,436 8,898 +8% True
Ventura County California 10,187 6,625 +21% True
Clark County Nevada 12,873 3,349 +59% True
Kern County California 10,503 5,058 +35% True
Maricopa County Arizona 8,614 2,891 +50% True
Alameda County California 6,538 4,404 +20% True
Santa Clara County California 5,413 3,900 +16% True
3. Count the direction of the significant ones
Of the exchanges that are significantly one-sided, how many run out of Los Angeles and how many into it?
sig = pairs[pairs.significant]
print(f"significant and net out of LA: {(sig['diff'] > 0).sum()}; net into LA: {(sig['diff'] < 0).sum()}")
print("largest significant net inflow:", sig.nsmallest(1, "diff")[["b_county", "b_state", "diff"]].to_string(index=False, header=False))
significant and net out of LA: 124; net into LA: 55
largest significant net inflow: Kings County New York -1932
Most significant exchanges run out of Los Angeles. The largest significant one running the other way is with Brooklyn (Kings County, New York): more people moved from Brooklyn to Los Angeles than the reverse.
The workbook's own net margins
The data used on this page
The Census Bureau's county-to-county migration flows, 2016–2020 ACS ("ins, outs, nets, gross" workbook, California sheet) and 2023 county outlines projected to EPSG:5070.
from pathlib import Path

import geopandas as gpd
import matplotlib
matplotlib.use("Agg")
import matplotlib.pyplot as plt
import numpy as np
import pandas as pd
import requests

Path("data").mkdir(exist_ok=True)
SRC = {"county-to-county-2016-2020-ins-outs-nets-gross.xlsx": "https://www2.census.gov/programs-surveys/demo/tables/geographic-mobility/2020/"
       "county-to-county-migration-2016-2020/county-to-county-migration-flows/county-to-county-2016-2020-ins-outs-nets-gross.xlsx",
       "cb_2023_us_county_20m.zip": "https://www2.census.gov/geo/tiger/GENZ2023/shp/cb_2023_us_county_20m.zip"}
for name, url in SRC.items():
    if not Path("data", name).exists():
        Path("data", name).write_bytes(requests.get(url, timeout=600).content)
COLS = ["a_st", "a_cty", "b_st", "b_cty", "a_state", "a_county", "b_state", "b_county",
        "flow", "flow_moe", "counter", "counter_moe", "net", "net_moe", "gross", "gross_moe"]
ca = pd.read_excel("data/county-to-county-2016-2020-ins-outs-nets-gross.xlsx", sheet_name="California",
                   header=None, skiprows=3, names=COLS, dtype=str)
us = ca[(ca.a_cty == "037") & ca.b_st.str.fullmatch(r"\d{3}", na=False)].copy()
for c in COLS[8:]:
    us[c] = pd.to_numeric(us[c], errors="coerce")
us["geoid"] = us.b_st.str[1:] + us.b_cty
COUNTIES = gpd.read_file("data/cb_2023_us_county_20m.zip").query("STUSPS not in ['AK', 'HI', 'PR']").to_crs(5070)
print(f"{len(us):,} US counties exchanging movers with Los Angeles County")
1,234 US counties exchanging movers with Los Angeles County
Example 1: the workbook's own net MOE
check = pairs[["net_moe", "diff_moe"]].dropna()
print(f"quadrature MOE vs the workbook's net MOE: median ratio {np.median(check.diff_moe / check.net_moe):.2f}")
quadrature MOE vs the workbook's net MOE: median ratio 1.00
Two estimates, each with its own uncertainty
A flow between two places is two estimates, one for each direction, and each has its own uncertainty. The difference between them, the net, is only meaningful when it is larger than the combined uncertainty. Every exchange of more than 10,000 people between Los Angeles and another county passes that test, and 63% of those between 1,000 and 10,000 do. Of the 845 exchanges under 100 people, 6% do, about what chance alone would produce. A map of "net flows" that colours them all as gains or losses is mostly showing noise.
Efficiency adds the second dimension. Two exchanges can have the same net, one as a small difference between two huge flows, the other as a one-way trickle. Efficiency separates them. Los Angeles's exchanges with its neighbouring counties are large, significant, and only moderately one-sided. Its exchanges with distant counties are often strongly one-sided on paper but too small to tell.
Confidence levels, missing counterflows and many tests
- 90% level: ACS margins are 90% intervals, so "significant" here means at the 90% level; multiply MOEs by 1.96/1.645 for 95%.
- Missing counterflows: rows with a blank flow or counterflow cannot be tested and are dropped.
- Independence: combining MOEs in quadrature assumes the two directions' errors are independent; the workbook's own net MOE is the safer number where given.
- Many tests: testing a thousand pairs at the 90% level will flag about a hundred by chance among truly balanced pairs; treat borderline cases with care.
- Zero flows have an MOE but no estimate; a pair with zero in one direction can still be insignificant.
Internal links
- How to map net migration by county — significance for county totals
- How to read county-to-county migration flows — the workbook
FAQ
How do I test whether two ACS estimates differ?
Take the difference, compute its MOE as the square root of the sum of the squared MOEs, and check whether the difference is larger than that MOE (90% level).
What is migration efficiency?
Net migration divided by gross migration between two places: 0% for a balanced exchange, ±100% for a one-way flow.
Why are most small migration flows not significant?
Their margins of error are as large as the estimates, so the difference between the two directions is usually within the combined margin.
Should a flow map show net or gross flows?
Gross shows how much exchange happens; net shows the imbalance. Show net only where it is significant, and say so.