
Fixing Earthquake Maps and Statistics Split at the Antimeridian
On this page
Problem statement
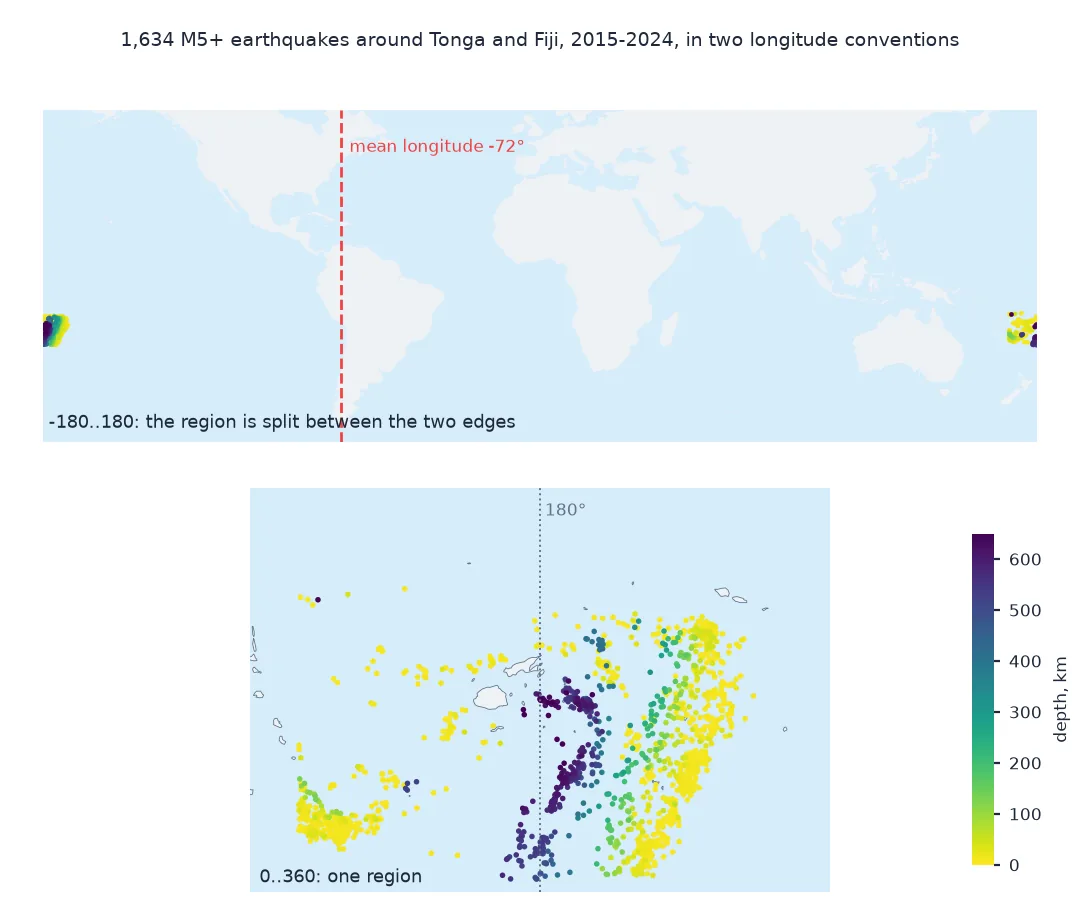
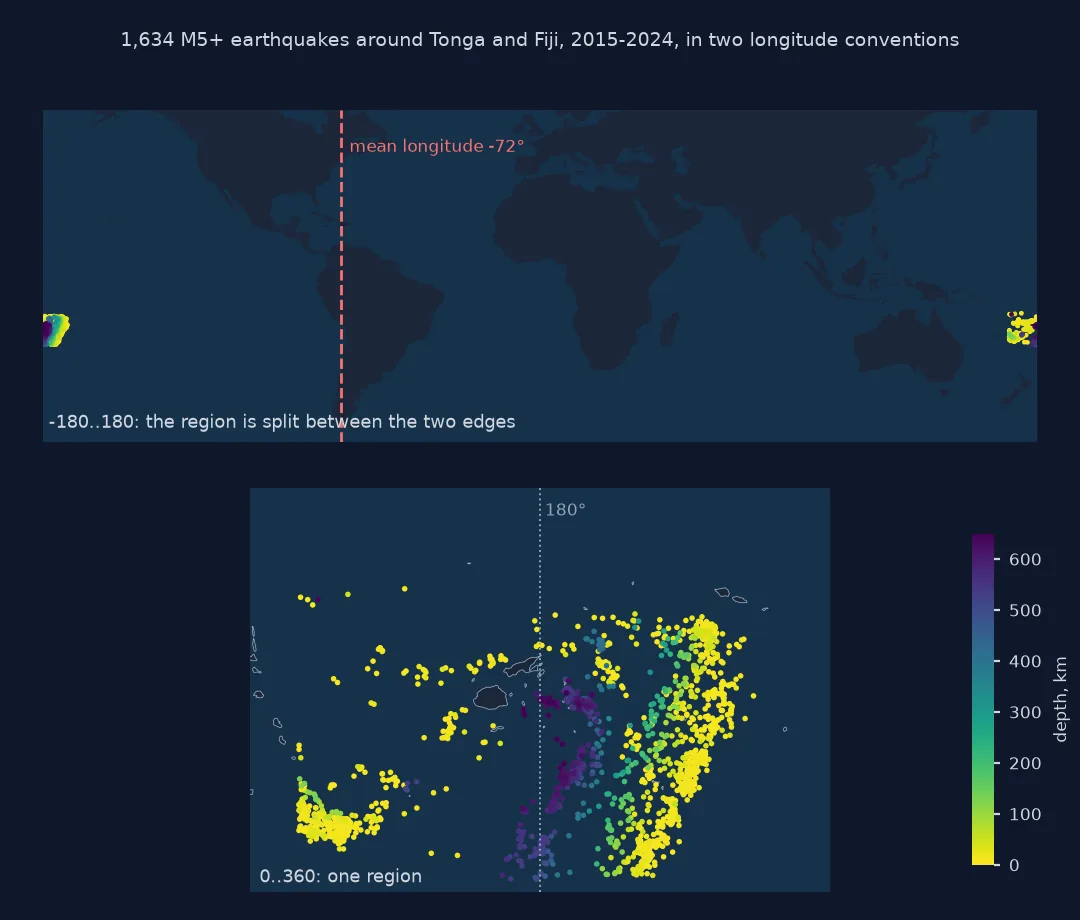
Tonga and Fiji are one of the most active earthquake regions on Earth, and they sit astride the 180° meridian. Data in longitudes from -180 to 180 split the region in two: a map centred on the Pacific shows half the earthquakes at the left edge and half at the right, the mean longitude of the region comes out at -72°, off the coast of South America, a bounding box covers the whole globe, and a request to a web service for "170°E to 170°W" is rejected. None of this is a data error; it is a seam in the coordinate system that every global dataset has to cross somewhere.
This page downloads ten years of M5+ earthquakes around Tonga and Fiji from the USGS, shows each symptom of the seam, and fixes them by shifting longitudes to 0–360 for the region, using a circular mean, and asking the service for the box in a form it accepts.
Quick answer
For a region that crosses 180°, work in 0–360 longitudes and convert back only for display or export:
print(f"mean longitude, -180..180: {ev.longitude.mean():.2f}")
lon360 = ev.longitude % 360
print(f"mean longitude, 0..360: {lon360.mean():.2f} = {((lon360.mean() + 180) % 360) - 180:.2f} in -180..180")
print(f"circular mean: {np.degrees(np.arctan2(np.sin(np.radians(ev.longitude)).mean(), np.cos(np.radians(ev.longitude)).mean())):.2f}")
mean longitude, -180..180: -72.06
mean longitude, 0..360: 181.08 = -178.92 in -180..180
circular mean: -178.91
The arithmetic mean of the longitudes as stored is -72.06°, a point off South America, about 100° of longitude from the nearest of the earthquakes. In 0–360 the mean is 181.08°, which is -178.92° in the usual convention, and the circular mean agrees to 0.01°.
Queries, bounds and distances across the line
1. The query
The FDSN service requires minlongitude to be less than maxlongitude, so "170 to -170" fails. It accepts longitudes beyond ±180 instead:
bad = requests.get(Q, params=dict(format="geojson", minlongitude=170, maxlongitude=-170, **BASE), timeout=60)
print(f"170 to -170: HTTP {bad.status_code}: {bad.text.splitlines()[2] if bad.status_code != 200 else ''}")
print(f"170 to 190: {len(ev)} events; returned longitudes from {ev.longitude.min():.2f} to {ev.longitude.max():.2f}")
print(f"east of 180 (negative longitudes): {(ev.longitude < 0).sum()}; west of 180: {(ev.longitude > 0).sum()}")
170 to -170: HTTP 400: minlongitude must be less than maxlongitude
170 to 190: 1634 events; returned longitudes from -179.99 to 180.00
east of 180 (negative longitudes): 1149; west of 180: 485
Asking for 170 to -170 returns HTTP 400 with the message "minlongitude must be less than maxlongitude". Asking for 170 to 190 works, and the service returns longitudes normalised to -180..180: 1,149 events east of the line, with negative longitudes, and 485 west of it.
2. Bounds, centroids and hulls
GeoPandas computes bounds and hulls in the coordinates it is given. In -180..180 the region spans the globe:
g = gpd.GeoDataFrame(ev, geometry=gpd.points_from_xy(ev.longitude, ev.latitude), crs=4326)
g360 = gpd.GeoDataFrame(ev, geometry=gpd.points_from_xy(ev.longitude % 360, ev.latitude), crs=4326)
for name, d in (("-180..180", g), ("0..360", g360)):
    b = d.total_bounds
    print(f"{name:>9}: bounds {b[0]:.1f} to {b[2]:.1f} ({b[2] - b[0]:.1f}° wide); hull area {d.union_all().convex_hull.area:,.1f} sq degrees")
-180..180: bounds -180.0 to 180.0 (360.0° wide); hull area 3,925.7 sq degrees
0..360: bounds 170.0 to 188.8 (18.8° wide); hull area 183.0 sq degrees
In -180..180 the bounding box is the whole width of the globe and the convex hull covers 3,925.7 square degrees, a band around the Earth with a hole where the earthquakes are. In 0–360 the bounds are 170.0° to 188.8°, 18.8° wide, and the hull 183.0 square degrees, about a twentieth.
3. Distances across the line
Planar distances in degrees across the seam are nonsense; projected distances need a CRS whose central meridian is near 180°. Compare the distance between two events on either side of the line:
a = ev.loc[(ev.longitude > 179).idxmax()]; b = ev.loc[(ev.longitude < -179).idxmax()]
print(f"A at {a.longitude:.2f}, B at {b.longitude:.2f}")
print(f"planar degrees: {np.hypot(a.longitude - b.longitude, a.latitude - b.latitude):.1f}°")
geod = Geod(ellps="WGS84")
print(f"geodesic: {geod.inv(a.longitude, a.latitude, b.longitude, b.latitude)[2] / 1000:.1f} km")
pc = gpd.GeoSeries(gpd.points_from_xy([a.longitude, b.longitude], [a.latitude, b.latitude]), crs=4326).to_crs("+proj=eqc +lon_0=180")
print(f"equidistant cylindrical centred on 180°: {pc.iloc[0].distance(pc.iloc[1]) / 1000:.1f} km")
A at 179.25, B at -179.34
planar degrees: 358.6°
geodesic: 346.6 km
equidistant cylindrical centred on 180°: 351.9 km
Two events 1.4° of longitude apart across the line are 358.6° apart as planar degrees. On the ellipsoid they are 346.6 km apart; they also differ in latitude. A projection centred on 180° gives 351.9 km, 1.5% more, because an equidistant cylindrical projection is exact only along meridians and the equator.
Binning across the antimeridian
The data used on this page
Every earthquake of magnitude 5 or more from 2015 to 2024 between 25° and 10°S and 170°E and 170°W from the USGS FDSN event service, requested as longitudes 170 to 190.
from pathlib import Path

import geopandas as gpd
import numpy as np
import pandas as pd
import requests
from pyproj import Geod

Path("data").mkdir(exist_ok=True)
Q = "https://earthquake.usgs.gov/fdsnws/event/1/query"
BASE = dict(starttime="2015-01-01", endtime="2025-01-01", minmagnitude=5, minlatitude=-25, maxlatitude=-10)
p = Path("data/tonga_fiji_m5_2015_2024.csv")
if not p.exists():
    r = requests.get(Q, params=dict(format="csv", minlongitude=170, maxlongitude=190, orderby="time-asc", **BASE), timeout=300)
    r.raise_for_status()
    p.write_text(r.text)
ev = pd.read_csv(p)
ev = ev[ev["type"] == "earthquake"].reset_index(drop=True)
print(f"{len(ev):,} earthquakes M5+; depths {ev.depth.min():.0f} to {ev.depth.max():.0f} km")
1,634 earthquakes M5+; depths 0 to 671 km
1,634 earthquakes of M5 or more in ten years, from the surface to 671 km deep: the Tonga slab is the most productive source of deep earthquakes on Earth.
Example 1: binning across the line
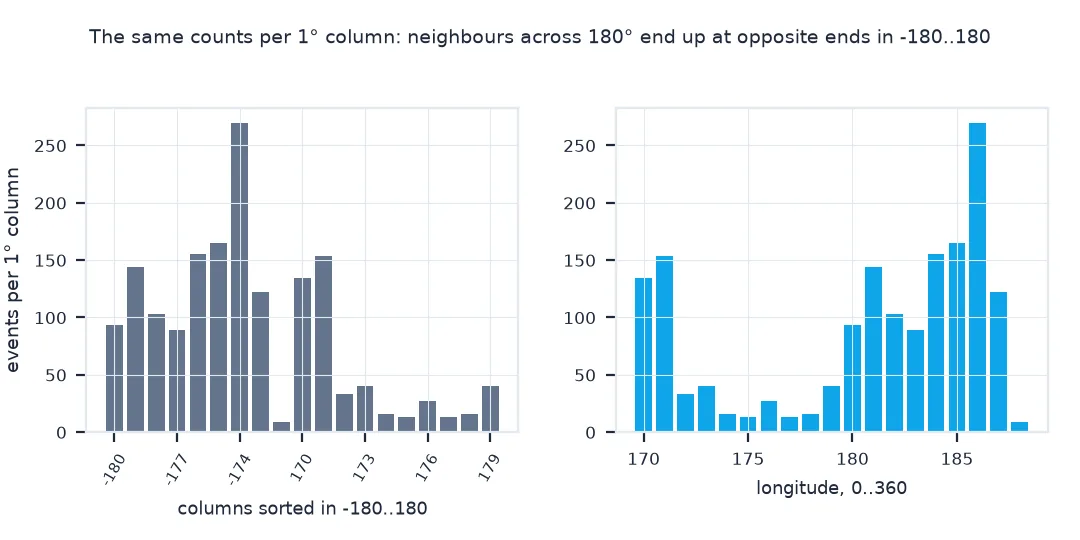
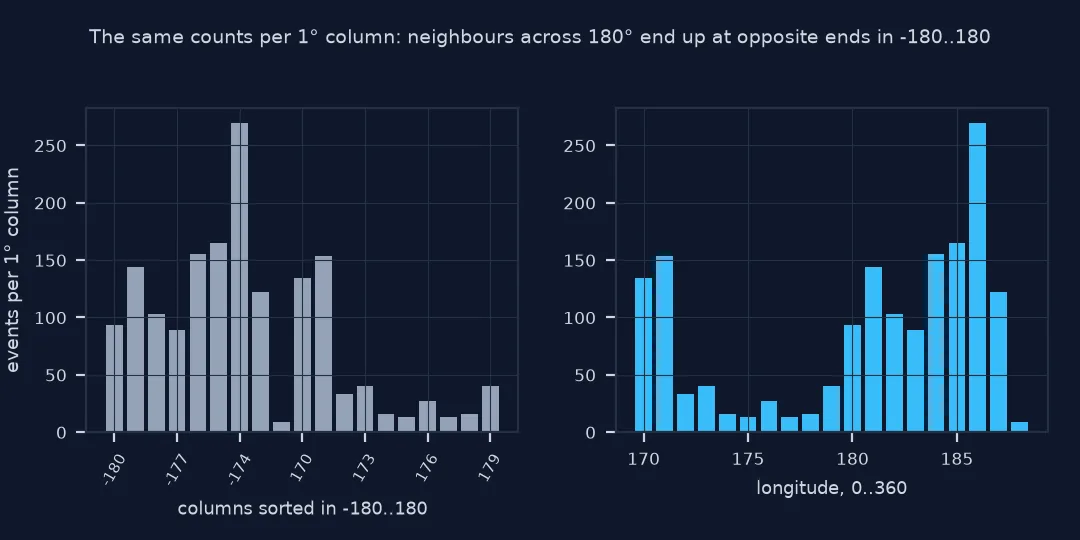
Counting events in 1° cells with floor(longitude) puts the cells at 179 and -180 at opposite ends of any table or grid. Bin in 0–360 to keep neighbours together:
cells = ev.assign(lon_cell=np.floor(ev.longitude % 360), lat_cell=np.floor(ev.latitude)).groupby(["lat_cell", "lon_cell"]).size()
top = cells.nlargest(3)
print("busiest 1° cells (0..360 longitude):", "; ".join(f"{la:.0f}, {lo:.0f} ({n})" for (la, lo), n in top.items()))
cols = np.floor(ev.longitude % 360).value_counts().sort_index()
print(f"events per column of 1°, 175 to 184 (0..360): {cols.loc[175:184].astype(int).to_dict()}")
busiest 1° cells (0..360 longitude): -16, 186 (82); -24, 171 (75); -23, 171 (72)
events per column of 1°, 175 to 184 (0..360): {175.0: 13, 176.0: 27, 177.0: 13, 178.0: 16, 179.0: 40, 180.0: 93, 181.0: 144, 182.0: 103, 183.0: 89, 184.0: 155}
The busiest 1° cells are at 16°S, 186° (174°W) in northern Tonga and at 23–24°S, 171°E, near the southern end of the Vanuatu arc. Across the line the counts run smoothly, 40 events in the column at 179° and 93 at 180°; in -180..180 those two columns would be at opposite ends of the table.
Longitude is an angle, and angles wrap
Longitude is an angle, and angles wrap: 179.9° and -179.9° are 0.2° apart, not 359.8°. Any method that treats longitude as an ordinary number, means, bounds, hulls, sorting, binning, planar distance, breaks where the numbers jump. Most global datasets put the jump at 180° because few people live there, but the Pacific is where many earthquakes, cyclones and ships are. The fix is to move the jump away from the data: for a region straddling 180°, shift to 0–360, where the region is continuous and the jump sits at the Greenwich meridian.
For statistics on angles over a wide range, a circular mean, the direction of the average unit vector, is correct at any longitude. For distances, measure on the ellipsoid with a geodesic or use a projection centred near the region. For maps, set the projection's central meridian near 180° rather than shifting the data, and for exported files remember that GeoJSON expects -180 to 180, with geometries that cross the line split in two.
GeoJSON rules, Shapely and plotting
- GeoJSON: RFC 7946 asks that geometries crossing the antimeridian be split; points are fine, lines and polygons are not.
- Shapely:
shiftto 0–360 is safe for points; for lines crossing 180° in -180..180, shift every vertex and check none jumps. - Web services: other APIs handle crossing boxes differently; some accept min > max, some want two requests.
- Plotting: matplotlib with a 0–360 x-axis keeps the region together; label ticks back to -180..180 if readers expect it.
Internal links
- How to map earthquakes against plate boundaries in Python — distances on the sphere without a seam
- Fixing distances to faults that come out in degrees or too long — degrees as distances
- How to draw an earthquake depth cross-section in Python — a subduction zone in profile
FAQ
How do I query USGS earthquakes across the 180° meridian?
Use longitudes beyond 180: minlongitude=170&maxlongitude=190 works, while minlongitude=170&maxlongitude=-170 is rejected because the minimum must be less than the maximum.
Why is my mean longitude wrong in the Pacific?
Points either side of 180° have longitudes near +180 and -180, which average to a value far from the region, -72° for Tonga and Fiji. Shift to 0–360 or use a circular mean.
How do I plot data that crosses the antimeridian?
Convert longitudes to 0–360 for a region near 180°, or use a map projection with its central meridian at 180°.
Do geodesic distances have this problem?
No: pyproj.Geod works on the ellipsoid and handles the antimeridian correctly.