
Fixing Peak Ground Acceleration Values That Are 100 Times Too Large
On this page
Problem statement
A ShakeMap says the peak ground acceleration in Ridgecrest was 38, the national hazard model says the ground motion with a 2% chance of being exceeded in 50 years there is 0.72, and a comparison concludes that the earthquake exceeded that level 53 times over. Nothing was wrong with either source. ShakeMap grids and station lists give PGA in percent of g, the USGS hazard web services give it in g, the 2014 national hazard map polygons are labelled in percent of g, and engineers often work in metres per second squared. A factor of 100, or of 9.81, slips in silently whenever two of them meet.
This page reads PGA for three towns near the 2019 Ridgecrest earthquake from the ShakeMap grid, from the USGS hazard curve service for the 2018 national model, and from the 2014 hazard map polygons, finds the units each one declares, converts them to one unit, and makes the comparison correctly.
Quick answer
Read the unit each source declares, and convert to g before comparing:
units = {f.attrib["name"]: f.attrib.get("units") for f in root.findall("s:grid_field", NS)}
print(f"ShakeMap grid.xml PGA units: {units['PGA']!r}; hazard service x-axis: {hz[TOWNS_LIST[0]]['response']['metadata']['xlabel']!r}")
for town in TOWNS:
    sm_g = shakemap_pga[town] / 100                       # percent of g -> g
    mce_g = pga_2475[town]                                # already g
    print(f"{town:>9}: ShakeMap {shakemap_pga[town]:.1f} %g = {sm_g:.2f} g; 2% in 50 years {mce_g:.2f} g; ratio {sm_g / mce_g:.2f} (unconverted: {shakemap_pga[town] / mce_g:.0f})")
ShakeMap grid.xml PGA units: '%g'; hazard service x-axis: 'Ground Motion (g)'
Ridgecrest: ShakeMap 38.0 %g = 0.38 g; 2% in 50 years 0.72 g; ratio 0.53 (unconverted: 53)
Trona: ShakeMap 27.4 %g = 0.27 g; 2% in 50 years 0.60 g; ratio 0.46 (unconverted: 46)
Inyokern: ShakeMap 27.2 %g = 0.27 g; 2% in 50 years 0.63 g; ratio 0.43 (unconverted: 43)
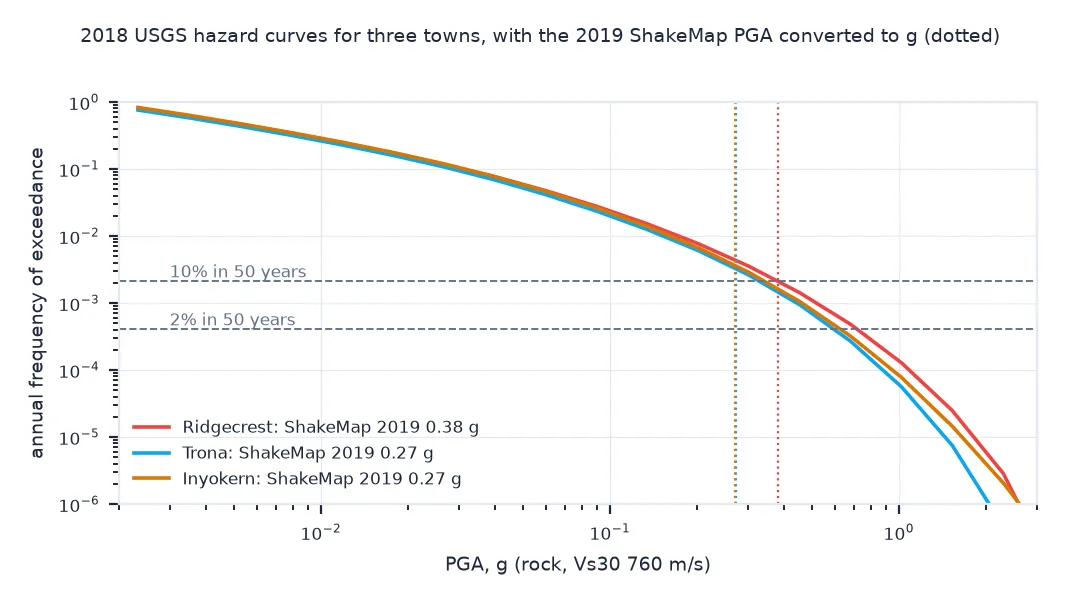
The ShakeMap PGA in Ridgecrest is 38.0% of g, 0.38 g, about half the 2018 model's 2%-in-50-years level of 0.72 g. Trona and Inyokern, at 0.27 g, reached 43–46% of theirs. Compared without converting, every town appears to have exceeded its design level more than 40 times.
Find each declared unit, convert, compare like with like
1. Find the declared unit in every source
Each source says what it uses, in a different place: an attribute in grid.xml, a field in every station-list amplitude, the axis label of the hazard service's response and the field name of the map polygons:
amp = next(a for f in stations["features"] if f["properties"]["station_type"] == "seismic"
           for ch in f["properties"]["channels"] for a in ch["amplitudes"] if a["name"] == "pga")
print(f"grid.xml: PGA {units['PGA']}, PGV {units['PGV']}")
print(f"stationlist.json: pga {amp['units']}")
print(f"hazard service: {hz[TOWNS_LIST[0]]['response']['metadata']['xlabel']}")
print(f"2014 map polygons: fields {[c for c in POLY.columns if 'PERCENT' in c or 'ACC' in c]}")
grid.xml: PGA %g, PGV cm/s
stationlist.json: pga %g
hazard service: Ground Motion (g)
2014 map polygons: fields ['USpga250_poly.ACC_VAL', 'dspga250_15M.ACC_VAL', 'dspga250_15M.PERCENT_G']
Every source declares its unit; they just declare different ones. ShakeMap's grid gives PGA in %g and PGV in cm/s, the station list gives each PGA amplitude in %g, the hazard service labels its axis in g, and the 2014 map carries its classes in a field called PERCENT_G.
2. Convert to one unit
One g is 9.80665 m/s² by definition. Convert every number once, at the point it is read, and keep the unit in the variable name:
G0 = 9.80665
for town in TOWNS:
    g = shakemap_pga[town] / 100
    print(f"{town:>9}: {shakemap_pga[town]:.1f} %g = {g:.3f} g = {g * G0:.2f} m/s²")
Ridgecrest: 38.0 %g = 0.380 g = 3.73 m/s²
Trona: 27.4 %g = 0.274 g = 2.69 m/s²
Inyokern: 27.2 %g = 0.272 g = 2.67 m/s²
In SI units, the shaking in Ridgecrest peaked at 3.73 m/s², and in Trona and Inyokern at about 2.7 m/s².
3. Compare like with like
Put the three sources side by side in g, including the 2014 map's band for each town:
rows = []
for town, (lat, lon) in TOWNS.items():
    band = POLY[POLY.contains(Point(lon, lat))]["dspga250_15M.PERCENT_G"].iloc[0]
    rows.append({"town": town, "ShakeMap 2019 (g)": shakemap_pga[town] / 100, "2018 model, 2% in 50 yr (g)": pga_2475[town],
                 "2018 model, 10% in 50 yr (g)": pga_475[town], "2014 map band (%g)": band})
print(pd.DataFrame(rows).round(2).to_string(index=False))
town ShakeMap 2019 (g) 2018 model, 2% in 50 yr (g) 2018 model, 10% in 50 yr (g) 2014 map band (%g)
Ridgecrest 0.38 0.72 0.38 40-80
Trona 0.27 0.60 0.33 40-80
Inyokern 0.27 0.63 0.34 40-80
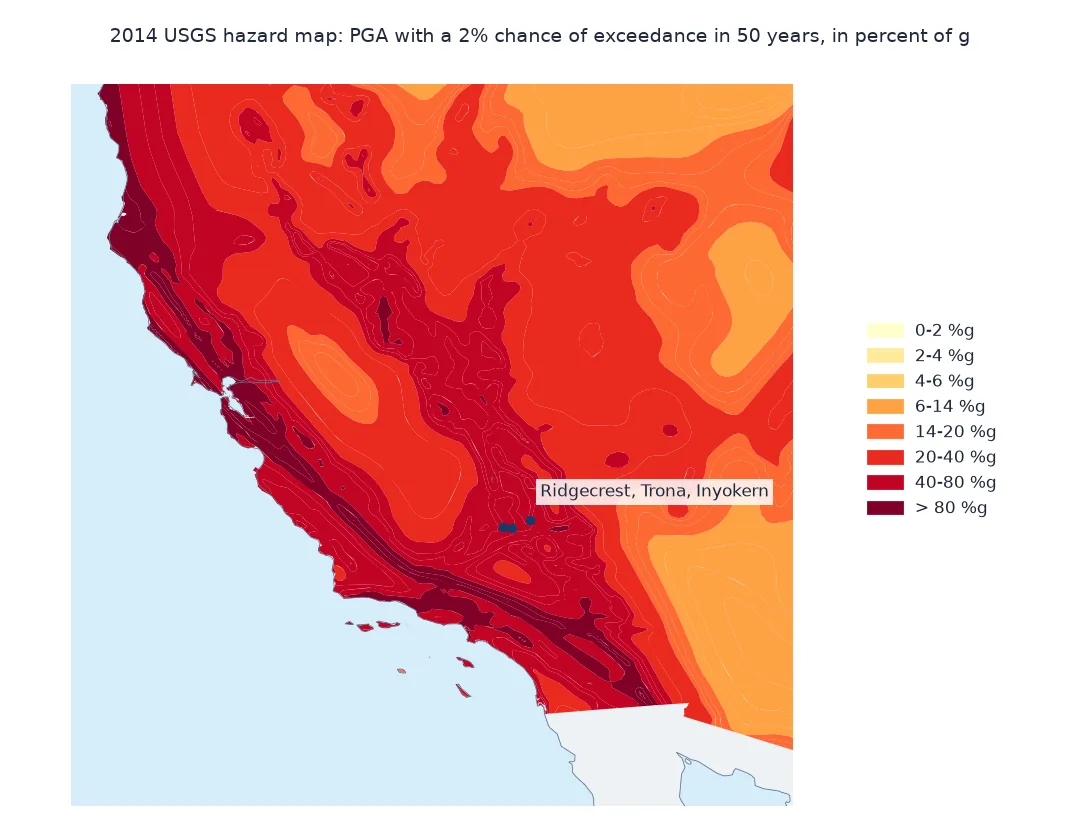
In one unit the comparison is clear. The 2019 shaking matched the 2018 model's 10%-in-50-years level in Ridgecrest, 0.38 g, and was a little below it in Trona and Inyokern; it was about half the 2%-in-50-years level everywhere. All three towns sit in the 2014 map's 40–80% of g band for 2% in 50 years, which agrees with the 2018 model's 0.60–0.72 g once both are in the same unit.
What the unconverted comparison claims
The data used on this page
The preferred ShakeMap grid.xml and stationlist.json for the M7.1 Ridgecrest earthquake of 6 July 2019 (USGS event ci38457511); hazard curves for PGA on rock (Vs30 760 m/s) from the USGS hazard curve service for the 2018 conterminous US model; and the polygons of the 2014 national seismic hazard map of PGA with a 2% probability of exceedance in 50 years. The town coordinates are approximate town centres.
import io
import json
import xml.etree.ElementTree as ET
from pathlib import Path

import geopandas as gpd
import numpy as np
import pandas as pd
import requests
from scipy.spatial import cKDTree
from shapely.geometry import Point

Path("data").mkdir(exist_ok=True)
EV = "ci38457511"
TOWNS = {"Ridgecrest": (35.6225, -117.6709), "Trona": (35.7627, -117.3723), "Inyokern": (35.6469, -117.8126)}
TOWNS_LIST = list(TOWNS)
def cached(path, url, **params):
    p = Path(path)
    if not p.exists():
        r = requests.get(url, params=params, timeout=600)
        r.raise_for_status()
        p.write_bytes(r.content)
    return p
ev = json.loads(cached(f"data/{EV}.json", "https://earthquake.usgs.gov/fdsnws/event/1/query", eventid=EV, format="geojson").read_text())
sm = ev["properties"]["products"]["shakemap"][0]
root = ET.parse(cached(f"data/{EV}_shakemap_{sm['source']}_grid.xml", sm["contents"]["download/grid.xml"]["url"])).getroot()
stations = json.loads(cached(f"data/{EV}_shakemap_{sm['source']}_stationlist.json", sm["contents"]["download/stationlist.json"]["url"]).read_text())
NS = {"s": "http://earthquake.usgs.gov/eqcenter/shakemap"}
G = pd.read_csv(io.StringIO(root.find("s:grid_data", NS).text), sep=r"\s+", header=None,
                names=[f.attrib["name"] for f in root.findall("s:grid_field", NS)])
_, idx = cKDTree(G[["LON", "LAT"]].values).query([(lon, lat) for lat, lon in TOWNS.values()])
shakemap_pga = dict(zip(TOWNS, G.PGA.values[idx]))
hz, pga_2475, pga_475 = {}, {}, {}
for town, (lat, lon) in TOWNS.items():
    p = cached(f"data/nshm2018_{lat}_{lon}_760.json", f"https://earthquake.usgs.gov/ws/nshmp/conus-2018/dynamic/hazard/{lon}/{lat}/760")
    hz[town] = json.loads(p.read_text())
    curve = next(c for c in hz[town]["response"]["hazardCurves"] if c["imt"]["value"] == "PGA")
    total = next(d for d in curve["data"] if d["component"] == "Total")["values"]
    xs, ys = np.array(total["xs"]), np.array(total["ys"])
    ok = ys > 0
    at = lambda rate: float(np.exp(np.interp(np.log(rate), np.log(ys[ok][::-1]), np.log(xs[ok][::-1]))))   # log-log interpolation
    pga_2475[town], pga_475[town] = at(1 / 2475), at(1 / 475)
POLY = gpd.read_file(cached("data/uspga250_2014_15M.geojson",
                            "https://earthquake.usgs.gov/arcgis/rest/services/haz/USpga250_2014/MapServer/102/query",
                            where="1=1", outFields="*", returnGeometry="true", maxAllowableOffset="0.01", f="geojson"))
print(f"ShakeMap grid {len(G):,} points; hazard curves for {len(hz)} towns; 2014 map {len(POLY)} polygons")
ShakeMap grid 275,394 points; hazard curves for 3 towns; 2014 map 363 polygons
The setup reads the 275,394-point ShakeMap grid, a hazard curve for each of the three towns and the 363 polygons of the 2014 map.
Example 1: what the unconverted comparison claims
Show the conclusion each wrong pairing would draw, so the symptom is recognisable:
town = "Ridgecrest"
v = shakemap_pga[town]
print(f"ShakeMap value as stored: {v:.1f}")
print(f"read as g against the 2% in 50 years level: {v / pga_2475[town]:.0f} times the design level")
print(f"read as m/s² against it: {v / (pga_2475[town] * 9.80665):.1f} times")
print(f"converted correctly: {v / 100 / pga_2475[town]:.2f} times")
ShakeMap value as stored: 38.0
read as g against the 2% in 50 years level: 53 times the design level
read as m/s² against it: 5.4 times
converted correctly: 0.53 times
The three pairings give three different stories: 53 times the design level if the stored number is read as g, 5.4 times if it is read as m/s², and 0.53 times when it is converted from percent of g. Only the last is true.
Why acceleration is expressed in g
Peak ground acceleration is naturally expressed as a fraction of the acceleration of gravity, g, because that is how structures feel it: a horizontal acceleration of 0.3 g pushes a building sideways with 30% of its own weight. ShakeMap uses percent of g, which keeps typical values between 0.1 and 100 and avoids long decimals. Hazard models and building codes use g, because design spectra are written that way. Seismologists working with raw records use metres per second squared or cm/s², the gal. None of these is wrong; mixing them is.
The safest habit is to convert once, when reading, and to put the unit into the variable name, pga_g rather than pga. Reading the declared unit rather than assuming it matters too, because the same quantity in two files from the same agency can differ. A check against physical sense catches what slips through: peak ground accelerations above about 2 g have hardly ever been recorded, so a value of 38 cannot be in g.
Spectral accelerations, PGV and gal
- Spectral accelerations: PSA values in ShakeMap (
PSA03,PSA10,PSA30) are in percent of g too; hazard service spectral accelerations are in g. - PGV: velocity is in cm/s in ShakeMap, which is not affected by the factor of 100 problem but is by m/s confusion.
- Site conditions: ShakeMap values include each site's amplification, while the hazard curves here are for rock (Vs30 760 m/s); the comparison is about units and orders of magnitude, not a precise site check.
- Gal: 1 gal = 1 cm/s²; 981 gal ≈ 1 g.
- Logarithms: in ln units a factor of 100 is a shift of 4.6, which can hide inside a regression's intercept.
Internal links
- How to compare ShakeMap station data with the grid in Python — where the percent-of-g values come from
- How to get seismic hazard curves in Python — the hazard service in g
- Ground motion explained — what PGA measures
FAQ
Is ShakeMap PGA in g or percent of g?
Percent of g: a value of 25 means 0.25 g. The unit is declared in the units attribute of each field in grid.xml and with each amplitude in stationlist.json.
How do I convert percent of g to m/s²?
Divide by 100 to get g, then multiply by 9.80665.
What units do USGS hazard curves use?
The hazard curve service gives ground motion in g, with annual frequency of exceedance on the other axis.
How can I tell which unit a PGA value is in?
Read the metadata, and check the size: PGA in g is almost always below 2, so values in the tens are percent of g or m/s² at most.