
How to Map "Did You Feel It?" Earthquake Intensity Reports in Python
On this page
Problem statement
Seismometers measure ground motion at a few hundred points; people feel it everywhere. The USGS "Did You Feel It?" (DYFI) system turns tens of thousands of online questionnaires after an earthquake into community decimal intensities (CDI) on the Modified Mercalli scale, aggregated to 10 km and 1 km boxes, and those reports reach places, distances and building types that no network covers. Using them well means reading the product files, filtering out boxes with too few or suspect responses, and knowing how they compare with the instrumental picture in ShakeMap.
This page downloads the DYFI 10 km product for the 2019 M7.1 Ridgecrest, California, earthquake, measures how intensity falls off with distance, compares each box with the ShakeMap intensity at the same place, and finds how far away the earthquake was felt.
Quick answer
Read the geocoded 10 km boxes from the event's DYFI product and summarise intensity by distance:
print(f"{D.nresp.sum():,} responses in {len(D):,} boxes of 10 km; maximum CDI {D.cdi.max()} at {D.loc[D.cdi.idxmax(), 'dist']} km")
bands = pd.cut(D.dist, [0, 25, 50, 100, 200, 400, 800, 1600])
print(D.groupby(bands, observed=True).agg(boxes=("cdi", "size"), responses=("nresp", "sum"), median_cdi=("cdi", "median")).to_string())
39,199 responses in 1,387 boxes of 10 km; maximum CDI 8.7 at 2 km
boxes responses median_cdi
dist
(0, 25] 12 384 7.4
(25, 50] 4 4 4.1
(50, 100] 59 323 4.8
(100, 200] 339 16348 3.9
(200, 400] 584 19753 3.1
(400, 800] 348 2344 2.0
(800, 1600] 41 43 1.0
39,199 responses fall in the 1,387 boxes. The highest intensity, CDI 8.7, is in a box 2 km from the rupture. Intensity falls with distance, from a median of 7.4 within 25 km to 3.9 at 100–200 km, 3.1 at 200–400 km and 2.0 at 400–800 km. Most responses come from 100 to 400 km away, where Los Angeles, Las Vegas and the Central Valley are; the band from 25 to 50 km, mostly desert, has four boxes and four responses.
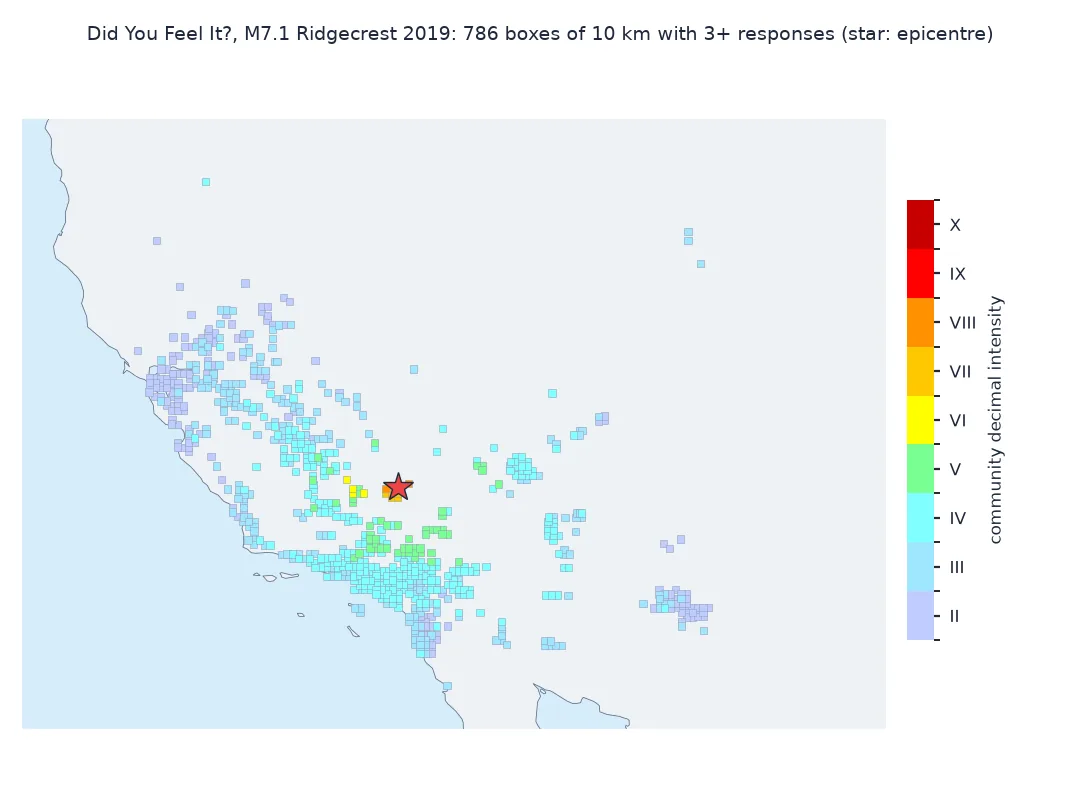
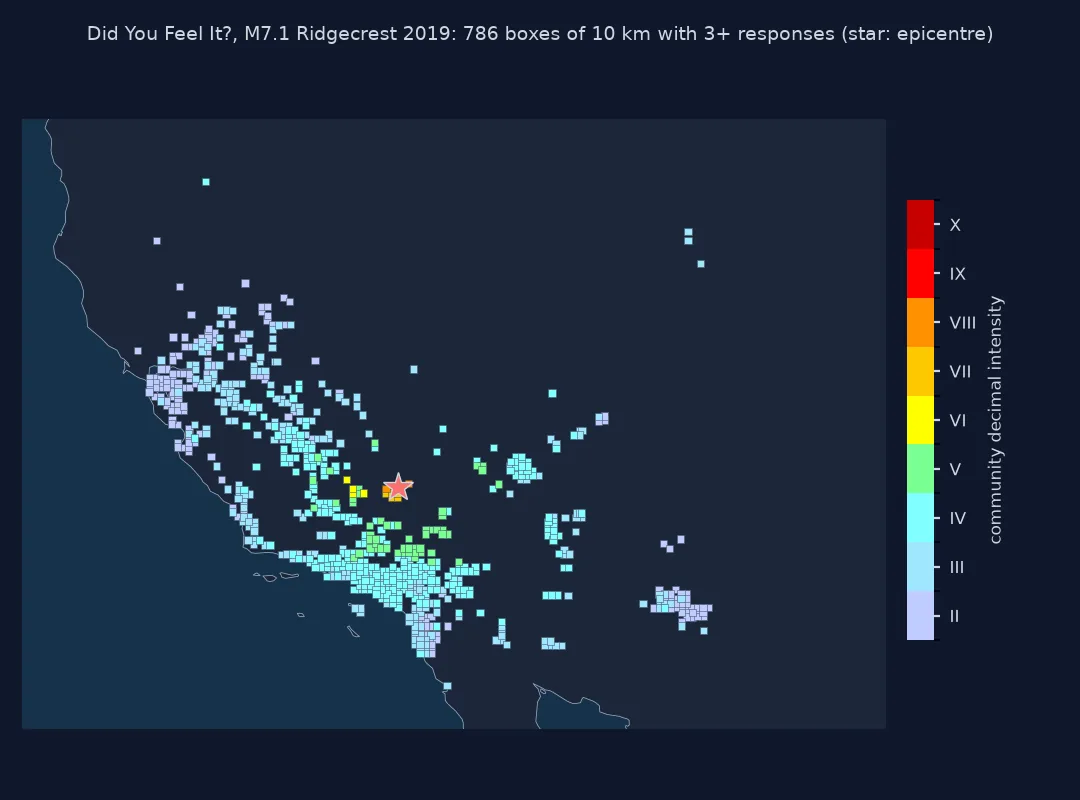
Trustworthy boxes, ShakeMap comparison, how far it was felt
1. Filter boxes you can trust
A box with one response is one person's impression. DYFI flags suspect boxes and gives a standard deviation; keep boxes with several responses that are not flagged:
good = D[(D.suspect == 0) & (D.nresp >= 3)]
print(f"suspect boxes: {int((D.suspect != 0).sum())}; boxes with 1-2 responses: {int((D.nresp < 3).sum()):,} ({(D.nresp < 3).mean():.0%})")
print(f"kept: {len(good):,} boxes with {good.nresp.sum():,} responses ({good.nresp.sum() / D.nresp.sum():.0%} of all)")
print(f"median standard deviation: kept {good.sd.median():.2f}, single-response boxes {D[D.nresp == 1].sd.median():.2f}")
suspect boxes: 0; boxes with 1-2 responses: 601 (43%)
kept: 786 boxes with 38,442 responses (98% of all)
median standard deviation: kept 0.23, single-response boxes 0.33
No box is flagged as suspect in this file, but 601 of the 1,387 boxes, 43%, have only one or two responses. Dropping them keeps 786 boxes and 98% of all responses: the thin boxes are many but carry few reports. Their median standard deviation, 0.33 for single responses against 0.23, shows how much less certain they are.
2. Compare with ShakeMap
ShakeMap estimates intensity on a grid from seismic stations, DYFI and a ground-motion model. Sample its MMI grid at each DYFI box centre:
tree = cKDTree(G[["LON", "LAT"]].values)
d, i = tree.query(good[["lon", "lat"]].values)
inside = d < 0.02
cmp = good[inside].assign(shakemap=G.MMI.values[i[inside]])
cmp["diff"] = cmp.cdi - cmp.shakemap
print(f"boxes inside the ShakeMap grid: {len(cmp):,} of {len(good):,}")
print(cmp.groupby(pd.cut(cmp.dist, [0, 50, 100, 200, 400]), observed=True)["diff"].agg(["size", "mean", "std"]).round(2).to_string())
boxes inside the ShakeMap grid: 723 of 786
size mean std
dist
(0, 50] 8 -0.22 2.07
(50, 100] 29 0.25 0.51
(100, 200] 239 0.04 0.34
(200, 400] 356 -0.10 0.39
723 of the 786 kept boxes fall inside the ShakeMap grid. From 50 to 400 km, DYFI and ShakeMap agree closely: the mean difference is between -0.10 and +0.25 intensity units in each band, with a spread of 0.34 to 0.51. Within 50 km the 8 boxes scatter by 2.07 units, because intensity changes fast near the rupture and a 10 km box averages very different places.
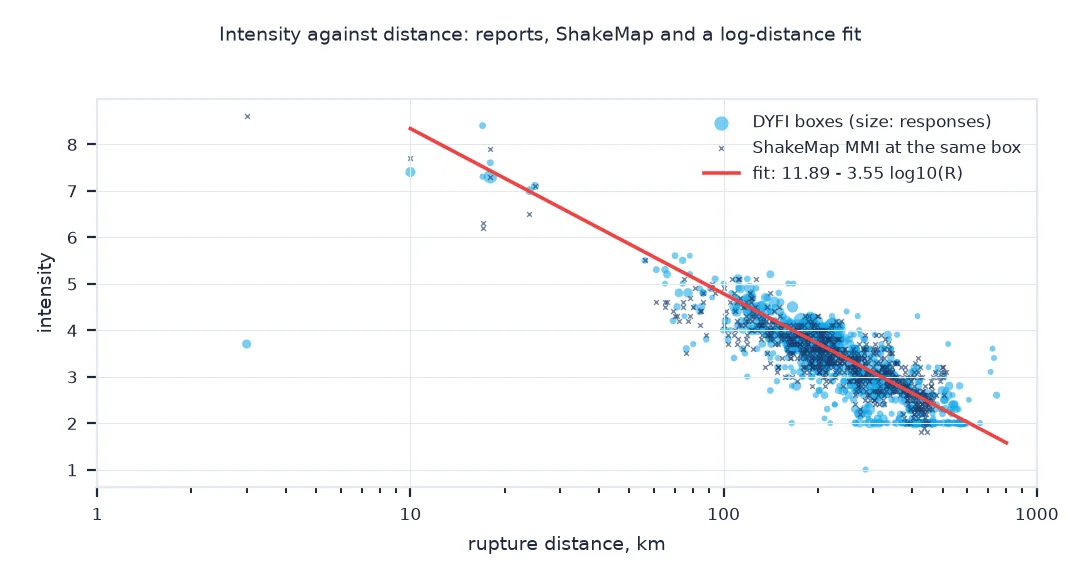
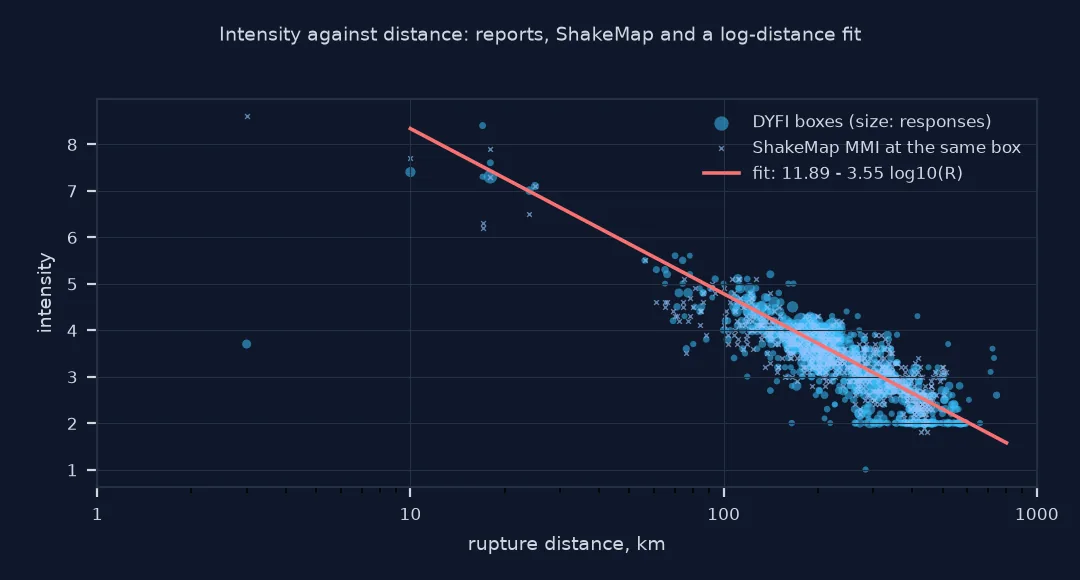
3. How far it was felt
The felt area is a classic measure of an earthquake's size. Find the farthest boxes at each intensity:
for level in (2, 3, 4, 5, 6):
    sub = good[good.cdi >= level]
    far = sub.loc[sub.dist.idxmax()]
    print(f"CDI {level}+: {len(sub):>5,} boxes; farthest at {far.dist:,} km ({far.lat:.2f}, {far.lon:.2f})")
CDI 2+: 785 boxes; farthest at 744 km (40.78, -111.89)
CDI 3+: 501 boxes; farthest at 730 km (40.60, -111.89)
CDI 4+: 163 boxes; farthest at 416 km (38.52, -121.11)
CDI 5+: 24 boxes; farthest at 167 km (34.29, -116.40)
CDI 6+: 7 boxes; farthest at 25 km (35.65, -117.83)
The earthquake was reported at intensity 2 or more as far as 744 km away, and at intensity 3 at 730 km, both in the Salt Lake City area, from boxes with 11 and 3 responses. Intensity 4 reached 416 km, east of Sacramento; 5, 167 km; and 6, 25 km from the rupture. The unfiltered file has single responses of CDI 1 as far as 1,422 km away, in Washington state, which is why the filter matters for a felt-area figure.
An intensity attenuation curve for Ridgecrest
The data used on this page
The DYFI product for the M7.1 Ridgecrest earthquake of 6 July 2019 (USGS event ci38457511), file cdi_geo_10km.txt, and the preferred ShakeMap's grid.xml, both found through the event's entry in the USGS FDSN event service. The setup saves the event's JSON once, so the product versions it points to stay fixed for later runs.
import io
import json
import xml.etree.ElementTree as ET
from pathlib import Path

import numpy as np
import pandas as pd
import requests
from scipy.spatial import cKDTree

Path("data").mkdir(exist_ok=True)
EV = "ci38457511"
p = Path(f"data/{EV}.json")
if not p.exists():
    r = requests.get("https://earthquake.usgs.gov/fdsnws/event/1/query", params={"eventid": EV, "format": "geojson"}, timeout=120)
    r.raise_for_status()
    p.write_text(r.text)
ev = json.loads(p.read_text())
def product_file(kind, name):
    pr = ev["properties"]["products"][kind][0]                                   # the preferred product comes first
    out = Path(f"data/{EV}_{kind}_{pr['source']}_{Path(name).name}")
    if not out.exists():
        r = requests.get(pr["contents"][name]["url"], timeout=600)
        r.raise_for_status()
        out.write_bytes(r.content)
    return out, pr
cdi_path, dyfi = product_file("dyfi", "cdi_geo_10km.txt")
D = pd.read_csv(cdi_path, comment="#", header=None,
                names=["box", "cdi", "nresp", "dist", "lat", "lon", "suspect", "sd", "city", "state"])
grid_path, shakemap = product_file("shakemap", "download/grid.xml")
root = ET.parse(grid_path).getroot()
NS = {"s": "http://earthquake.usgs.gov/eqcenter/shakemap"}
fields = [f.attrib["name"] for f in root.findall("s:grid_field", NS)]
G = pd.read_csv(io.StringIO(root.find("s:grid_data", NS).text), sep=r"\s+", header=None, names=fields)
print(f"DYFI: {len(D):,} boxes; ShakeMap from '{shakemap['source']}', version {shakemap['properties']['version']}: {len(G):,} grid points, fields {fields}")
DYFI: 1,387 boxes; ShakeMap from 'atlas', version 1: 275,394 grid points, fields ['LON', 'LAT', 'MMI', 'PGA', 'PGV', 'PSA03', 'PSA10', 'PSA30', 'SVEL']
The DYFI file has 1,387 boxes of 10 km. The preferred ShakeMap is the ShakeMap Atlas version, a 275,394-point grid carrying MMI, PGA, PGV, three spectral accelerations and the site shear-wave velocity.
Example 1: an intensity attenuation curve
Fit CDI against the logarithm of distance, weighting boxes by their number of responses, and compare the fit with the binned medians:
far = good[good.dist >= 10]
coef = np.polyfit(np.log10(far.dist), far.cdi, 1, w=np.sqrt(far.nresp))
print(f"CDI = {coef[1]:.2f} {coef[0]:+.2f} log10(R)")
for r in (10, 30, 100, 300, 600):
    near = far[(far.dist > r / 1.2) & (far.dist < r * 1.2)]
    seen = f"median of {len(near)} boxes within 20% {near.cdi.median():.1f}" if len(near) else "no boxes within 20%"
    print(f"R = {r:>3} km: fit {np.polyval(coef, np.log10(r)):.1f}; {seen}")
CDI = 11.89 -3.55 log10(R)
R = 10 km: fit 8.3; median of 1 boxes within 20% 7.4
R = 30 km: fit 6.6; no boxes within 20%
R = 100 km: fit 4.8; median of 40 boxes within 20% 4.5
R = 300 km: fit 3.1; median of 179 boxes within 20% 3.0
R = 600 km: fit 2.0; median of 44 boxes within 20% 2.0
Intensity falls by 3.55 units for every tenfold increase in distance. The fit matches the medians of nearby boxes to within 0.3 units at 100, 300 and 600 km. Near the rupture it overshoots, 8.3 against a single box at 7.4, and at 30 km there are no boxes to test it: a straight line in log distance is a far-field description.
How community intensity is computed
Community decimal intensity is computed from the answers to a fixed questionnaire: did you feel it, did objects fall, was furniture moved, was there damage, weighted and combined by an algorithm calibrated to traditional Modified Mercalli intensities. Responses are geocoded and averaged in boxes, so the intensity of a box is a mean of the experiences reported there, with a standard deviation that shrinks as responses accumulate. A box with a single response can be anything from a sensitive person on an upper floor to a heavy sleeper.
The comparison with ShakeMap is not a test of two independent measurements: ShakeMap uses DYFI intensities as one of its inputs, alongside station recordings converted to intensity and a ground-motion model where data are sparse. Where they differ, it is usually at distances where few stations exist and the conversion between ground motion and intensity is least certain. DYFI's strength is coverage: it records intensity in places with no instruments at all, out to distances where the shaking was barely felt.
Population, product versions and distance
- Population drives coverage: boxes exist only where people live and respond; in empty desert, DYFI has gaps that are not low intensity.
- Product versions: DYFI keeps accepting responses and is updated for years; record the product's update time with any numbers.
- 1 km boxes: the 1 km product resolves neighbourhoods but most boxes have one or two responses.
- Distance: the rupture distance in the file is to the fault, not the epicentre; for a 50 km rupture the two differ greatly near the source.
Internal links
- How to read a USGS ShakeMap and find who was shaken — the grid file
- How to compare ShakeMap station data with the grid in Python — the instrumental side
- Ground motion explained — intensity, PGA and PGV
FAQ
What is Did You Feel It?
A USGS system that collects online reports from people who felt an earthquake and converts them into Modified Mercalli intensities, aggregated by location.
How do I download DYFI data in Python?
Get the event's GeoJSON from the USGS event service, find the dyfi product, and download one of its files, such as cdi_geo_10km.txt or dyfi_geo_10km.geojson, from the URL in its contents.
Is DYFI intensity the same as ShakeMap intensity?
They are on the same scale and usually agree within about one unit, but DYFI is from reports and ShakeMap is an estimate that combines stations, DYFI and a ground-motion model.
How far away was the Ridgecrest earthquake felt?
In DYFI reports, as far as 744 km away in the Salt Lake City area at intensity 2, and 416 km away, east of Sacramento, at intensity 4.