
How to Compare Buoy Water Temperature with Satellite SST in Python
On this page
Problem statement
Gridded sea surface temperature products such as OISST are analyses: satellite measurements adjusted to, and blended with, measurements from ships and buoys. A moored buoy measures the water at one point, every few minutes, at a known depth. Comparing the two is how to judge whether a gridded product can be trusted at a particular place, and it is also a lesson in what each one measures, because they differ in depth, footprint and timing even when both are right.
This page reads a year of 10-minute observations from NOAA buoy 44025, 30 nautical miles south of Long Island, removes its missing-value codes, compares its daily mean water temperature with the OISST cell it sits in, and looks at the daily cycle the daily product cannot show.
Quick answer
Read the NDBC text file, replace the 999 codes, average to days, and line it up with OISST for the nearest cell:
wt = B.WTMP.where(B.WTMP < 99).resample("D").mean()
both = pd.DataFrame({"buoy": wt, "oisst": O}).dropna()
d = both.oisst - both.buoy
print(f"days with both: {len(both)}; bias (OISST - buoy) {d.mean():+.2f} °C; RMS difference {np.sqrt((d ** 2).mean()):.2f} °C; r = {both.corr().iloc[0, 1]:.3f}")
days with both: 352; bias (OISST - buoy) -0.09 °C; RMS difference 0.59 °C; r = 0.996
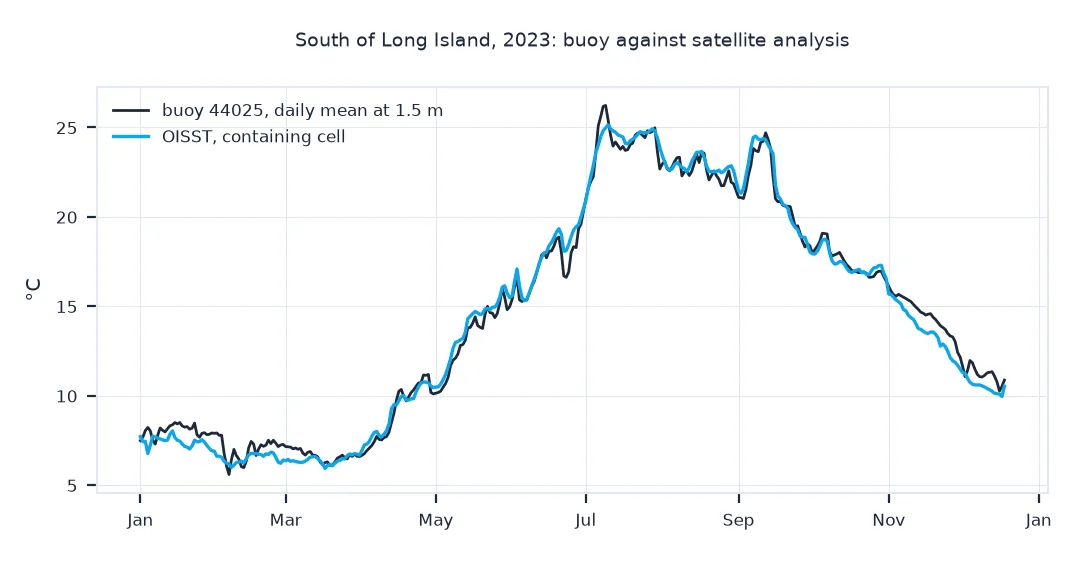
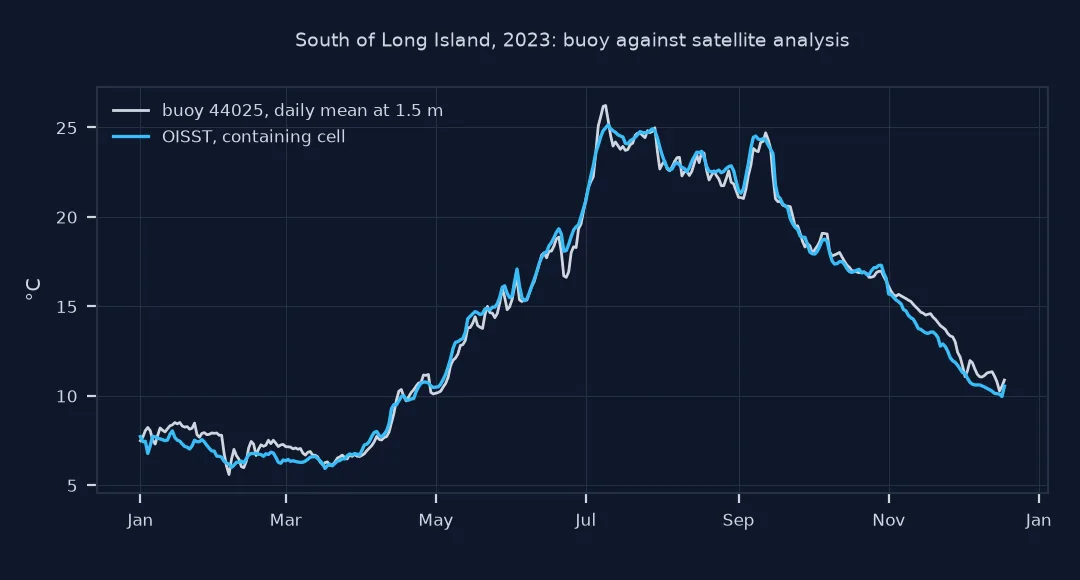
On the 352 days of 2023 with both, OISST is 0.09 °C cooler than the buoy's daily mean on average, with an RMS difference of 0.59 °C and a correlation of 0.996: over a year, the analysis follows the buoy closely.
Read NDBC codes, find the buoy's cell, explain disagreement
1. Read the NDBC file and its codes
NDBC's standard meteorological files are whitespace-separated with two header lines, the second giving units. Missing values are coded with nines, 999.0 for water temperature:
print(f"rows: {len(B):,}, from {B.index.min():%d %b %Y %H:%M} to {B.index.max():%d %b %Y %H:%M}")
print(f"interval: {B.index.to_series().diff().mode()[0]}; WTMP coded missing (999): {(B.WTMP >= 99).sum():,} ({(B.WTMP >= 99).mean():.1%})")
print(f"water temperature range: {B.WTMP[B.WTMP < 99].min():.1f} to {B.WTMP[B.WTMP < 99].max():.1f} °C")
rows: 50,497, from 01 Jan 2023 00:00 to 18 Dec 2023 13:00
interval: 0 days 00:10:00; WTMP coded missing (999): 418 (0.8%)
water temperature range: 5.4 to 27.1 °C
The file holds 50,497 ten-minute records from 1 January to 18 December 2023, when the record stops. 418 water temperatures, 0.8%, are coded 999. The real values run from 5.4 °C in winter to 27.1 °C in summer.
2. Which OISST cell the buoy is in
Ask ERDDAP for the cell containing the buoy's position; the nearest cell centre is up to 0.125° away in each direction:
clon = float(cell.longitude)
print(f"buoy at {LAT:.3f} N, {abs(LON):.3f} W; OISST cell centre {float(cell.latitude):.3f} N, {abs(clon):.3f} W")
print(f"distance between them: {geod.inv(LON, LAT, clon, float(cell.latitude))[2] / 1000:.1f} km; OISST days: {O.notnull().sum()}")
buoy at 40.258 N, 73.175 W; OISST cell centre 40.375 N, 73.125 W
distance between them: 13.7 km; OISST days: 365
The buoy sits 13.7 km from the centre of its OISST cell, and NCEI's copy of OISST has all 365 days of 2023.
3. When they disagree
Look at the difference month by month, and at the largest single-day differences:
m = d.groupby(d.index.month).agg(["mean", "std"]).round(2)
m.index = pd.to_datetime(m.index, format="%m").strftime("%b")
print(m.T.to_string())
print(d.abs().nlargest(3).round(2).rename("largest |OISST - buoy|, °C").to_string())
Jan Feb Mar Apr May Jun Jul Aug Sep Oct Nov Dec
mean -0.63 -0.48 -0.25 0.08 0.48 0.45 0.09 0.26 0.22 -0.08 -0.82 -0.65
std 0.44 0.49 0.32 0.38 0.23 0.48 0.61 0.34 0.47 0.28 0.31 0.37
2023-06-24 1.53
2023-06-23 1.49
2023-01-04 1.45
The difference has a seasonal pattern: OISST is about 0.5 to 0.8 °C cooler than the buoy from November to February, and about 0.5 °C warmer in May and June. The largest single-day differences, around 1.5 °C, are in late June and early January.
The daily cycle a daily product cannot show
The data used on this page
Standard meteorological data for 2023 from NOAA National Data Buoy Center station 44025 (40.258°N, 73.175°W), whose water temperature sensor is 1.5 m below the waterline, and daily OISST v2.1 for the containing cell from NOAA CoastWatch's ERDDAP, with the 12 days of 2023 it lacks taken from NCEI's daily files.
import gzip
import io
import time
from pathlib import Path

import numpy as np
import pandas as pd
import requests
import xarray as xr
from pyproj import Geod

Path("data").mkdir(exist_ok=True)
LAT, LON = 40.258, -73.175
CW = "https://coastwatch.pfeg.noaa.gov/erddap/griddap"
ARCHIVE = "https://www.ncei.noaa.gov/data/sea-surface-temperature-optimum-interpolation/v2.1/access/avhrr"
def _get(url):
    for attempt in range(5):                                            # a busy ERDDAP answers 500 or 503
        r = requests.get(url, timeout=900)
        if r.status_code < 500:
            break
        time.sleep(30 * (attempt + 1))
    r.raise_for_status()
    return r
def _lon180(da):
    return da.assign_coords(longitude=(da.longitude + 180) % 360 - 180).sortby("longitude")
def oisst(start, end, path, var="sst", lat=(52, 54), lon=(-12, -10), step=1):
    """Daily OISST v2.1 for a box and dates, saved to path, longitudes -180 to 180. CoastWatch's ERDDAP
    aggregation (version 2 before 2016, the same analysis as v2.1 for those years), with every day it
    lacks taken from NCEI's daily archive: the aggregations skip days, and a skipped day is silent."""
    path = Path(path)
    if not path.exists():
        days = pd.date_range(start, end)
        ds = "ncdcOisst2Agg" if days[-1].year <= 2015 else "ncdcOisst21Agg"
        a, b = lon[0] % 360, lon[1] % 360
        got = []
        for lo in [(a, b)] if a <= b else [(a, 359.875), (0.125, b)]:          # across 0°, two requests
            q = (f"{var}[({start}T12:00:00Z):1:({end}T12:00:00Z)][(0.0)]"
                 f"[({lat[0]}):{step}:({lat[1]})][({lo[0]}):{step}:({lo[1]})]")
            got.append(xr.open_dataset(io.BytesIO(_get(f"{CW}/{ds}.nc?{q}").content))[var].load())
        da = _lon180(xr.concat(got, "longitude").squeeze("zlev", drop=True))
        da = da.sel(time=slice(start, f"{end}T23:59"))                       # a missing end day snaps past it
        for day in days.difference(pd.DatetimeIndex(da.time.values).normalize()):
            url = f"{ARCHIVE}/{day:%Y%m}/oisst-avhrr-v02r01.{day:%Y%m%d}.nc"
            d = xr.open_dataset(io.BytesIO(_get(url).content))[var].squeeze("zlev", drop=True)
            d = _lon180(d.rename(lat="latitude", lon="longitude"))
            d = d.sel(latitude=da.latitude, longitude=da.longitude, method="nearest")
            da = xr.concat([da, d.assign_coords(latitude=da.latitude, longitude=da.longitude).load()], "time")
        da.sortby("time").to_dataset(name=var).to_netcdf(path)
    return xr.open_dataset(path)[var]
geod = Geod(ellps="WGS84")
p = Path("data/44025h2023.txt.gz")
if not p.exists():
    p.write_bytes(requests.get("https://www.ndbc.noaa.gov/data/historical/stdmet/44025h2023.txt.gz", timeout=300).content)
B = pd.read_csv(io.StringIO(gzip.decompress(p.read_bytes()).decode()), sep=r"\s+", skiprows=[1])
B.index = pd.to_datetime(B[["#YY", "MM", "DD", "hh", "mm"]].astype(str).agg(" ".join, axis=1), format="%Y %m %d %H %M")
q = Path("data/oisst_44025_2023.nc")
cell = oisst("2023-01-01", "2023-12-31", q, "sst", (LAT, LAT), (LON, LON)).squeeze()   # one cell: time remains
O = cell.to_series()
O.index = O.index.normalize()
print(f"buoy file {p.stat().st_size / 1e3:.0f} kB, {B.shape[1]} columns; OISST file {q.stat().st_size / 1e3:.0f} kB")
buoy file 496 kB, 18 columns; OISST file 21 kB
The buoy's year is a 496 kB compressed text file with 18 columns; the OISST series for one cell is 21 kB.
Example 1: the daily cycle the daily product cannot show
On calm, sunny days the top metre warms in the afternoon and cools at night. Measure the range within each day at the buoy:
w = B.WTMP.where(B.WTMP < 99)
rng = (w.resample("D").max() - w.resample("D").min()).dropna()
print(f"median daily range: {rng.median():.2f} °C; days with a range over 1 °C: {(rng > 1).sum()}")
by_month = rng.groupby(rng.index.month).median()
print(f"largest monthly median: {by_month.max():.2f} °C in {pd.Timestamp(2023, by_month.idxmax(), 1):%B}; smallest {by_month.min():.2f} °C")
median daily range: 0.60 °C; days with a range over 1 °C: 91
largest monthly median: 1.30 °C in July; smallest 0.20 °C
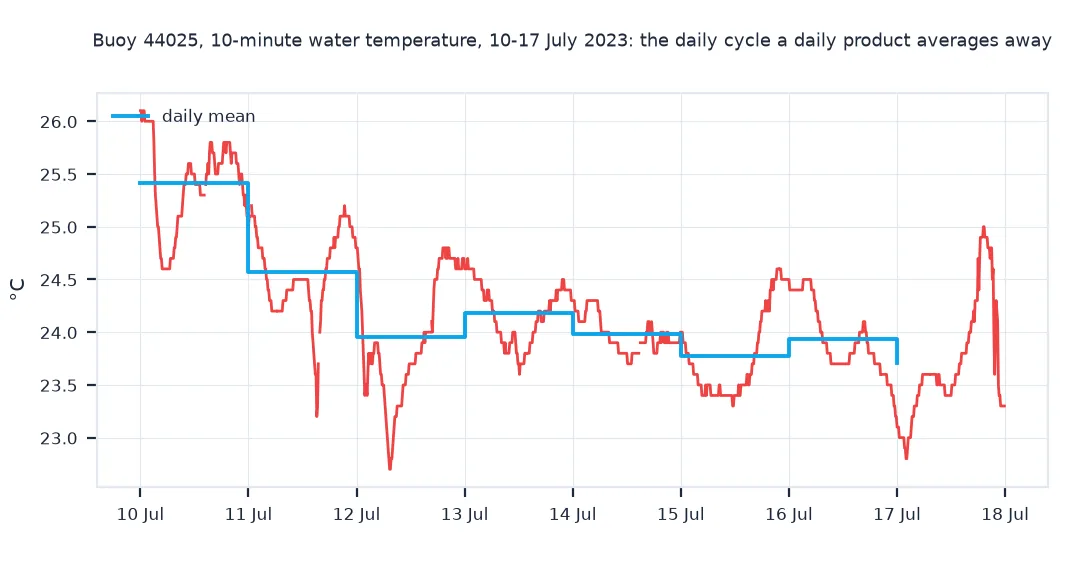
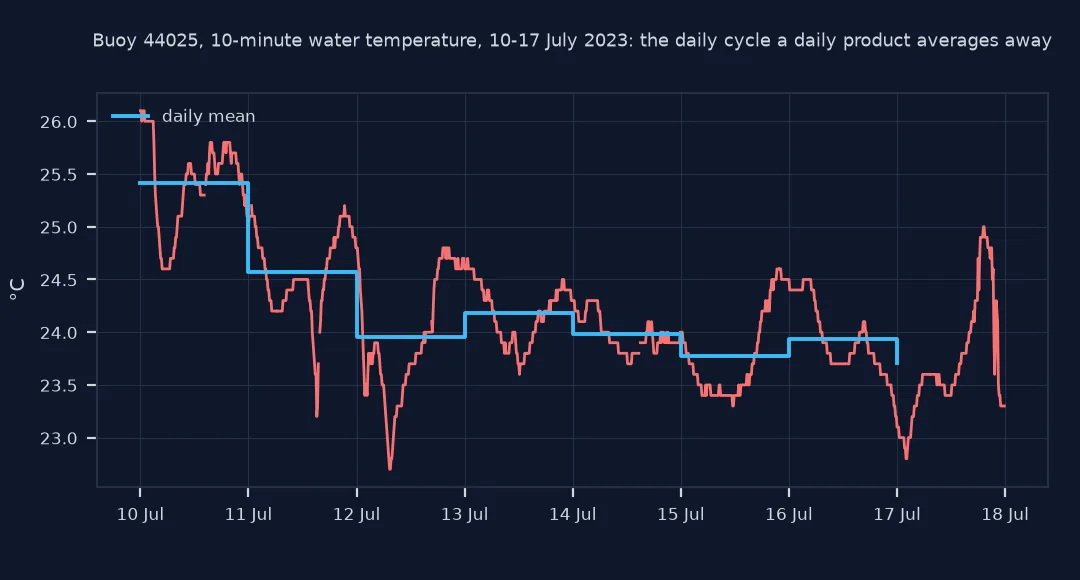
The water at 1.5 m varies by a median of 0.60 °C within a day, and by more than 1 °C on 91 days. The daily cycle is largest in July, a median of 1.30 °C, and smallest in winter, 0.20 °C: a daily mean hides it entirely.
A buoy and an analysis measure different things
The buoy and the analysis measure different things. The buoy samples water 1.5 m below the surface every 10 minutes at one point. OISST is a daily average for a cell about 21 km by 28 km at this latitude, built from satellite infrared measurements of the top fraction of a millimetre, adjusted to match buoys and ships at depths of around a metre, and interpolated where clouds hide the sea. Daily means remove the buoy's daily cycle; the cell average removes small-scale structure such as fronts and upwelling filaments; and the interpolation smooths quick changes when several cloudy days leave the analysis with few observations.
Buoys like this one are among the observations OISST is adjusted to, so close agreement is expected and is not an independent test. Where the two diverge for days at a time, the cause is usually real structure within the cell, such as a front passing the buoy, or a storm mixing cold water to the surface faster than the analysis follows. A comparison over a year, rather than a day, is what tells whether a gridded product is good enough at a place.
Missing-value codes, time zones and sensor depth
- Missing-value codes differ by column: 99.0 for wave height, 999.0 for temperatures and pressure, 9999.0 for some others; filter each column by its own code, or as here, by an impossible range.
- Time zone: NDBC times are UTC; OISST days are UTC days labelled at 12:00.
- Sensor depth: depths vary by buoy and change with hull type; check the station page before comparing buoys.
- Recent data: the most recent 45 days are in the realtime files, not the historical ones, and are not quality-controlled.
Internal links
- How to download NOAA OISST sea surface temperature in Python — the gridded product
- How to fetch and align tide gauge data in Python — another NOAA station network
- Sea surface temperature explained — skin, sub-skin and bulk temperatures
FAQ
How do I download NDBC buoy data in Python?
Download the yearly standard meteorological file, for example https://www.ndbc.noaa.gov/data/historical/stdmet/44025h2023.txt.gz, read it with pandas.read_csv(sep=r"\s+") skipping the units line, and build timestamps from the date columns.
What does 999 mean in NDBC buoy data?
It is a missing-value code; water and air temperature use 999.0. Replace it before averaging.
How accurate is OISST compared with buoys?
At buoy 44025 in 2023, the daily difference between OISST and the buoy is given in the quick answer: bias and RMS difference are a fraction of a degree, with larger differences on individual days.
Why does satellite SST differ from buoy water temperature?
They measure different depths, a cell average against a point, and a daily average against instantaneous values; on calm sunny days the surface also warms more than the water a metre down.