
How to Check Model Winds Against Station Observations in Python
On this page
Problem statement
A gridded wind field looks authoritative, and the only way to know how far to trust it is to compare it with measurements. Weather stations are the obvious reference, and the comparison has more decisions in it than it seems: which stations, which report time, how to get the model value at a point, how to compare directions, and which summary numbers to report. Done carefully, it tells you not just how good a model is but where it is good, which is usually the more useful answer.
This page compares the 10-metre wind of two models, the 0.25° GFS and the 3 km HRRR, both analyses for 00 UTC on 27 September 2024, with about 200 airport stations in Florida, Georgia, Alabama and South Carolina as Hurricane Helene approached.
Quick answer
Get the model value at each station, then report bias and root-mean-square error of speed, overall and by distance from the storm:
def scores(model, obs):
    e = model - obs
    return pd.Series({"bias": e.mean(), "rmse": np.sqrt((e ** 2).mean()), "n": len(e)})

S["gfs_speed"] = np.hypot(GFS_AT.u10.values, GFS_AT.v10.values)
S["hrrr_speed"] = np.hypot(HRRR_U, HRRR_V)
table = pd.DataFrame({m: scores(S[f"{m}_speed"], S.obs_speed) for m in ("gfs", "hrrr")}).T
print(f"{len(S)} stations with a 00 UTC wind report")
print(table.round(2).to_string())
200 stations with a 00 UTC wind report
bias rmse n
gfs 1.61 2.69 200.0
hrrr -0.05 1.52 200.0
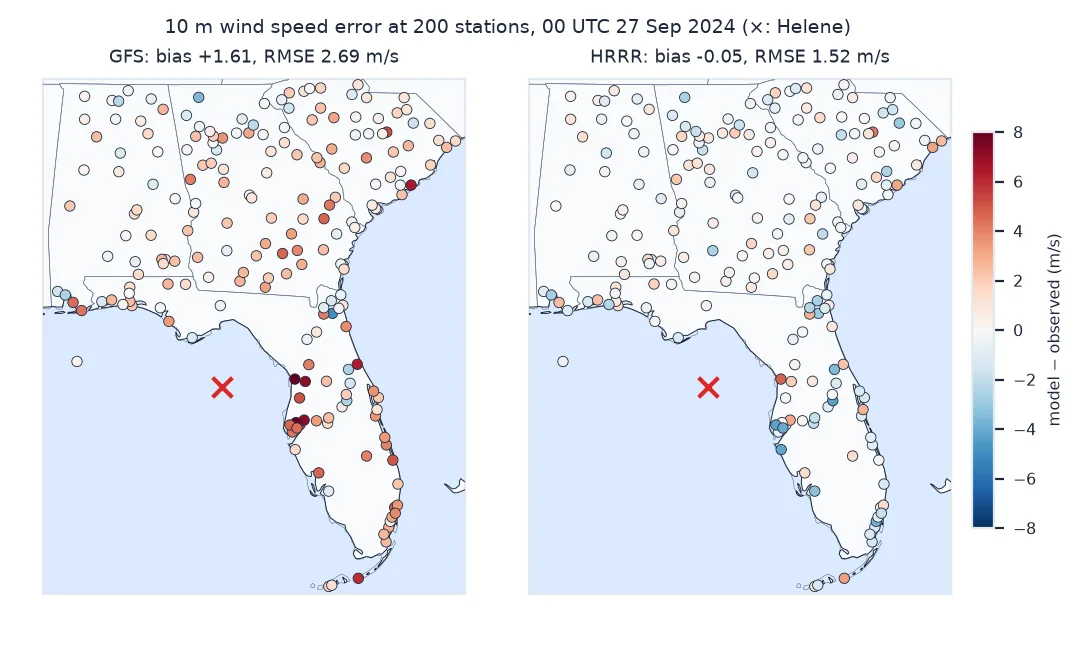
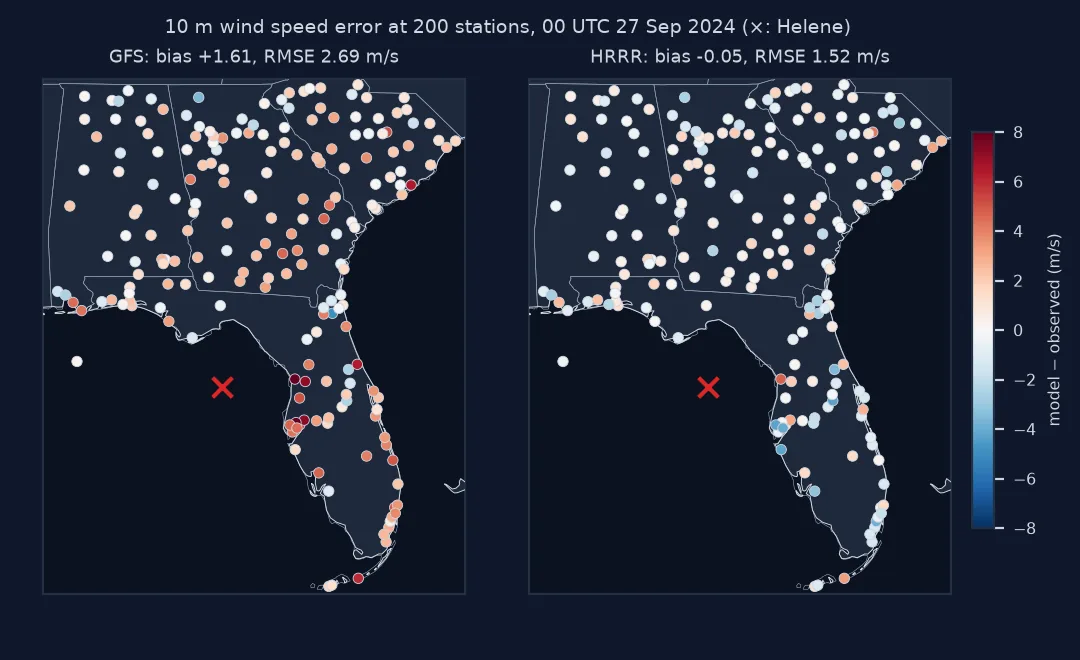
Stations and a report time, model values at them, scores by distance
1. Choose stations and a report time
ISD-Lite gives one record per station per hour, the observation nearest the top of the hour, with direction in degrees and speed in tenths of a metre per second; -9999 is missing:
print(f"stations listed: {len(STATIONS)}; with a file for 2024: {len(FILES)}; with a 00 UTC record: {len(OBS)}")
print(f"missing speed: {(OBS.ws == -9999).sum()}; missing direction: {(OBS.wd == -9999).sum()}; calm (speed 0): {(OBS.ws == 0).sum()}")
stations listed: 222; with a file for 2024: 222; with a 00 UTC record: 202
missing speed: 2; missing direction: 9; calm (speed 0): 7
2. Get the model at the stations
The GFS is on a regular latitude-longitude grid, so bilinear interpolation is one call. HRRR's grid is projected, so the nearest grid point is found with a KD-tree in the projection's metres, and its winds are rotated to true north:
print(f"nearest HRRR grid point: median {np.median(HRRR_DIST) / 1000:.2f} km away, farthest {HRRR_DIST.max() / 1000:.2f} km")
print(f"HRRR rotation at the stations: {np.degrees(ALPHA).min():.1f}° to {np.degrees(ALPHA).max():.1f}°")
nearest HRRR grid point: median 1.13 km away, farthest 2.04 km
HRRR rotation at the stations: 5.8° to 11.7°
3. Score by distance from the storm
An overall score hides where the errors are. Splitting by distance from Helene's best-track position separates the storm from the background:
S["near"] = np.where(S.km < 300, "within 300 km", "beyond 300 km")
for m in ("gfs", "hrrr"):
    print(m.upper(), S.groupby("near").apply(lambda d: scores(d[f"{m}_speed"], d.obs_speed), include_groups=False).round(2).to_string(), sep="\n")
GFS
bias rmse n
near
beyond 300 km 1.41 2.36 162.0
within 300 km 2.47 3.81 38.0
HRRR
bias rmse n
near
beyond 300 km 0.02 1.37 162.0
within 300 km -0.32 2.04 38.0
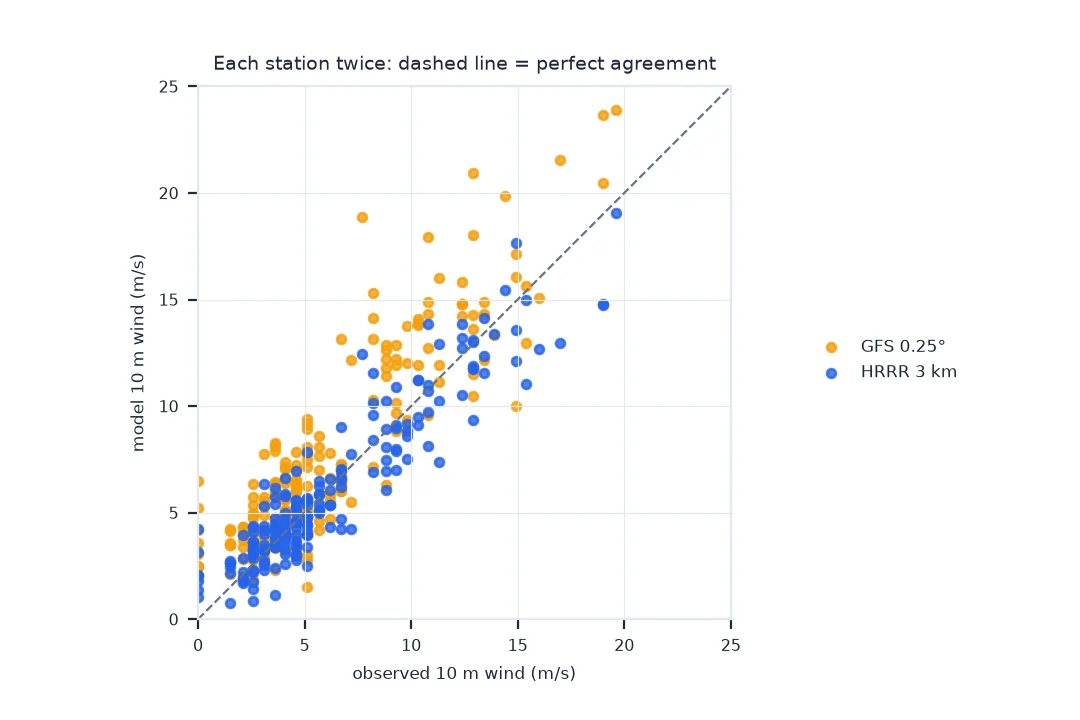
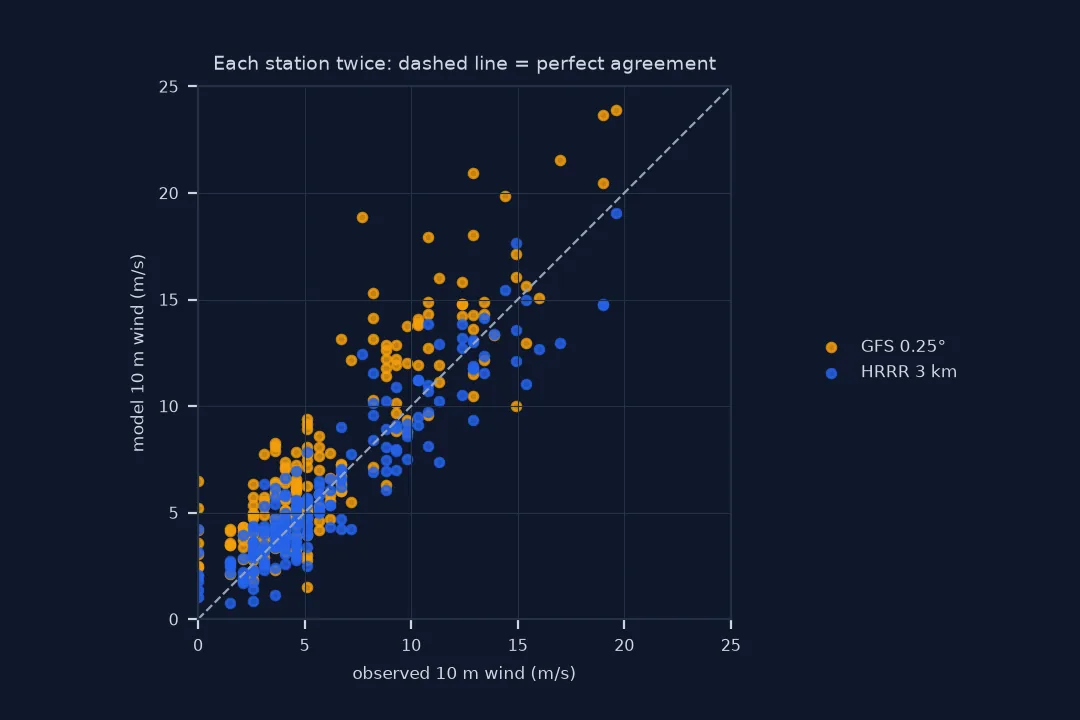
Directions where defined, and the worst stations
The data used on this page
NOAA's ISD-Lite hourly files for 2024 for every station in the ISD station list with an ICAO code in Florida, Georgia, Alabama and South Carolina; the GFS 0.25° and HRRR 3 km analyses for 00 UTC on 27 September 2024 from AWS (GFS, HRRR), 10 m UGRD and VGRD only; and the NHC best track for Helene.
import gzip
from pathlib import Path

import numpy as np
import pandas as pd
import pyproj
import requests
import xarray as xr
from scipy.spatial import cKDTree

Path("data").mkdir(exist_ok=True)

def fetch(url, path):
    p = Path("data", path)
    if not p.exists():
        r = requests.get(url, timeout=120)
        if r.status_code != 200:
            return None
        p.write_bytes(r.content)
    return p

def grib_subset(url, path):
    p = Path("data", path)
    if not p.exists():
        lines = requests.get(url + ".idx", timeout=60).text.splitlines()
        starts = [int(l.split(":")[1]) for l in lines]
        with open(p, "wb") as f:
            for i, l in enumerate(lines):
                if ":UGRD:10 m above ground:" in l or ":VGRD:10 m above ground:" in l:
                    f.write(requests.get(url, headers={"Range": f"bytes={starts[i]}-{starts[i + 1] - 1}"}, timeout=120).content)
    return xr.open_dataset(p, engine="cfgrib", decode_timedelta=False, backend_kwargs={
        "indexpath": "", "filter_by_keys": {"typeOfLevel": "heightAboveGround", "level": 10}}).load()

hist = pd.read_csv(fetch("https://www.ncei.noaa.gov/pub/data/noaa/isd-history.csv", "isd-history.csv"), dtype=str)
STATIONS = hist[(hist.CTRY == "US") & hist.STATE.isin(["FL", "GA", "AL", "SC"]) & hist.ICAO.notna() & (hist.WBAN != "99999")
                & (hist.BEGIN <= "20240101") & (hist.END >= "20241001")].copy()
STATIONS["id"] = STATIONS.USAF + "-" + STATIONS.WBAN
FILES, rows = [], []
for sid in STATIONS.id:
    f = fetch(f"https://www.ncei.noaa.gov/pub/data/noaa/isd-lite/2024/{sid}-2024.gz", f"{sid}-2024.gz")
    if f is None:
        continue
    FILES.append(sid)
    d = pd.read_fwf(gzip.open(f, "rt"), widths=[4, 3, 3, 3, 6, 6, 6, 6, 6, 6, 6, 6], header=None,
                    names=["y", "m", "d", "h", "t", "td", "slp", "wd", "ws", "sky", "p1", "p6"])
    r = d[(d.m == 9) & (d.d == 27) & (d.h == 0)]
    if len(r):
        rows.append((sid, int(r.wd.iloc[0]), int(r.ws.iloc[0])))
OBS = pd.DataFrame(rows, columns=["id", "wd", "ws"]).merge(STATIONS[["id", "STATION NAME", "LAT", "LON"]], on="id")
S = OBS[OBS.ws != -9999].astype({"LAT": float, "LON": float}).reset_index(drop=True)
S["obs_speed"] = S.ws / 10

gfs = grib_subset("https://noaa-gfs-bdp-pds.s3.amazonaws.com/gfs.20240927/00/atmos/gfs.t00z.pgrb2.0p25.f000", "gfs_helene.grib2")
GFS_AT = gfs.interp(latitude=xr.DataArray(S.LAT, dims="s"), longitude=xr.DataArray(S.LON % 360, dims="s"))
hrrr = grib_subset("https://noaa-hrrr-bdp-pds.s3.amazonaws.com/hrrr.20240927/conus/hrrr.t00z.wrfsfcf00.grib2", "hrrr_00z.grib2")
lcc = pyproj.CRS.from_proj4("+proj=lcc +lat_1=38.5 +lat_2=38.5 +lat_0=38.5 +lon_0=-97.5 +R=6371229")
to_lcc = pyproj.Transformer.from_crs(4326, lcc, always_xy=True)
gx, gy = to_lcc.transform(hrrr.longitude.values - 360, hrrr.latitude.values)
HRRR_DIST, idx = cKDTree(np.column_stack([gx.ravel(), gy.ravel()])).query(np.column_stack(to_lcc.transform(S.LON, S.LAT)))
ALPHA = np.radians(pyproj.Proj(lcc).get_factors(S.LON.values, S.LAT.values).meridian_convergence)
ug, vg = hrrr.u10.values.ravel()[idx], hrrr.v10.values.ravel()[idx]
HRRR_U, HRRR_V = np.cos(ALPHA) * ug + np.sin(ALPHA) * vg, -np.sin(ALPHA) * ug + np.cos(ALPHA) * vg
S["km"] = pyproj.Geod(ellps="WGS84").inv(S.LON.values, S.LAT.values, np.full(len(S), -84.3), np.full(len(S), 28.7))[2] / 1000
print(f"{len(S)} stations; GFS and HRRR at 00 UTC 27 Sep 2024; Helene at 28.7°N 84.3°W (best track)")
200 stations; GFS and HRRR at 00 UTC 27 Sep 2024; Helene at 28.7°N 84.3°W (best track)
Example 1: directions, where they are defined
Compare directions only where both the station and the model have a wind worth a direction, here above 2 m/s, and wrap the difference:
def dirn(u, v):
    return np.degrees(np.arctan2(-u, -v)) % 360

ok = (S.wd != -9999) & (S.obs_speed > 2)
for m, (u, v) in {"gfs": (GFS_AT.u10.values, GFS_AT.v10.values), "hrrr": (HRRR_U, HRRR_V)}.items():
    err = (dirn(u, v)[ok] - S.wd[ok] + 180) % 360 - 180
    print(f"{m.upper()}: {ok.sum()} stations, median |direction error| {np.median(np.abs(err)):.0f}°, mean error {err.mean():+.0f}°")
GFS: 182 stations, median |direction error| 11°, mean error +8°
HRRR: 182 stations, median |direction error| 7°, mean error -1°
Example 2: the worst stations
S["gfs_err"] = S.gfs_speed - S.obs_speed
print(S.nlargest(5, "gfs_err")[["STATION NAME", "km", "obs_speed", "gfs_speed", "hrrr_speed"]].round(1).to_string(index=False))
STATION NAME km obs_speed gfs_speed hrrr_speed
CRYSTAL RIVER AIRPORT 170.2 7.7 18.9 12.4
TAMPA INTERNATIONAL AIRPORT 190.9 12.9 20.9 13.1
VANDENBERG AIRPORT 206.2 10.8 17.9 13.9
INVERNESS AIRPORT 194.1 8.2 15.3 10.2
MT PLEASANT REGIONAL AIRPORT FASION FIELD 635.2 0.0 6.5 3.2
Four of the five largest GFS errors are within about 200 km of Helene's centre, where the model put 15 to 21 m/s and the stations measured 8 to 13. HRRR's values at the same stations are much closer.
Bias and RMSE answer different questions
Bias and RMSE answer different questions. Bias is the average error and says whether a model runs high or low; RMSE combines that with scatter and says how far off a single value typically is. A model can have no bias and a large RMSE if its errors cancel. Reporting both, with the number of stations, is the minimum; splitting by region, distance or terrain is where the comparison becomes informative.
Station and grid values are not the same thing. An anemometer measures one point 10 m above an airfield, averaged over two minutes; a grid value is an average over a cell, 27 km wide for GFS and 3 km for HRRR, and over the model's time step. Near coasts the difference is systematic: a coarse cell mixes the stronger winds over water with the weaker ones over land, which is part of why the GFS errors here are largest at stations near the storm and the Gulf coast, such as Crystal River and Tampa. Some of what looks like model error is representativeness, not mistakes.
Report times, light winds and independence
- Report time: ISD-Lite takes the report nearest the hour; full ISD lets you pick the routine METAR at :53.
- Calm and light winds: direction errors are meaningless at very low speeds; set a threshold and report it.
- Missing stations: stations in the worst weather often stop reporting; their absence biases scores towards calm areas.
- Height: some stations measure above or below 10 m; check the station metadata for anything unusual.
- Independence: analyses assimilate many of these observations, so analysis scores flatter the model; forecasts give a fairer test.
Internal links
- How to read HRRR wind data in Python — rotation and the HRRR grid
- How to calculate wind speed and direction from u and v — the conversions used here
FAQ
How do I compare model winds with weather station data in Python?
Interpolate the model to station locations, compute speed and direction, and report bias and RMSE of speed and the wrapped direction error.
Where can I get hourly station wind data?
NOAA's ISD-Lite gives one record per station per hour as small text files; the full ISD has every report.
What is a good RMSE for 10 m wind speed?
It depends on the weather and terrain; here HRRR scored 1.52 m/s and GFS 2.69 m/s across about 200 stations near a hurricane.
Why does a coarse model overestimate wind at coastal stations?
Its grid cells average winds over water and land, and winds over water are stronger.