
How to Map a Storm's Peak Wind Gusts in Python
On this page
Problem statement
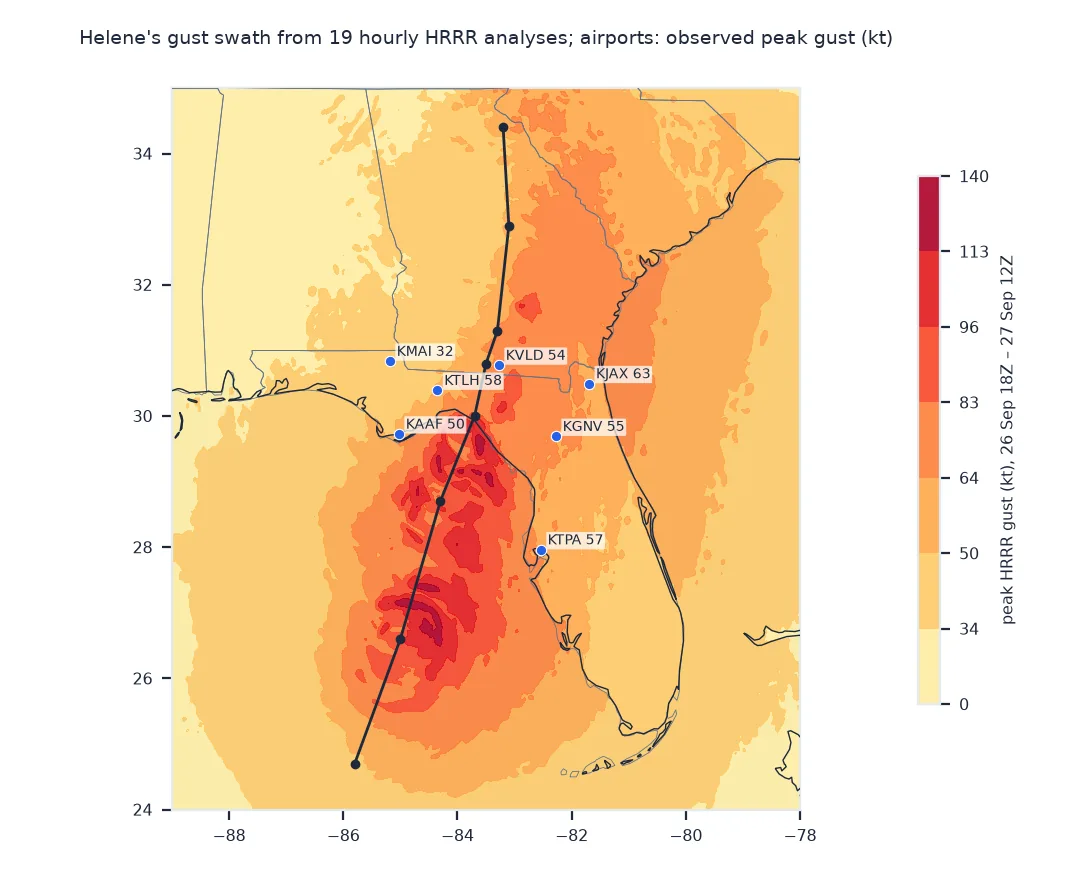
After a storm, the map people ask for is not the wind at one moment but the strongest wind each place felt: a swath of peak gusts along the track. Building it from a model means taking, for every grid point, the maximum over many hourly fields. That is a one-line reduction once the fields are aligned, and it raises the questions any swath does: how often the model was sampled, what a model "gust" is, and whether the peaks agree with what stations recorded.
This page builds a peak-gust swath for Hurricane Helene from 19 hourly HRRR analyses, from 18 UTC on 26 September to 12 UTC on 27 September 2024, measures the area under hurricane-force gusts, and compares the swath with the peak gusts reported at seven airports.
Quick answer
Stack the hourly gust fields and take the maximum along time, keeping the hour it happened:
gust = xr.concat([open_gust(p) for p in PATHS], dim="time")               # 19 hourly analyses
peak = gust.max("time")
when = gust.idxmax("time")
box = (LAT > 24) & (LAT < 37) & (LON > -90) & (LON < -76)                # around Helene's track only
kt = np.where(box, peak.values * 1.94384, np.nan)
cell_km2 = 3.0 * 3.0
k = np.nanargmax(kt)
print(f"{gust.sizes['time']} hours, {box.sum():,} grid points in the box; strongest gust {np.nanmax(kt):.0f} kt at "
      f"{LAT.flat[k]:.2f}°N {abs(LON.flat[k]):.2f}°W, {pd.Timestamp(when.values.flat[k]):%d %b %H} UTC")
for thr in (34, 50, 64):
    print(f"  gusts {thr} kt or more: {(kt >= thr).sum() * cell_km2:,.0f} km²")
19 hours, 220,089 grid points in the box; strongest gust 134 kt at 27.16°N 84.88°W, 26 Sep 19 UTC
gusts 34 kt or more: 1,339,587 km²
gusts 50 kt or more: 590,031 km²
gusts 64 kt or more: 275,652 km²
One field per hour, station peaks, what a model gust is
1. Fetch one field per hour
Each HRRR surface file carries a GUST message; reading the index and requesting its byte range gets about 1 MB per hour instead of 130:
sizes = [p.stat().st_size for p in PATHS]
print(f"{len(PATHS)} files, {sum(sizes) / 1e6:.1f} MB in total, {np.mean(sizes) / 1e6:.2f} MB each")
19 files, 23.1 MB in total, 1.22 MB each
2. Compare with station peak gusts
The airports' peak gusts come from the OC1 field of their ISD reports over the same hours. The swath is sampled at the grid point nearest each station:
idx = cKDTree(np.column_stack(TO_LCC.transform(LON.ravel(), LAT.ravel()))).query(np.column_stack(TO_LCC.transform(ST.lon, ST.lat)))[1]
ST["hrrr_kt"] = kt.ravel()[idx]
ST["diff_kt"] = ST.hrrr_kt - ST.obs_kt
print(ST[["obs_kt", "obs_time", "hrrr_kt", "diff_kt"]].round(0).to_string())
print(f"median difference {ST.diff_kt.median():+.0f} kt")
obs_kt obs_time hrrr_kt diff_kt
icao
KJAX 63.0 27 03:56 62.0 -1.0
KTPA 57.0 27 00:53 59.0 2.0
KTLH 58.0 27 04:07 55.0 -3.0
KVLD 54.0 27 03:45 73.0 19.0
KAAF 50.0 27 01:51 58.0 8.0
KGNV 55.0 27 03:20 66.0 11.0
KMAI 32.0 27 05:53 38.0 6.0
median difference +6 kt
3. Know what the model gust is
HRRR's GUST is a diagnostic: an estimate of the gust that the boundary layer could bring to the surface at the analysis time, not a measured peak over the hour. Station gusts are the highest few-second wind in the period. The two are different quantities, so agreement in timing is as useful a check as agreement in size:
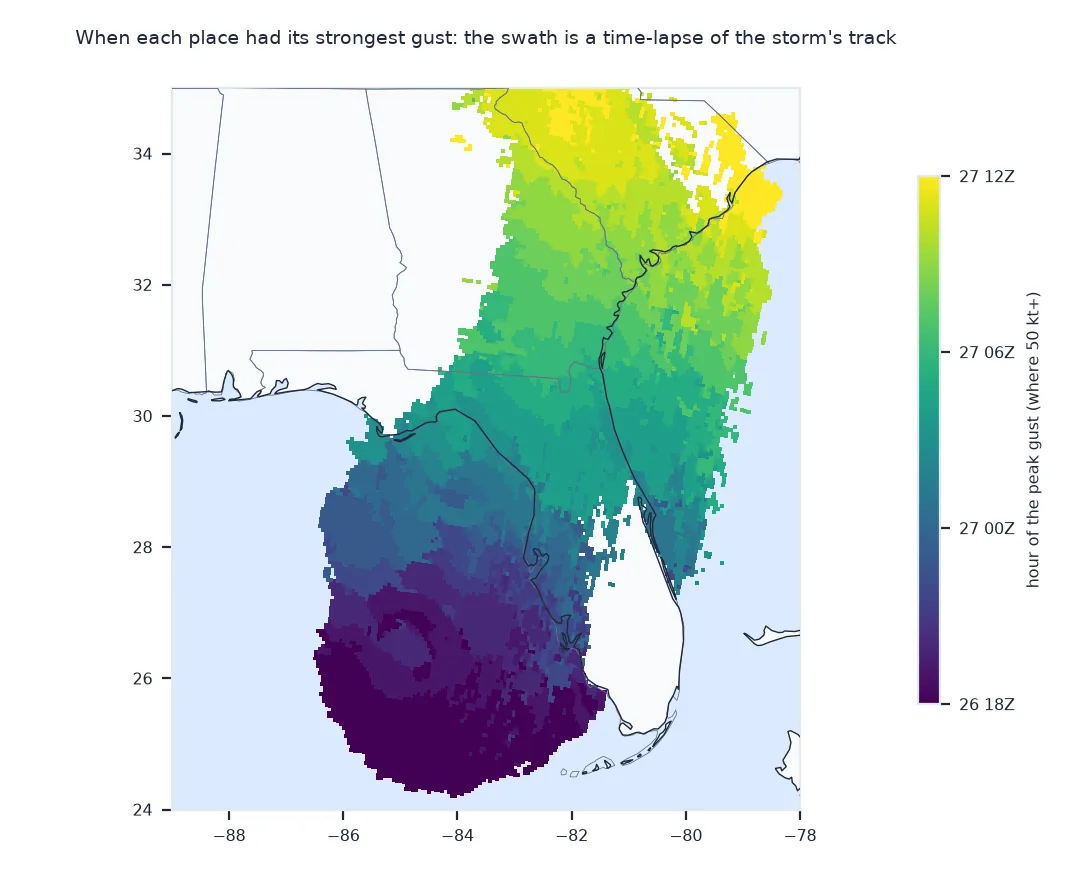
print(f"hours in which the swath maximum occurred, at the stations: {sorted(pd.to_datetime(when.values.ravel()[idx]).strftime('%d %H').tolist())}")hours in which the swath maximum occurred, at the stations: ['27 00', '27 02', '27 04', '27 04', '27 05', '27 05', '27 06']
Where the swath came from, hour by hour
The data used on this page
The NOAA HRRR bucket on AWS, GUST at the surface from the analyses (wrfsfcf00) for every hour from 18 UTC on 26 September to 12 UTC on 27 September 2024, and NOAA Integrated Surface Database reports for seven airports, whose OC1 field holds the wind gust in tenths of a metre per second.
from pathlib import Path

import numpy as np
import pandas as pd
import pyproj
import requests
import xarray as xr
from scipy.spatial import cKDTree

Path("data").mkdir(exist_ok=True)
PATHS = []
for t in pd.date_range("2024-09-26 18:00", "2024-09-27 12:00", freq="h"):
    p = Path(f"data/hrrr_gust_{t:%Y%m%d%H}.grib2")
    if not p.exists():
        url = f"https://noaa-hrrr-bdp-pds.s3.amazonaws.com/hrrr.{t:%Y%m%d}/conus/hrrr.t{t:%H}z.wrfsfcf00.grib2"
        lines = requests.get(url + ".idx", timeout=60).text.splitlines()
        starts = [int(l.split(":")[1]) for l in lines]
        i = next(k for k, l in enumerate(lines) if ":GUST:surface:" in l)
        p.write_bytes(requests.get(url, headers={"Range": f"bytes={starts[i]}-{starts[i + 1] - 1}"}, timeout=120).content)
    PATHS.append(p)

def open_gust(p):
    ds = xr.open_dataset(p, engine="cfgrib", decode_timedelta=False, backend_kwargs={"indexpath": ""}).load()
    return ds.gust.expand_dims(time=[pd.Timestamp(ds.time.values)])

first = xr.open_dataset(PATHS[0], engine="cfgrib", decode_timedelta=False, backend_kwargs={"indexpath": ""}).load()
LAT, LON = first.latitude.values, first.longitude.values - 360
TO_LCC = pyproj.Transformer.from_crs(4326, "+proj=lcc +lat_1=38.5 +lat_2=38.5 +lat_0=38.5 +lon_0=-97.5 +R=6371229", always_xy=True)

IDS = {"KJAX": "72206013889", "KTPA": "72211012842", "KTLH": "72214093805", "KVLD": "72216693845",
       "KAAF": "72220012832", "KGNV": "74756012816", "KMAI": "74776003818"}
rows = []
for icao, sid in IDS.items():
    f = Path(f"data/{sid}.csv")
    if not f.exists():
        f.write_bytes(requests.get(f"https://noaa-global-hourly-pds.s3.amazonaws.com/2024/{sid}.csv", timeout=300).content)
    d = pd.read_csv(f, dtype=str, low_memory=False)
    d["t"] = pd.to_datetime(d.DATE)
    d = d[(d.t >= "2024-09-26 18:00") & (d.t <= "2024-09-27 12:59") & d.OC1.notna()]
    g = d.OC1.str.split(",").str[0].astype(int) / 10 * 1.94384                # tenths of m/s → knots
    rows.append((icao, float(d.LATITUDE.iloc[0]), float(d.LONGITUDE.iloc[0]), g.max(), d.t.loc[g.idxmax()].strftime("%d %H:%M")))
ST = pd.DataFrame(rows, columns=["icao", "lat", "lon", "obs_kt", "obs_time"]).set_index("icao")
print(f"{len(PATHS)} hourly gust fields; {len(ST)} airports with gust reports")
19 hourly gust fields; 7 airports with gust reports
Example 1: where the swath came from, hour by hour
hourly_max = (gust.max(["y", "x"]) * 1.94384).to_series().round(0)
print(hourly_max.rename(lambda t: f"{t:%d %H}Z").to_string())
time
26 18Z 116.0
26 19Z 134.0
26 20Z 121.0
26 21Z 102.0
26 22Z 114.0
26 23Z 105.0
27 00Z 114.0
27 01Z 122.0
27 02Z 121.0
27 03Z 122.0
27 04Z 111.0
27 05Z 92.0
27 06Z 86.0
27 07Z 99.0
27 08Z 80.0
27 09Z 81.0
27 10Z 77.0
27 11Z 78.0
27 12Z 84.0
A swath is a maximum over time
A swath is a maximum over time at each point, so it shows the worst each place experienced, not the storm at any moment. Its quality depends on the sampling: hourly snapshots of a storm moving at 20 knots leave gaps of about 37 km between samples of the same feature, enough to miss part of the eyewall's path. Forecast models also write hourly maximum fields that are computed every time step and avoid this; for analyses, hourly snapshots are what exists.
Comparing a model swath with stations tests both. Here the swath is higher than the airports' peak gusts at five of seven, by a median of 6 knots, despite sampling only once an hour: the diagnostic gust and a measured gust are different quantities, and a grid cell can be windier than an airfield. A swath is best read as a map of exposure, with the station peaks as checks at points, not as a map of measured gusts.
Missing hours, stations that stop and window ends
- Units: GRIB gusts are m/s; knots are m/s × 1.94384, and ISD
OC1is in tenths of m/s. - Missing hours: check that every hour downloaded; a missing hour leaves a hole in the swath.
- Grid cell area: HRRR cells are 3 × 3 km on the projection; the true area varies by a few per cent across the domain.
- Stations that stop: Cross City, near landfall, reported no gusts in the window.
- The window's ends: the first hour already shows the storm at sea, so the southern end of the swath is a single snapshot, not a maximum over its passage.
- Forecasts: forecast files carry hourly maximum fields such as
WIND:10 m above ground:max fcst, a better basis for swaths.
Internal links
- How to read HRRR wind data in Python — the HRRR grid
- How to check model winds against station observations — verification in general
FAQ
How do I make a maximum wind gust swath in Python?
Download the gust field for each hour, concatenate along time with xarray, and take .max("time"); .idxmax("time") gives when each peak occurred.
What is HRRR's GUST variable?
A diagnostic estimate of the surface wind gust at the analysis time, derived from the boundary-layer winds; it is not an observed gust.
Where can I get observed wind gusts?
From station reports, for example the OC1 field in NOAA's Integrated Surface Database.
Can a model gust swath be trusted?
Check it against station peaks. Here HRRR was within 3 knots of the observed peak at three airports and above it at the other four; hourly sampling can miss brief extremes, and a diagnostic gust can overstate others.