
How to Measure the New-Build Price Premium in Python
On this page
Problem statement
New homes sell for more than existing ones, but by how much? Comparing the national median of new-build sales with the median of everything else gives a large, misleading number, because new homes are built in different places and in a different mix of types than the existing stock. A fair comparison holds the location and the type fixed. HM Land Registry's Price Paid Data flags every new build, and its postcodes allow the comparison to be made within small areas.
This page measures the new-build premium in England and Wales from the 2024 Price Paid file. It compares raw national medians, then medians by property type, then new and existing sales of the same type within the same postcode district, which is the fairest of the three.
Quick answer
Compare medians of new and existing homes within the same postcode district and property type:
A["district_pc"] = A.postcode.str.split(" ").str[0]
g = A.groupby(["district_pc", "property_type", "old_new"]).price.agg(["size", "median"]).unstack("old_new")
g = g[(g[("size", "Y")] >= 10) & (g[("size", "N")] >= 10)]
ratio = g[("median", "Y")] / g[("median", "N")] - 1
print(f"postcode district x type cells with 10+ sales of each: {len(ratio):,}")
print(f"new-build premium within cells: median {ratio.median():+.1%}; middle half {ratio.quantile(0.25):+.1%} to {ratio.quantile(0.75):+.1%}")
postcode district x type cells with 10+ sales of each: 1,963
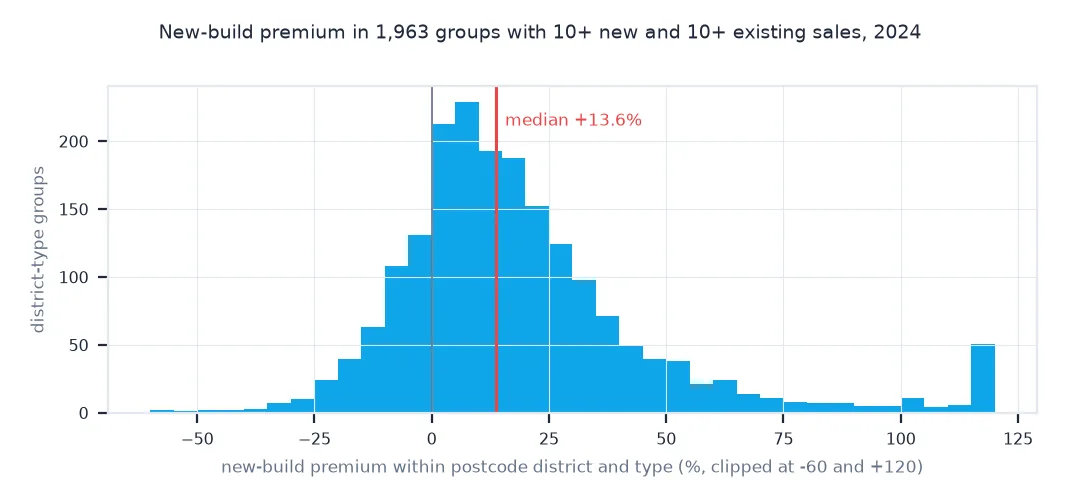
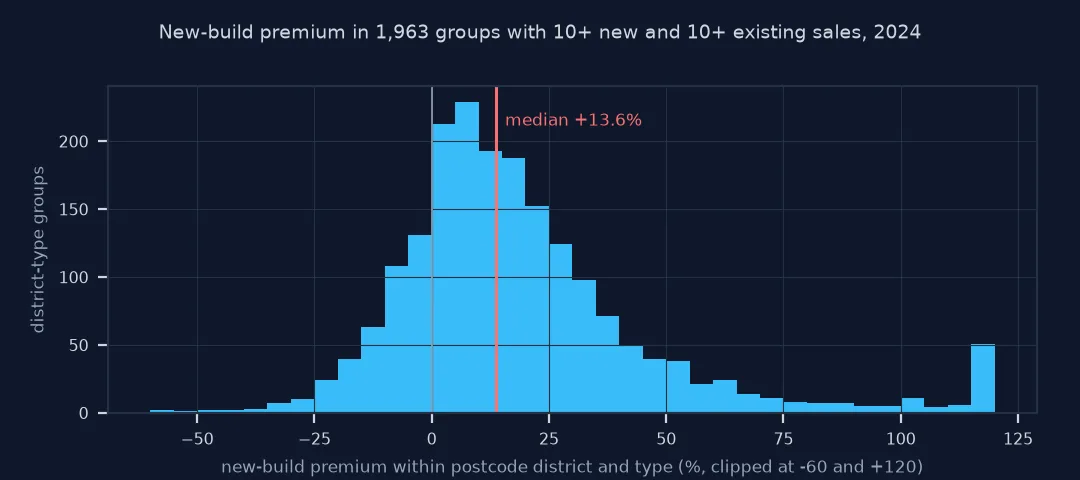
new-build premium within cells: median +13.6%; middle half +2.6% to +29.1%
1,963 combinations of postcode district and type have at least 10 new and 10 existing sales. Within them, new builds sold for a median of 13.6% more, with the middle half of cells between 2.6% and 29.1%.
The raw comparison, by type, where it is largest
1. The raw comparison
raw = A.groupby("old_new").price.median()
print(f"national median: new {raw['Y']:,.0f}, existing {raw['N']:,.0f}; raw premium {raw['Y'] / raw['N'] - 1:+.1%}")
print("share of each type among new builds:", A[A.old_new == "Y"].property_type.value_counts(normalize=True).round(2).to_dict())
print("among existing homes:", A[A.old_new == "N"].property_type.value_counts(normalize=True).round(2).to_dict())
national median: new 350,000, existing 285,000; raw premium +22.8%
share of each type among new builds: {'D': 0.45, 'S': 0.26, 'F': 0.19, 'T': 0.09}
among existing homes: {'S': 0.3, 'T': 0.29, 'D': 0.24, 'F': 0.17}
Nationally, new builds sold for a median of £350,000 against £285,000, a raw premium of 22.8%. But 45% of new builds were detached, against 24% of existing homes, so the raw figure partly measures the mix.
2. By property type
t = A.groupby(["property_type", "old_new"]).price.median().unstack()
t["premium"] = t.Y / t.N - 1
print(t.loc[["D", "S", "T", "F"]].round(3).to_string())
old_new N Y premium
property_type
D 417000.0 401983.5 -0.036
S 265000.0 285000.0 0.075
T 230000.0 273000.0 0.187
F 230000.0 355000.0 0.543
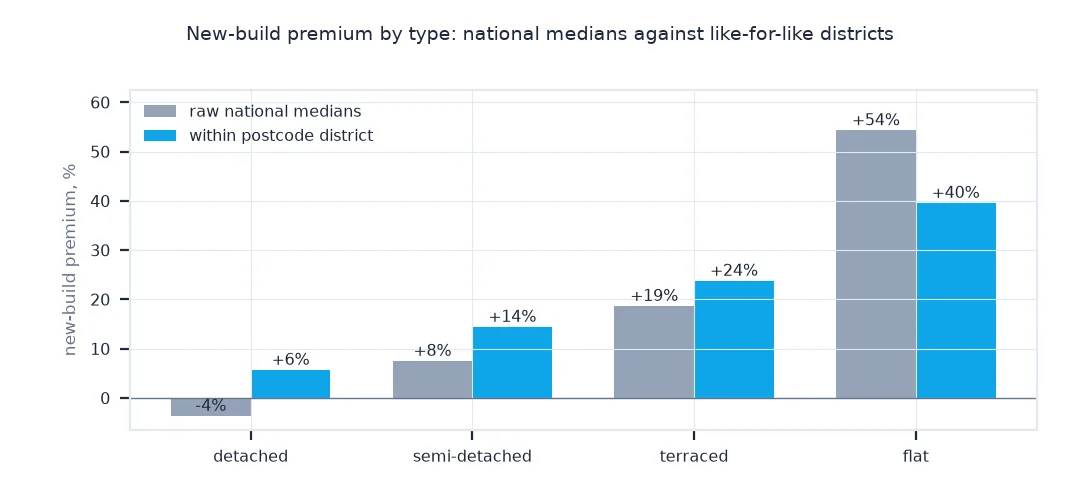
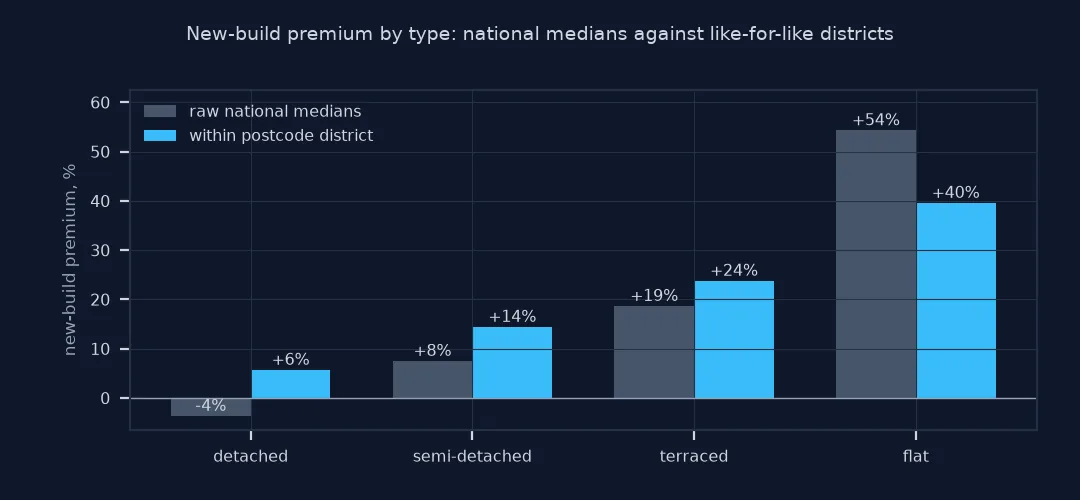
By type, the picture changes completely. New detached houses sold for 3.6% less than existing ones, while new flats sold for 54.3% more, consistent with new flats being built where flats are expensive.
3. Where the premium is largest
r = ratio.reset_index(); r.columns = ["district_pc", "type", "premium"]
print("premium by type within postcode districts:", r.groupby("type").premium.median().round(3).to_dict())
print(f"cells where new builds sell for less: {(r.premium < 0).mean():.0%}")
premium by type within postcode districts: {'D': 0.057, 'F': 0.396, 'S': 0.145, 'T': 0.238}
cells where new builds sell for less: 20%
Within postcode districts, the premium is 5.7% for detached houses, 14.5% for semis, 23.8% for terraces and 39.6% for flats. In 20% of cells, new builds sold for less than existing homes.
Districts with the most new building
The data used on this page
HM Land Registry Price Paid Data for 2024, standard sales (category A), © Crown copyright 2026, Open Government Licence v3.0. The postcode district is the outward part of the postcode, such as SW1A or M1.
from pathlib import Path

import pandas as pd
import requests

Path("data").mkdir(exist_ok=True)
CSV = Path("data/pp-2024.csv")
if not CSV.exists():
    r = requests.get("http://prod1.publicdata.landregistry.gov.uk.s3-website-eu-west-1.amazonaws.com/pp-2024.csv", timeout=1800); r.raise_for_status(); CSV.write_bytes(r.content)
COLS = ["transaction_id", "price", "date", "postcode", "property_type", "old_new", "duration", "paon", "saon",
        "street", "locality", "town", "district", "county", "ppd_category", "record_status"]
A = pd.read_csv(CSV, header=None, names=COLS, usecols=["price", "postcode", "property_type", "old_new", "district", "ppd_category"]).query("ppd_category == 'A'").dropna(subset=["postcode"]).copy()
print(f"{len(A):,} standard sales with a postcode; new builds {(A.old_new == 'Y').mean():.1%}")
763,740 standard sales with a postcode; new builds 9.5%
763,740 standard sales have a postcode, and 9.5% of them are new builds.
Example 1: districts with the most new building
Where were most new homes sold in 2024?
nb = A[A.old_new == "Y"].district.value_counts().head(5)
print("districts with the most new-build sales:", nb.to_dict())
districts with the most new-build sales: {'NORTH YORKSHIRE': 1190, 'EAST RIDING OF YORKSHIRE': 1021, 'NORTH NORTHAMPTONSHIRE': 936, 'LEEDS': 902, 'CHESHIRE EAST': 872}
North Yorkshire, East Riding of Yorkshire, North Northamptonshire, Leeds and Cheshire East had the most new-build sales in 2024, between 872 and 1,190 each.
A ratio of medians needs alike groups
A premium measured as the ratio of two medians is only meaningful if the two groups are otherwise alike, and new and existing homes are not. New homes are concentrated where land is available, often on the edges of towns and in growing regions, and they include more flats and detached houses in some places, more terraces in others. A national comparison mixes all of that into the "premium". Comparing within property types removes the biggest difference. Comparing within small areas as well, here postcode districts, removes most of the location effect, at the cost of using only areas where both kinds of home sold.
What remains still reflects more than newness. New homes are often larger or smaller than the local existing stock, carry developer incentives or warranties, and are sold at asking prices set before completion. Studies that model size and features find premiums that shrink further, and premiums tend to fade as a new home becomes a second-hand one, which is why the first resale of new builds often shows weak price growth. The within-area estimate is a much better starting point than the raw ratio, and it is easy to compute from open data.
Minimum counts, leasehold and Help to Buy
- Minimum counts: small cells give noisy medians; require a minimum number of sales of each kind.
- Leasehold: many new flats and some new houses are leasehold; compare within tenure for a stricter test.
- Help to Buy: government-backed purchases of new builds may affect prices in some periods.
- Postcode sectors: the next level down (for example
SW1A 1) is finer but leaves fewer comparable cells.
Internal links
- How to analyse HM Land Registry price paid data in Python — the data
- How to build a repeat-sales house price index in Python — why first resales of new builds are excluded
- Fixing house price averages skewed by outliers — medians and outliers
FAQ
How much more do new-build homes cost?
Much less than the raw national comparison suggests; within the same postcode district and property type, the 2024 premium in England and Wales was smaller than the national ratio.
How do I identify new builds in Land Registry data?
The old_new column is Y for a newly built property and N for an established one.
Why is the raw new-build premium misleading?
New homes are built in different places and mixes of types than the existing stock; compare within type and area.
What is a postcode district?
The outward code of a UK postcode, the part before the space, covering a few thousand to tens of thousands of addresses.