
How to Build a House Price Time Series From Land Registry Data in Python
On this page
Problem statement
How have house prices moved month by month? With HM Land Registry's Price Paid Data a time series is a groupby away, and a simple median per month is how many first analyses start. It moves for reasons other than prices, though. More flats sold one month and more detached houses the next shifts the median, sales follow a seasonal cycle, a stamp-duty deadline pulls sales forward, and the most recent months are incomplete because sales take weeks to be registered.
This page builds monthly median prices for England and Wales from the 2019 to 2024 Price Paid files. It splits them by property type to remove mix effects, measures seasonality and year-on-year change, and finds the spike caused by the end of the stamp-duty holiday in 2021.
Quick answer
Read the yearly files with only the needed columns, keep standard sales, and take monthly medians:
COLS = ["transaction_id", "price", "date", "postcode", "type", "old_new", "duration", "paon", "saon",
        "street", "locality", "town", "district", "county", "cat", "record_status"]
P = pd.concat([pd.read_csv(f, header=None, names=COLS, usecols=["price", "date", "type", "cat"], parse_dates=["date"]) for f in FILES])
A = P[(P.cat == "A") & P.date.between("2019-01-01", "2024-12-31")]
monthly = A.groupby(A.date.dt.to_period("M")).price.agg(["size", "median"])
print(f"{len(A):,} standard sales 2019-2024; monthly median from £{monthly['median'].min():,.0f} ({monthly['median'].idxmin()}) to £{monthly['median'].max():,.0f} ({monthly['median'].idxmax()})")
print(f"Dec 2024 vs Jan 2019: {monthly['median'].iloc[-1] / monthly['median'].iloc[0] - 1:+.0%}")
5,065,502 standard sales 2019-2024; monthly median from £210,000 (2021-07) to £335,000 (2021-06)
Dec 2024 vs Jan 2019: +27%
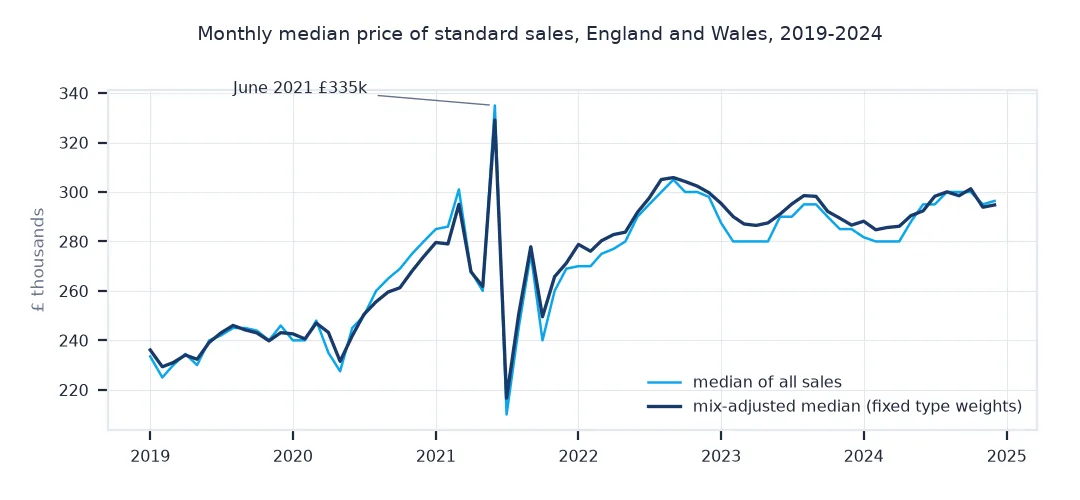
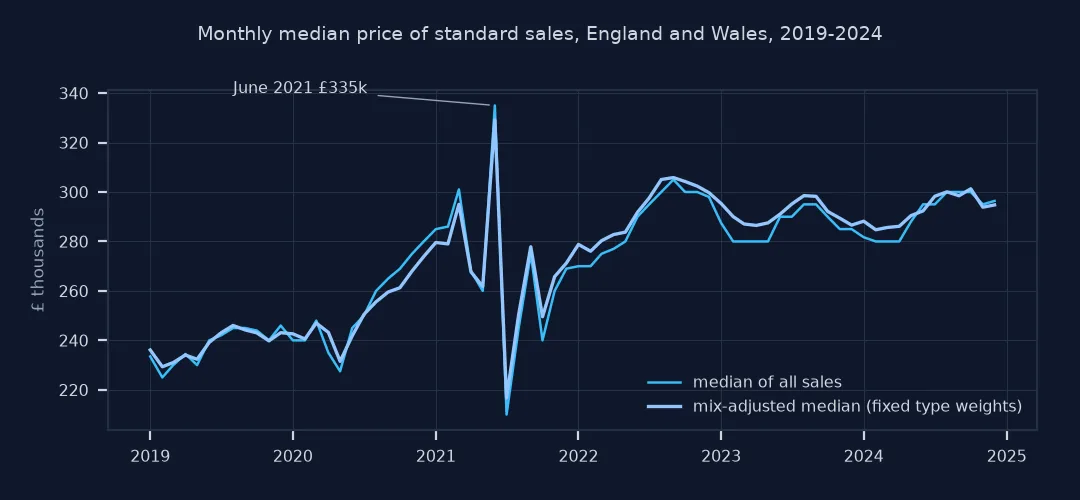
Over 5,065,502 standard sales, the monthly median rose 27% from January 2019 to December 2024. Its extremes sit side by side: £335,000 in June 2021 and £210,000 a month later. Prices did not swing that much in a month. The first stage of the stamp-duty holiday ended on 30 June, and the saving was largest on homes priced at £500,000 or more, consistent with more expensive sales being rushed into June.
By property type, seasonality and the 2021 spike, annual change
1. By property type
Each type has its own price level; a change in the mix moves the overall median even when no prices change:
by_type = A.groupby([A.date.dt.year, "type"]).price.median().unstack()
print(by_type[["D", "S", "T", "F"]].rename(columns={"D": "detached", "S": "semi", "T": "terraced", "F": "flat"}).astype(int).to_string())
share = A.groupby(A.date.dt.year).type.apply(lambda s: (s == "F").mean())
print("share of sales that were flats:", {y: f"{v:.1%}" for y, v in share.items()})
type detached semi terraced flat
date
2019 339950 214000 185000 213000
2020 360000 228000 197000 230000
2021 389950 248000 220000 237500
2022 420000 265000 230000 241000
2023 420000 265000 227000 240000
2024 415000 269950 235000 245000
share of sales that were flats: {2019: '17.2%', 2020: '16.1%', 2021: '16.6%', 2022: '19.4%', 2023: '18.8%', 2024: '17.5%'}
By type, detached houses rose from £339,950 to £415,000 and terraced houses from £185,000 to £235,000. Flats rose least, from £213,000 to £245,000. The share of sales that were flats moved between 16.1% and 19.4%, enough on its own to nudge the overall median.
2. Seasonality and the 2021 spike
cnt = monthly["size"]
print(f"busiest month: {cnt.idxmax()} with {cnt.max():,} sales; quietest: {cnt.idxmin()} with {cnt.min():,}")
by_month = A.groupby([A.date.dt.year, A.date.dt.month]).size().unstack()
norm = by_month.div(by_month.mean(axis=1), axis=0).loc[[2019, 2022, 2023, 2024]].mean()
print("typical month index (sales / yearly average, 2019 and 2022-2024):", {m: round(v, 2) for m, v in norm.items()})
busiest month: 2021-06 with 166,695 sales; quietest: 2020-04 with 25,351
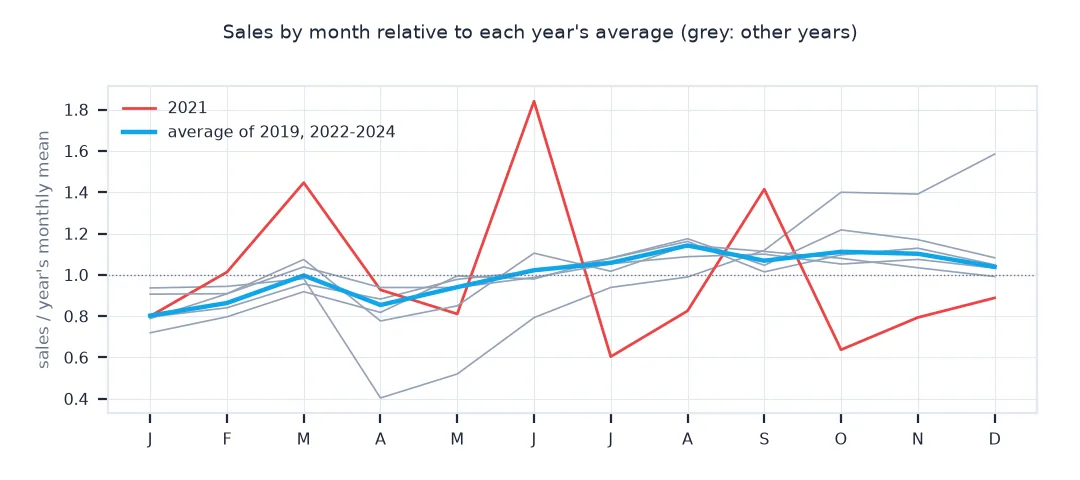
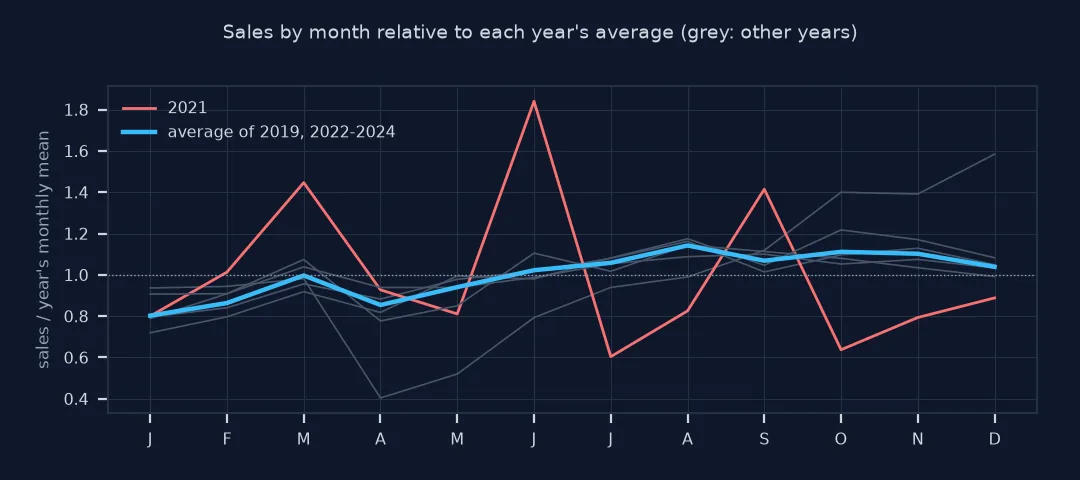
typical month index (sales / yearly average, 2019 and 2022-2024): {1: 0.8, 2: 0.86, 3: 1.0, 4: 0.85, 5: 0.94, 6: 1.02, 7: 1.06, 8: 1.14, 9: 1.07, 10: 1.11, 11: 1.1, 12: 1.04}
June 2021 was the busiest month, with 166,695 sales, and April 2020, during the first lockdown, the quietest with 25,351. In ordinary years, sales run about 20% below average in January and 7-14% above it from August to November.
3. Year-on-year change
Compare each month with the same month a year earlier, by type, to remove both seasonality and mix:
mt = A.groupby([A.date.dt.to_period("M"), "type"]).price.median().unstack()
yoy = mt.pct_change(12).dropna()
print("year-on-year change in December 2024:", {t: f"{yoy.loc['2024-12', t]:+.1%}" for t in ["D", "S", "T", "F"]})
print(f"months since 2020 with falling detached prices year on year: {(yoy['D'] < 0).sum()} of {len(yoy)}")
year-on-year change in December 2024: {'D': '+0.9%', 'S': '+3.7%', 'T': '+5.6%', 'F': '+2.3%'}
months since 2020 with falling detached prices year on year: 19 of 60
In December 2024, median prices were up on a year earlier for every type, by 0.9% for detached houses and 5.6% for terraced ones. Detached prices fell year on year in 19 of the 60 months since 2020.
A mix-adjusted index
The data used on this page
The yearly Price Paid Data files for 2019 to 2024 from HM Land Registry, as published at the time of the run (© Crown copyright 2026, Open Government Licence v3.0), reading only price, date, property type and category.
from pathlib import Path

import pandas as pd
import requests

Path("data").mkdir(exist_ok=True)
FILES = []
for y in range(2019, 2025):
    f = Path(f"data/pp-{y}.csv")
    if not f.exists():
        r = requests.get(f"http://prod1.publicdata.landregistry.gov.uk.s3-website-eu-west-1.amazonaws.com/pp-{y}.csv", timeout=1800)
        r.raise_for_status(); f.write_bytes(r.content)
    FILES.append(f)
print(f"{len(FILES)} yearly files, {sum(f.stat().st_size for f in FILES) / 1e9:.2f} GB")
6 yearly files, 1.06 GB
The six yearly files total 1.06 GB.
Example 1: a mix-adjusted index
Weight each type's monthly median by its average share of sales, so changes in the mix cannot move the index:
w = A.type.value_counts(normalize=True).reindex(["D", "S", "T", "F"])
mix = (mt[["D", "S", "T", "F"]] * (w / w.sum()).values).sum(axis=1)
raw = monthly["median"]
print(f"change Jan 2019 to Dec 2024: raw median {raw.iloc[-1] / raw.iloc[0] - 1:+.1%}, mix-adjusted {mix.iloc[-1] / mix.iloc[0] - 1:+.1%}")
print(f"largest month-to-month move: raw {raw.pct_change().abs().max():.1%}, mix-adjusted {mix.pct_change().abs().max():.1%}")
change Jan 2019 to Dec 2024: raw median +26.9%, mix-adjusted +24.8%
largest month-to-month move: raw 37.3%, mix-adjusted 34.2%
Weighting each type by its average share gives +24.8% over the six years against +26.9% raw. The largest month-to-month move, the June 2021 spike, shrinks only from 37.3% to 34.2%: the spike came from what sold within each type, not from the mix between types.
A median mixes price and what sold
A monthly median of sale prices mixes two things: changes in price and changes in what sold. In a month when more detached houses sell, the median rises even if no house became more valuable. Property type is the largest source of such composition effects in England and Wales, along with region and new-build share. Splitting by type, or weighting each type's median by a fixed share, removes much of it. Official indices go further, with hedonic or repeat-sales methods that control for each property's characteristics.
Time adds its own patterns. Sales follow a seasonal cycle, quieter in winter and busier in summer and early autumn. Policy can override it: the stamp-duty holiday introduced in 2020 ended in stages in June and September 2021, pulling sales forward into those months. Year-on-year comparisons cancel seasonality, and type-by-type comparisons cancel most of the mix. Recent months in any download are incomplete, because sales are registered weeks or months after completion, and the yearly files are revised monthly.
Transfer dates, registration lag and the official index
- Date of transfer: the date is the completion date, not when the price was agreed; prices respond to the market months earlier.
- Registration lag: the latest months grow as late registrations arrive; avoid them in trend estimates.
- Regions: national medians hide divergent regions; group by
countyor district for regional series. - Official index: the UK House Price Index (ONS and Land Registry) uses a hedonic mix adjustment and is the reference series.
Internal links
- How to build a repeat-sales house price index in Python — controlling for the property
- House price index methods explained — median, hedonic and repeat-sales
- How to analyse HM Land Registry price paid data in Python — the data
FAQ
How do I make a house price time series in Python?
Read the Price Paid files, keep category A sales, and take the median price per month, ideally per property type.
Why does the median house price jump from month to month?
Partly because the mix of properties sold changes; compare by property type or use a mix-adjusted index.
What caused the spike in house sales in 2021?
The end of the stamp-duty holiday in June and September 2021 pulled many completions into those months.
Are the latest months of price paid data complete?
No; sales are registered with a lag, so the most recent months are revised upward as late records arrive.