
How to Analyse HM Land Registry Price Paid Data in Python
On this page
Problem statement
In 2024, 763,905 homes in England and Wales sold on the open market for a median of £291,000: £415,000 for a detached house, £235,000 for a terrace, £530,200 in Greater London. Every one of those sales is in HM Land Registry's Price Paid Data, free under the Open Government Licence, and getting the figures out of it is a matter of summarising by property type, by county and by month — once the 167,548 sales that are not ordinary market purchases have been set aside.
This page loads the 2024 file. It names the columns and decodes the codes, separates standard market sales from the rest, and summarises prices by property type, by region and by month.
Quick answer
Read the file with the column names supplied, and keep standard sales (category A):
COLS = ["transaction_id", "price", "date", "postcode", "property_type", "old_new", "duration", "paon", "saon",
        "street", "locality", "town", "district", "county", "ppd_category", "record_status"]
P = pd.read_csv(CSV, header=None, names=COLS, parse_dates=["date"])
A = P[P.ppd_category == "A"]
print(f"{len(P):,} transactions registered for 2024; standard (A): {len(A):,}; additional (B): {(P.ppd_category == 'B').sum():,}")
print(f"median price of standard sales £{A.price.median():,.0f}; mean £{A.price.mean():,.0f}")
931,453 transactions registered for 2024; standard (A): 763,905; additional (B): 167,548
median price of standard sales £291,000; mean £369,875
931,453 transactions are registered for 2024: 763,905 standard sales and 167,548 additional ones. The median standard sale was £291,000, and the mean £369,875, pulled up by expensive sales.
Decode the codes, by county and month, additional sales
1. Decode the codes
TYPES = {"D": "detached", "S": "semi-detached", "T": "terraced", "F": "flat/maisonette", "O": "other"}
t = A.assign(type=A.property_type.map(TYPES)).groupby("type").price.agg(["size", "median"])
print(t.sort_values("median", ascending=False).rename(columns={"size": "sales", "median": "median £"}).to_string())
print(f"new builds (old_new = Y): {(A.old_new == 'Y').mean():.1%}; leasehold (duration = L): {(A.duration == 'L').mean():.1%}")
sales median £
type
detached 199414 415000.0
semi-detached 226978 269950.0
flat/maisonette 133331 245000.0
terraced 204182 235000.0
new builds (old_new = Y): 9.5%; leasehold (duration = L): 22.1%
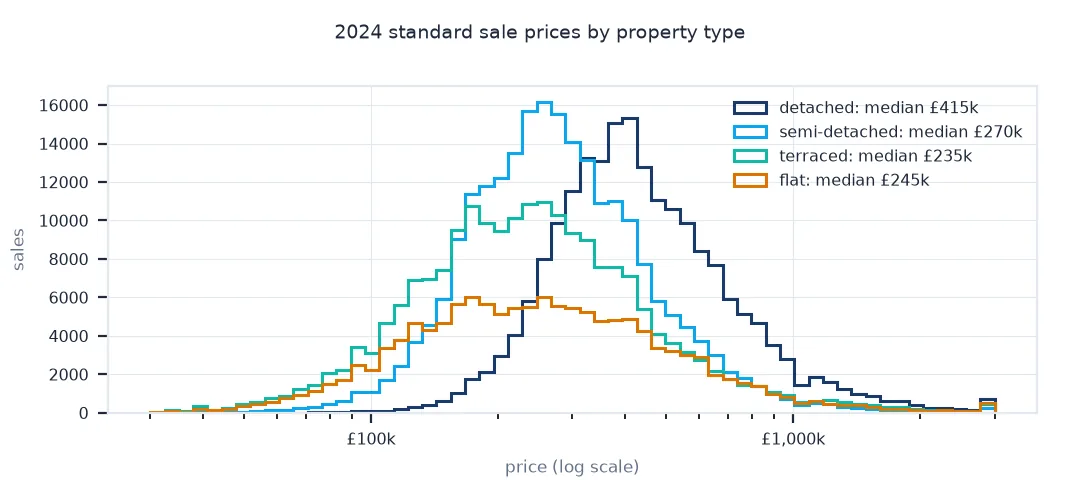
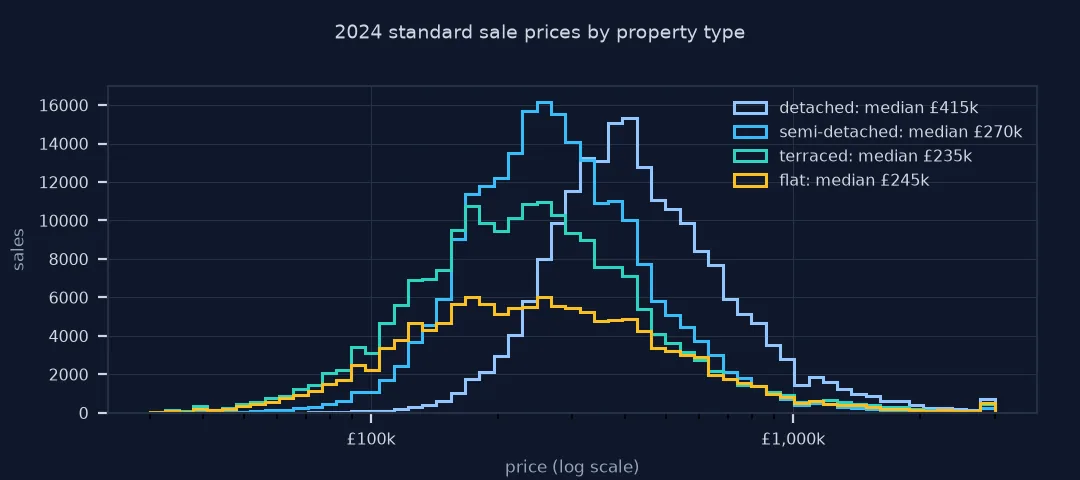
Detached houses sold for a median of £415,000, semi-detached houses for £269,950, flats for £245,000 and terraced houses for £235,000. 9.5% of standard sales were new builds and 22.1% leasehold.
2. By county and by month
c = A.groupby("county").price.agg(["size", "median"]).sort_values("median", ascending=False)
print("most expensive counties:", c.head(3)["median"].astype(int).to_dict())
print("least expensive:", c.tail(3)["median"].astype(int).to_dict())
m = A.groupby(A.date.dt.to_period("M")).price.agg(["size", "median"])
print(f"sales per month: {m['size'].min():,} ({m['size'].idxmin()}) to {m['size'].max():,} ({m['size'].idxmax()})")
most expensive counties: {'GREATER LONDON': 530200, 'WINDSOR AND MAIDENHEAD': 530000, 'SURREY': 503752}
least expensive: {'CITY OF KINGSTON UPON HULL': 136000, 'BLACKPOOL': 135000, 'BLAENAU GWENT': 135000}
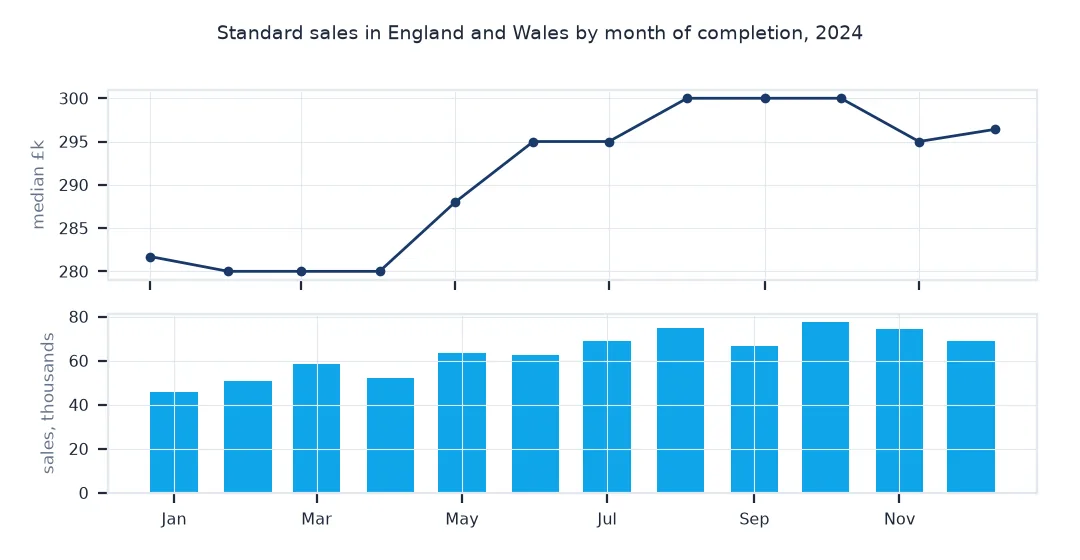
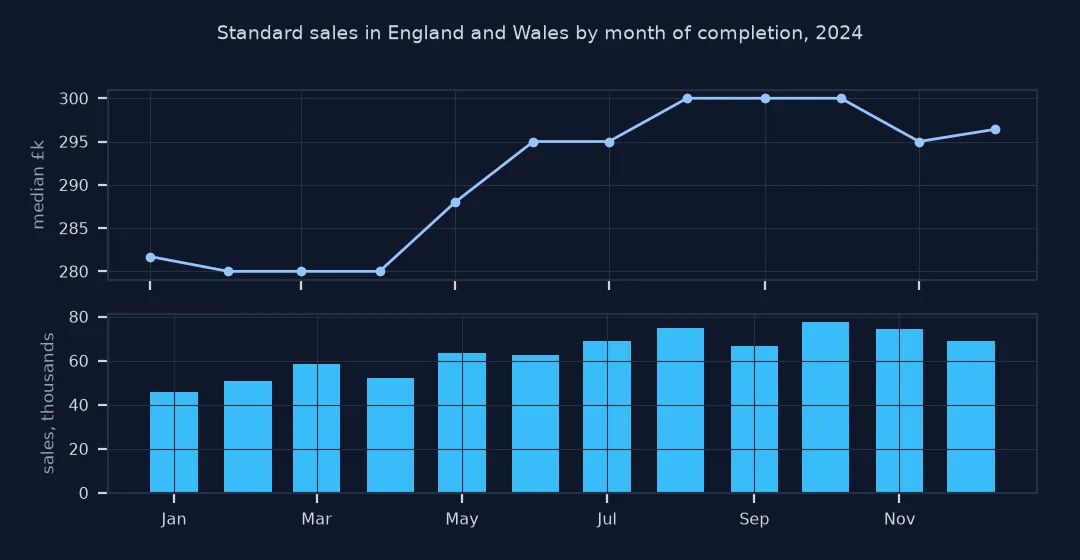
sales per month: 45,798 (2024-01) to 77,498 (2024-10)
Greater London is the most expensive county by median, £530,200, closely followed by Windsor and Maidenhead and Surrey. Kingston upon Hull, Blackpool and Blaenau Gwent are the least expensive, at about £135,000. Monthly sales ran from 45,798 in January to 77,498 in October.
3. The additional price paid category
Category B covers repossessions, buy-to-let sales identified by a mortgage, transfers to companies and other non-standard sales:
B = P[P.ppd_category == "B"]
print(f"category B: {len(B):,} sales, median £{B.price.median():,.0f}; type mix {B.property_type.map(TYPES).value_counts(normalize=True).round(2).head(3).to_dict()}")
print(f"top price in the file: £{P.price.max():,.0f} (category {P.loc[P.price.idxmax(), 'ppd_category']})")
category B: 167,548 sales, median £215,000; type mix {'other': 0.32, 'terraced': 0.27, 'flat/maisonette': 0.18}
top price in the file: £180,000,000 (category B)
Category B sales have a lower median, £215,000, and a third of them are of type "other", which does not occur among standard sales at all. The highest price in the file, £180 million, is a category B transaction, which is why category B must be kept out of typical-price statistics.
Every sale of a single address
The data used on this page
HM Land Registry Price Paid Data for 2024, the yearly file pp-2024.csv as published at the time of the run, which contains HM Land Registry data © Crown copyright and database right 2026, licensed under the Open Government Licence v3.0. The yearly files are revised monthly as late registrations arrive.
from pathlib import Path

import pandas as pd
import requests

Path("data").mkdir(exist_ok=True)
CSV = Path("data/pp-2024.csv")
if not CSV.exists():
    r = requests.get("http://prod1.publicdata.landregistry.gov.uk.s3-website-eu-west-1.amazonaws.com/pp-2024.csv", timeout=1800)
    r.raise_for_status(); CSV.write_bytes(r.content)
print(f"{CSV.name}: {CSV.stat().st_size / 1e6:.0f} MB")
pp-2024.csv: 162 MB
The 2024 file is 162 MB.
Example 1: a single address
Every row has a full address. Find the sales on one street to see what a record looks like:
s = A[(A.street == "DOWNING STREET") | (A.street == "ABBEY ROAD")][["date", "price", "postcode", "property_type", "paon", "saon", "street", "town"]]
print(f"sales on Downing Street or Abbey Road in 2024: {len(s)}")
print(s.sort_values("date").head(3).to_string(index=False))
sales on Downing Street or Abbey Road in 2024: 363
date price postcode property_type paon saon street town
2024-01-08 525000 NR26 8HH D 1A NaN ABBEY ROAD SHERINGHAM
2024-01-08 365000 DN39 6TJ D ORCHARD RISE, 17 NaN ABBEY ROAD ULCEBY
2024-01-11 1322996 BS9 3QN D 9 NaN ABBEY ROAD BRISTOL
363 sales were on streets called Downing Street or Abbey Road, all over England and Wales. The first three are in Sheringham, Ulceby and Bristol. Street names are not unique, so locate sales by postcode, not by street.
Where Price Paid Data comes from
Price Paid Data comes from the registration of each sale with HM Land Registry, so it covers residential sales in England and Wales for value that are registered, including leaseholds of more than seven years. Scotland and Northern Ireland have separate registers. Each record has a transaction ID, the price, the date of transfer, the postcode and full address, the property type (detached, semi-detached, terraced, flat or other), whether the property was newly built, the tenure, and a category. Category A holds standard sales at full market value, and category B holds additional transactions such as repossessions, buy-to-let purchases and transfers to non-private individuals. The files have no header row; the column order is documented on the download page.
For price analysis, the conventions matter. Use category A for typical market prices, as the official UK House Price Index does, and medians rather than means, since a few sales at tens of millions dominate an average. Property type and new-build status change the price a lot, so compare like with like. The data is a register of sales, not of homes: areas with little turnover, or with many sales of one type, look different from their housing stock. The files change as late registrations arrive and errors are corrected, which is recorded in the record_status column of the monthly change files.
Monthly updates, no coordinates and address matching
- Monthly updates: the monthly change file has record status A (added), C (changed) and D (deleted); apply them to keep a copy current.
- No coordinates: locate sales by joining postcodes to the ONS Postcode Directory, or aggregate by
district. - Address matching: PAON and SAON (primary and secondary addressable object names) identify the building and the flat within it.
- Size: the complete file since 1995 is about 5 GB; read only the columns you need, or use DuckDB.
Internal links
- Fixing Land Registry CSVs that have no header — reading the files
- How to map house prices by local authority in Python — prices on a map
- Price paid data explained — what is and is not included
FAQ
Where can I download UK house price data?
HM Land Registry publishes Price Paid Data for England and Wales as CSV files, yearly, monthly and complete, free under the Open Government Licence.
What are the columns in Land Registry price paid data?
Transaction ID, price, date, postcode, property type, old/new, duration, PAON, SAON, street, locality, town, district, county, PPD category and record status; the files have no header.
What is PPD category A and B?
A is a standard sale at market value; B covers additional transactions such as repossessions, buy-to-let and company purchases.
Does price paid data include Scotland?
No; it covers England and Wales only.