
How to Map House Prices by Local Authority in Python
On this page
Problem statement
A map of median house prices by local authority is the standard picture of England and Wales's housing market, and Land Registry's Price Paid Data contains everything needed, except coordinates. The data names each sale's district, but the official boundaries from the Office for National Statistics are keyed by codes and spelled differently, so the join takes cleaning. The map also needs the usual care for skewed prices and for districts where few homes sold.
This page computes the median price of standard 2024 sales for every local authority district from the Price Paid file. It joins the medians to the ONS district boundaries, resolves the names that do not match, and maps the result with classes suited to prices that range several-fold across the country.
Quick answer
Aggregate by district, normalise the names on both sides, and merge:
med = A.groupby("district").price.agg(sales="size", median="median").reset_index()
norm = lambda s: s.str.upper().str.replace(r"[^A-Z ]", " ", regex=True).str.replace(r"\s+", " ", regex=True).str.strip()
med["key"] = norm(med.district)
LAD["key"] = norm(LAD.LAD24NM)
M = LAD.merge(med, on="key", how="left")
ew = M[M.LAD24CD.str[0].isin(["E", "W"])]
print(f"districts in the price data: {len(med)}; ONS districts in England and Wales: {len(ew)}; matched: {ew['median'].notna().sum()}")
print("unmatched ONS districts:", sorted(ew.loc[ew['median'].isna(), "LAD24NM"])[:8])
districts in the price data: 318; ONS districts in England and Wales: 318; matched: 307
unmatched ONS districts: ['Bristol, City of', 'Derby', 'Herefordshire, County of', 'Kingston upon Hull, City of', 'Nottingham', 'Peterborough', 'Plymouth', 'Rhondda Cynon Taf']
Both sides have 318 districts, but after normalising case and punctuation only 307 match. The 11 left over are naming conventions, such as "Bristol, City of".
Fix differing names, the spread, London and the rest
1. Fix the names that differ
The remaining mismatches are naming conventions. List the price-data districts that found no boundary, and map them by hand:
left = sorted(set(med.key) - set(LAD.key))
print("price-data districts with no ONS match:", left)
FIX = {"CITY OF BRISTOL": "BRISTOL CITY OF", "CITY OF DERBY": "DERBY", "CITY OF KINGSTON UPON HULL": "KINGSTON UPON HULL CITY OF",
       "CITY OF NOTTINGHAM": "NOTTINGHAM", "CITY OF PETERBOROUGH": "PETERBOROUGH", "CITY OF PLYMOUTH": "PLYMOUTH", "CITY OF WESTMINSTER": "WESTMINSTER",
       "HEREFORDSHIRE": "HEREFORDSHIRE COUNTY OF", "RHONDDA CYNON TAFF": "RHONDDA CYNON TAF", "THE VALE OF GLAMORGAN": "VALE OF GLAMORGAN", "WREKIN": "TELFORD AND WREKIN"}
med["key"] = med.key.replace(FIX)
M = LAD.merge(med, on="key", how="left"); ew = M[M.LAD24CD.str[0].isin(["E", "W"])]
print(f"matched after fixes: {ew['median'].notna().sum()} of {len(ew)}; still unmatched: {sorted(ew.loc[ew['median'].isna(), 'LAD24NM'])}")
price-data districts with no ONS match: ['CITY OF BRISTOL', 'CITY OF DERBY', 'CITY OF KINGSTON UPON HULL', 'CITY OF NOTTINGHAM', 'CITY OF PETERBOROUGH', 'CITY OF PLYMOUTH', 'CITY OF WESTMINSTER', 'HEREFORDSHIRE', 'RHONDDA CYNON TAFF', 'THE VALE OF GLAMORGAN', 'WREKIN']
matched after fixes: 318 of 318; still unmatched: []
Land Registry writes "CITY OF BRISTOL" where ONS writes "Bristol, City of", "RHONDDA CYNON TAFF" for "Rhondda Cynon Taf", and "WREKIN" for Telford and Wrekin. With those 11 mapped, all 318 districts match.
2. The spread of prices
d = ew.dropna(subset=["median"])
print(f"median price by district: £{d['median'].min():,.0f} ({d.loc[d['median'].idxmin(), 'LAD24NM']}) to £{d['median'].max():,.0f} ({d.loc[d['median'].idxmax(), 'LAD24NM']})")
print(f"ratio of highest to lowest: {d['median'].max() / d['median'].min():.1f}; districts with fewer than 500 sales: {(d.sales < 500).sum()}")
q = d['median'].quantile([0.2, 0.4, 0.6, 0.8]).round(-3)
print("quintile breaks:", {f"{int(k * 100)}%": f"£{v:,.0f}" for k, v in q.items()})
median price by district: £130,000 (Burnley) to £1,237,500 (Kensington and Chelsea)
ratio of highest to lowest: 9.5; districts with fewer than 500 sales: 2
quintile breaks: {'20%': '£210,000', '40%': '£260,000', '60%': '£331,000', '80%': '£428,000'}
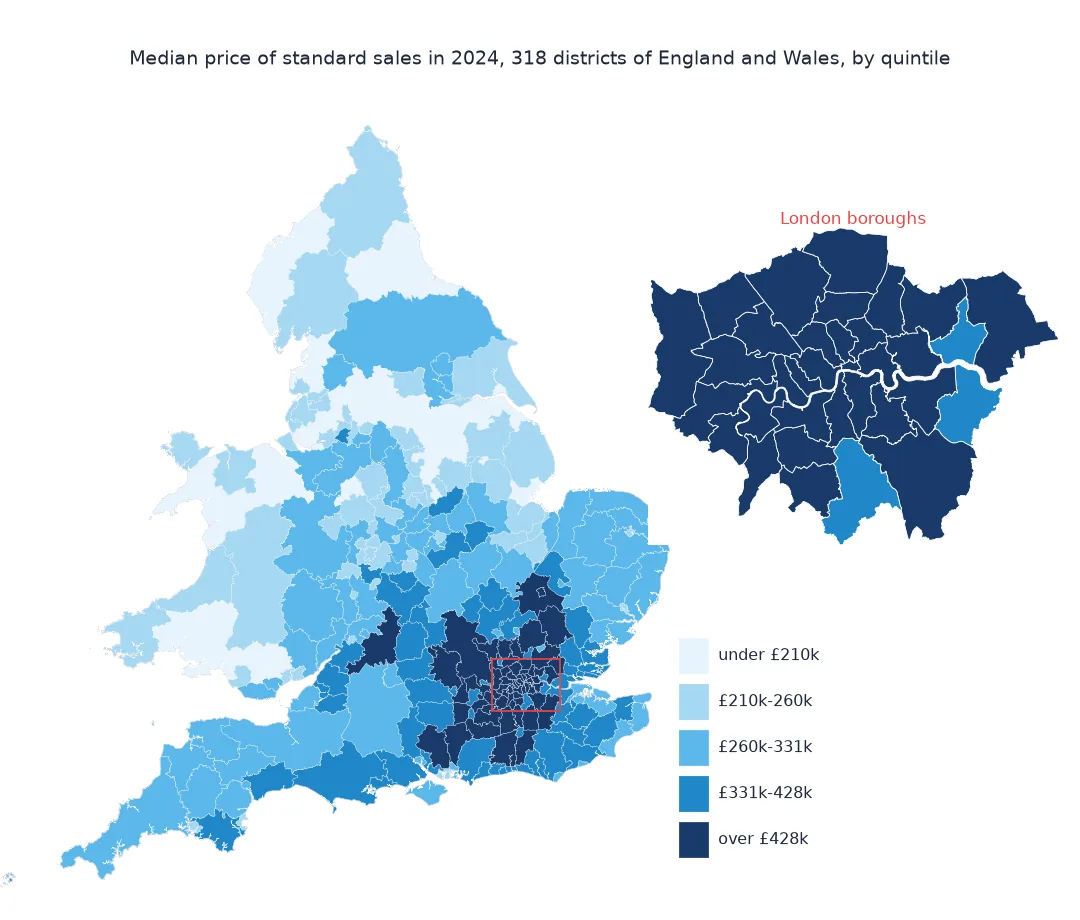
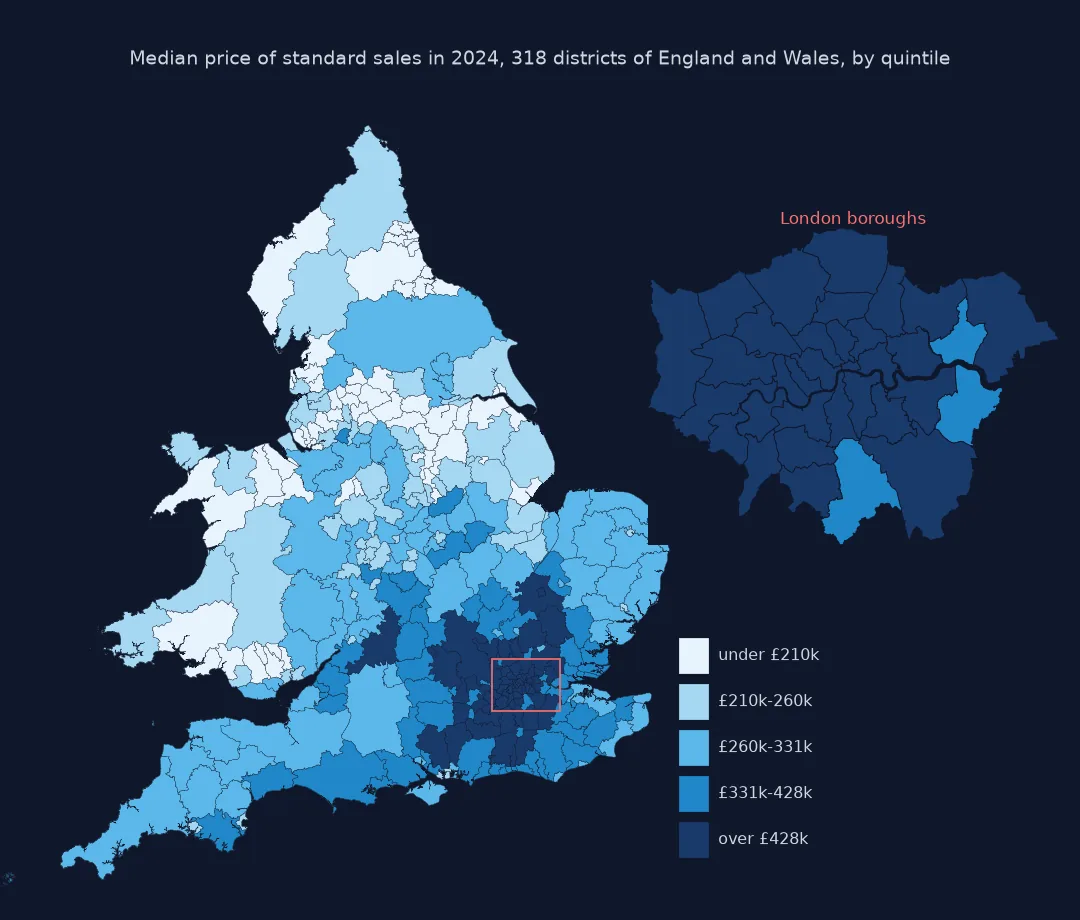
District medians range from £130,000 in Burnley to £1,237,500 in Kensington and Chelsea, 9.5 times as much. Only two districts had fewer than 500 sales. The quintile breaks, at £210,000, £260,000, £331,000 and £428,000, make each colour hold a fifth of the districts.
3. London and the rest
london = d[d.LAD24CD.str.startswith("E09")]
print(f"London boroughs: {len(london)}, medians £{london['median'].min():,.0f} to £{london['median'].max():,.0f}; districts outside London above £500,000: {((d['median'] > 500_000) & ~d.LAD24CD.str.startswith('E09')).sum()}")
London boroughs: 33, medians £362,000 to £1,237,500; districts outside London above £500,000: 9
London's 33 boroughs range from £362,000 to £1,237,500, and only 9 districts outside London have a median above £500,000.
Price change over five years
The data used on this page
HM Land Registry Price Paid Data for 2024, standard sales (category A), © Crown copyright 2026, Open Government Licence; and the ONS Local Authority Districts (December 2024) boundaries, generalised and clipped to the coastline, from the ONS Open Geography Portal (© Crown copyright, OGL).
from pathlib import Path

import geopandas as gpd
import pandas as pd
import requests

Path("data").mkdir(exist_ok=True)
CSV = Path("data/pp-2024.csv")
if not CSV.exists():
    r = requests.get("http://prod1.publicdata.landregistry.gov.uk.s3-website-eu-west-1.amazonaws.com/pp-2024.csv", timeout=1800); r.raise_for_status(); CSV.write_bytes(r.content)
COLS = ["transaction_id", "price", "date", "postcode", "property_type", "old_new", "duration", "paon", "saon",
        "street", "locality", "town", "district", "county", "ppd_category", "record_status"]
A = pd.read_csv(CSV, header=None, names=COLS, usecols=["price", "district", "ppd_category"]).query("ppd_category == 'A'")
GJ = Path("data/lad_2024_bgc.geojson")
if not GJ.exists():
    url = "https://services1.arcgis.com/ESMARspQHYMw9BZ9/arcgis/rest/services/Local_Authority_Districts_December_2024_Boundaries_UK_BGC/FeatureServer/0/query"
    r = requests.get(url, params={"where": "1=1", "outFields": "LAD24CD,LAD24NM", "outSR": 4326, "f": "geojson"}, timeout=600); r.raise_for_status(); GJ.write_bytes(r.content)
LAD = gpd.read_file(GJ)
print(f"{len(A):,} standard sales; {len(LAD)} UK local authority districts")
763,905 standard sales; 361 UK local authority districts
The price data has 763,905 standard sales. The ONS file has 361 districts across the UK, 318 of them in England and Wales.
Example 1: price change from five years earlier
Join the 2019 file the same way to see which districts rose most. District reorganisations since 2019 mean the two years use different names, so compare only districts with enough sales under the same name in both:
CSV19 = Path("data/pp-2019.csv")
if not CSV19.exists():
    r = requests.get("http://prod1.publicdata.landregistry.gov.uk.s3-website-eu-west-1.amazonaws.com/pp-2019.csv", timeout=1800); r.raise_for_status(); CSV19.write_bytes(r.content)
A19 = pd.read_csv(CSV19, header=None, names=COLS, usecols=["price", "district", "ppd_category"]).query("ppd_category == 'A'")
g19 = A19.groupby("district").price.agg(sales_19="size", median_19="median")
both = med.set_index("district").join(g19, how="inner")
both = both[(both.sales >= 500) & (both.sales_19 >= 500)]                    # reorganised districts have too few sales under the new name in 2019
ch = both["median"] / both.median_19 - 1
print(f"district names in 2019: {A19.district.nunique()}, in 2024: {med.district.nunique()}; with 500+ sales in both years: {len(ch)}")
print(f"median change {ch.median():+.0%}; largest rise {ch.max():+.0%} ({ch.idxmax().title()}); smallest {ch.min():+.0%} ({ch.idxmin().title()})")
district names in 2019: 361, in 2024: 318; with 500+ sales in both years: 309
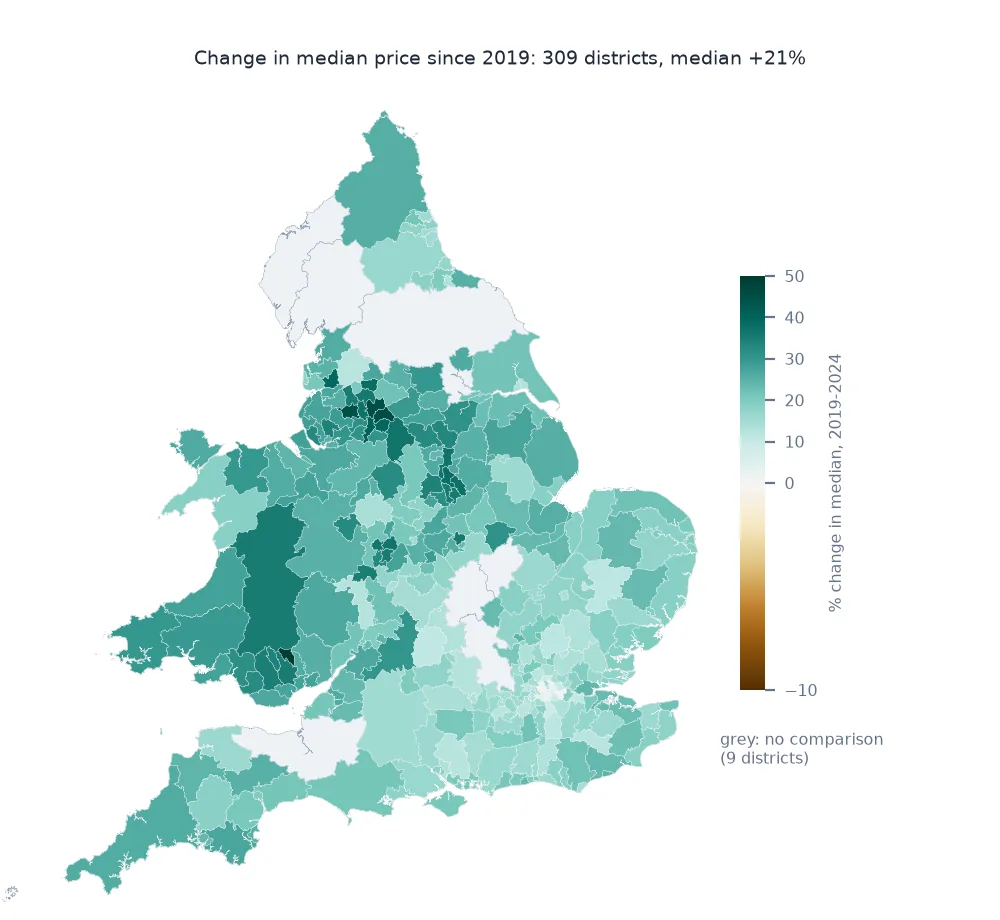
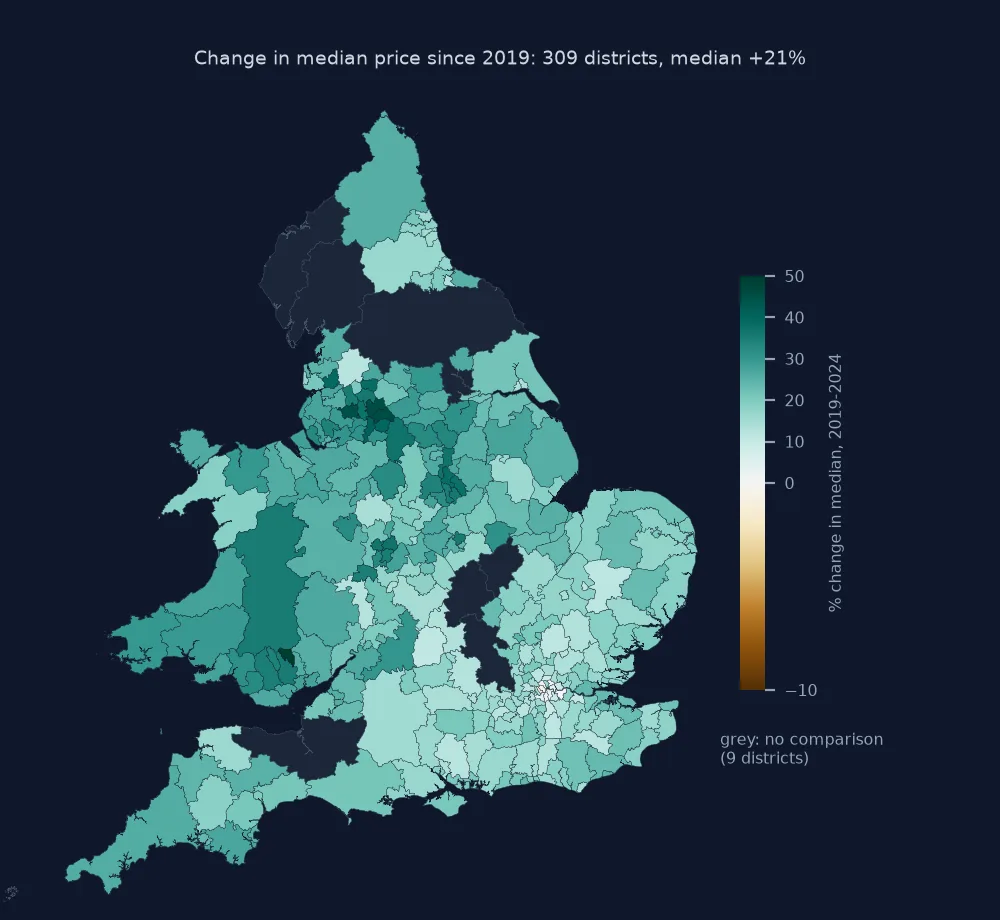
median change +21%; largest rise +50% (Blaenau Gwent); smallest -1% (Kensington And Chelsea)
The 2019 file uses 361 district names and the 2024 file 318, because of reorganisations such as the new Cumberland and North Yorkshire councils. 309 districts have 500 or more sales under the same name in both years. Their median price rose by a median of 21%, from −1% in Kensington and Chelsea to +50% in Blaenau Gwent.
Land Registry names against ONS names
Price Paid records carry the name of the local authority district in which the property sits, in capitals, as Land Registry spells it. The ONS boundary files, which every official map uses, identify districts by nine-character GSS codes (E06, E07, E08 and E09 in England, W06 in Wales) and give names in their own forms, such as "Bristol, City of". Joining the two means normalising case and punctuation, then mapping the few names that follow different conventions. Reorganisations also matter: districts merge and new unitary authorities are created, so the price data and the boundaries must refer to the same year, or the unmatched list grows.
House prices across England and Wales vary several-fold, from former industrial towns in the north and Wales to central London. Equal-interval classes would put most of the country in one colour, so quantiles or other data-driven breaks show the gradient better, with the breaks shown in the legend. Medians should come from standard sales only, and districts with few sales flagged, since a median from a few hundred sales moves with the mix of homes sold that year.
Codes, boundary vintages and mix effects
- Codes are better than names: where possible, join on GSS codes, for example by assigning sales to districts through the ONS Postcode Directory.
- Boundary vintages: use boundaries from the same year as the data; 2023 saw reorganisations in Cumbria, North Yorkshire and Somerset.
- Scotland and Northern Ireland: the ONS file covers the whole UK, but the price data does not; drop codes beginning S and N.
- Mix effects: a district selling mostly flats has a lower median than one selling houses; mix-adjusted indices correct for it.
Internal links
- How to analyse HM Land Registry price paid data in Python — the data
- Fixing local authority names that do not match boundaries — the join in detail
- Choropleth classification explained — choosing classes
FAQ
How do I make a map of UK house prices in Python?
Compute median Price Paid prices by district, join them to the ONS local authority boundaries, and plot a choropleth with quantile classes.
Why don't Land Registry district names match the ONS boundaries?
They follow different naming conventions, such as "CITY OF BRISTOL" versus "Bristol, City of"; normalise the names and map the exceptions.
Should I use mean or median house prices?
The median; a few very expensive sales pull the mean far above a typical price.
Where can I download local authority boundaries?
From the ONS Open Geography Portal, as GeoJSON or shapefiles, for each year's boundaries.