
How to Build a High-Injury Network from Crash Data in Python
On this page
Problem statement
Cities with Vision Zero programmes publish a high-injury network: the small share of streets where most people are killed or seriously injured in crashes. It turns thousands of crash points into a list of corridors to redesign. Building one means choosing a severity threshold, snapping crashes to street segments, ranking segments by injuries per mile so that long streets do not win by length alone, and checking that the concentration is more than a few unlucky blocks in a sparse dataset.
This page builds one for Chicago from three years of crashes, 2022–2024, in which someone was killed or incapacitated, using the city's crash records and street segments from the Census Bureau's TIGER/Line edges, and compares the result with what the same number of injuries spread over the streets in proportion to length would give.
Quick answer
Snap killed-or-seriously-injured crashes to segments, rank segments by KSI per mile, and find the share of KSI on the top few percent of street miles:
j = gpd.sjoin_nearest(KSI, SEG[["geometry"]], max_distance=200, distance_col="moved_ft")
j = j[~j.index.duplicated()]
SEG["ksi"] = j.groupby("index_right").ksi.sum().reindex(SEG.index, fill_value=0)
SEG["miles"] = SEG.length / 5280
order = SEG.assign(rate=SEG.ksi / SEG.miles).sort_values("rate", ascending=False)
miles_share, ksi_share = order.miles.cumsum() / order.miles.sum(), order.ksi.cumsum() / order.ksi.sum()
for q in (0.02, 0.05, 0.10):
    print(f"top {q:.0%} of street miles by KSI per mile: {ksi_share[miles_share <= q].iloc[-1]:.1%} of killed and seriously injured")
top 2% of street miles by KSI per mile: 41.0% of killed and seriously injured
top 5% of street miles by KSI per mile: 69.6% of killed and seriously injured
top 10% of street miles by KSI per mile: 95.5% of killed and seriously injured
Ranked by KSI per mile, the worst 2% of Chicago's 4,247 street miles carried 41.0% of the people killed or seriously injured in 2022–2024, the worst 5% carried 69.6%, and the worst 10% almost all of them.
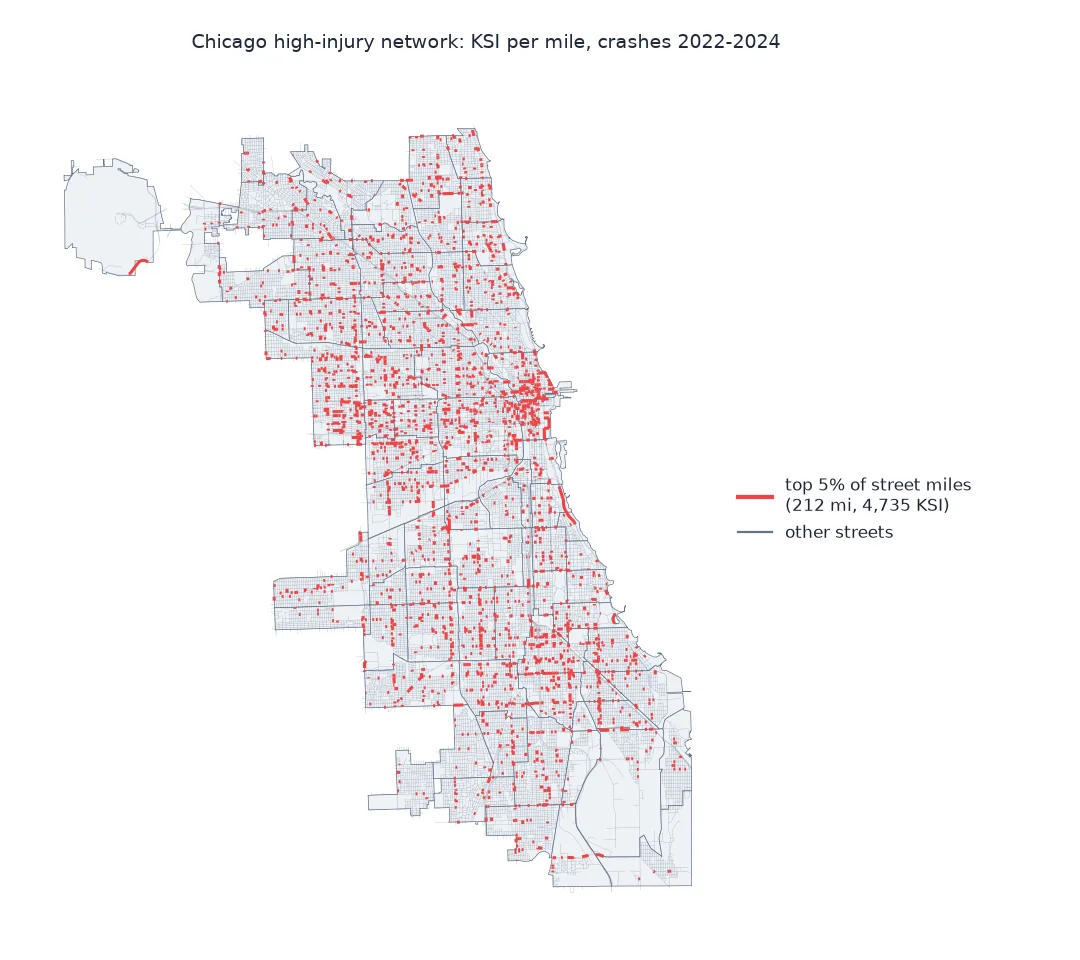
A severity threshold, checked snapping, length-based comparison
1. Choose the severity threshold
Chicago's crash records count injuries by severity on each crash. Killed or seriously injured (KSI) here means at least one fatal or incapacitating injury:
print(f"KSI crashes 2022-2024: {len(RAW):,}; with coordinates: {RAW.latitude.notna().sum():,}")
print(f"people killed: {KSI.injuries_fatal.sum()}; incapacitated: {KSI.injuries_incapacitating.sum():,}; KSI total {KSI.ksi.sum():,}")
print(KSI.first_crash_type.value_counts().head(4).to_string())
KSI crashes 2022-2024: 5,867; with coordinates: 5,831
people killed: 421; incapacitated: 6,398; KSI total 6,819
first_crash_type
PEDESTRIAN 1385
ANGLE 918
TURNING 822
REAR END 544
5,867 crashes killed 421 people and incapacitated 6,398. Pedestrian crashes are the largest single type, 1,385, followed by angle and turning crashes at intersections.
2. Check the snapping
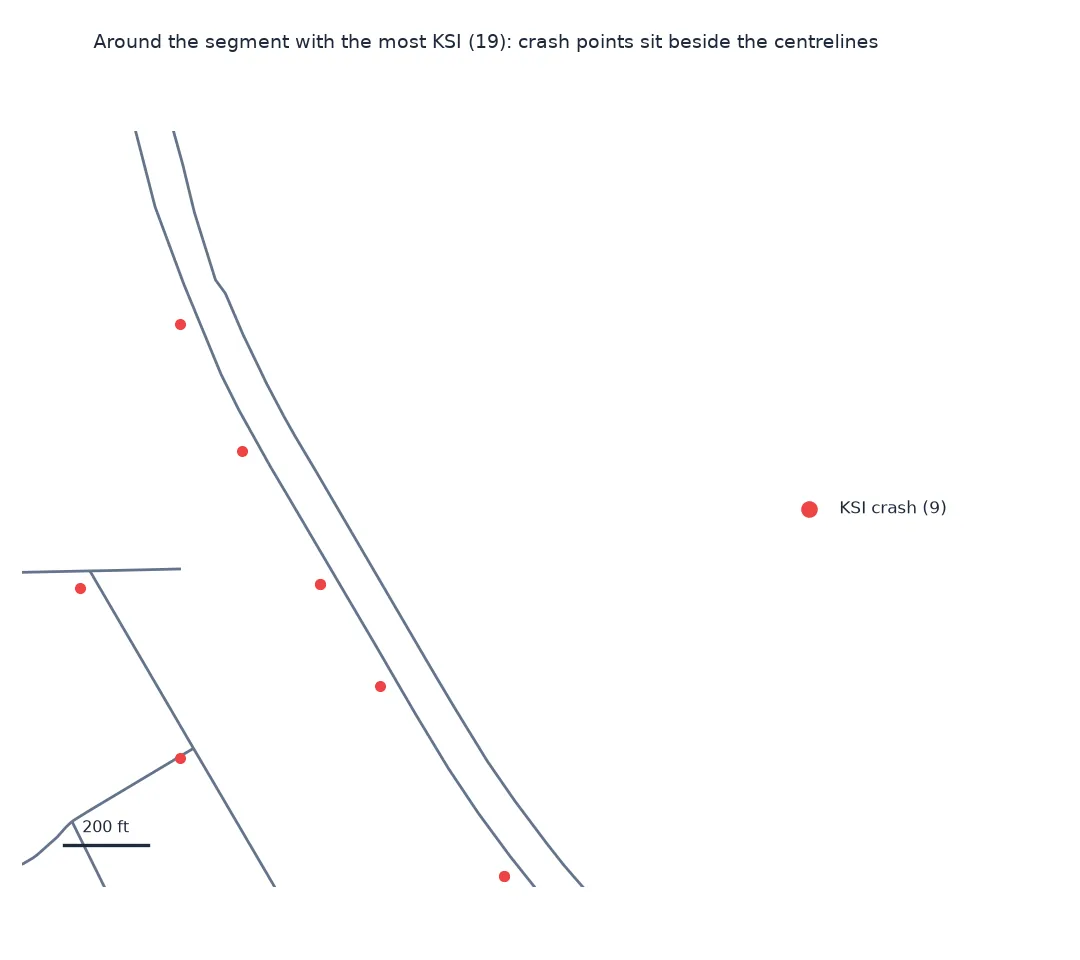
Crash locations come from police reports and are not placed on street centrelines, unlike the city's crime points. Check how far they move and how many fail:
print(f"snapped: {len(j):,} of {len(KSI):,}; distance moved median {j.moved_ft.median():.0f} ft, 90th percentile {j.moved_ft.quantile(0.9):.0f} ft")
print(f"segments with any KSI: {(SEG.ksi > 0).sum():,} of {len(SEG):,} ({(SEG.ksi > 0).mean():.1%})")
snapped: 5,820 of 5,831; distance moved median 34 ft, 90th percentile 40 ft
segments with any KSI: 4,664 of 47,057 (9.9%)
Crash points sit about 34 feet from the centreline, nine in ten within 40 feet: they are placed consistently off the street's centre, not scattered, so a 200-foot tolerance loses only 11 crashes. Fewer than one segment in ten had a KSI crash in three years.
3. Compare with injuries spread by length
A sparse count concentrates by chance: with about 6,000 injuries and 47,000 segments, most segments must be empty. Scatter the same total over the segments in proportion to their length and run the same ranking:
rng = np.random.default_rng(0)
sim = rng.poisson(SEG.ksi.sum() * SEG.miles / SEG.miles.sum())
o2 = SEG.assign(k=sim, rate=sim / SEG.miles).sort_values("rate", ascending=False)
m2, k2 = o2.miles.cumsum() / o2.miles.sum(), o2.k.cumsum() / o2.k.sum()
for q in (0.02, 0.05, 0.10):
    print(f"top {q:.0%} of miles: observed {ksi_share[miles_share <= q].iloc[-1]:.1%}, spread by length {k2[m2 <= q].iloc[-1]:.1%}")
top 2% of miles: observed 41.0%, spread by length 24.5%
top 5% of miles: observed 69.6%, spread by length 50.1%
top 10% of miles: observed 95.5%, spread by length 75.6%
Even spread in proportion to length, the same number of injuries would put half of them on the top 5% of miles, because nine segments in ten must be empty. The observed 69.6% is the excess that says something about the streets: about twenty points at 5%, and similar margins at 2% and 10%.
Naming Chicago's high-injury corridors
The data used on this page
The City of Chicago's Traffic Crashes - Crashes dataset (85ca-t3if), crashes from 2022 to 2024 with at least one fatal or incapacitating injury, selected on the server; street segments from the Census Bureau's TIGER/Line 2023 edges for Cook County, merged at false nodes with momepy; and the community area boundaries.
from pathlib import Path

import geopandas as gpd
import momepy
import numpy as np
import pandas as pd
import requests

Path("data").mkdir(exist_ok=True)
F = Path("data/chicago_ksi_crashes_2022_2024.parquet")
if not F.exists():
    rows, offset = [], 0
    while True:
        part = requests.get("https://data.cityofchicago.org/resource/85ca-t3if.json", timeout=300, params={
            "$where": "crash_date >= '2022-01-01' AND crash_date < '2025-01-01' AND (injuries_fatal > 0 OR injuries_incapacitating > 0)",
            "$limit": 50_000, "$offset": offset, "$order": "crash_record_id",
            "$select": "crash_record_id,crash_date,posted_speed_limit,first_crash_type,injuries_fatal,injuries_incapacitating,latitude,longitude,street_name"}).json()
        rows += part; offset += len(part)
        if len(part) < 50_000:
            break
    pd.DataFrame(rows).to_parquet(F)
SRC = {"chicago_community_areas.geojson": "https://data.cityofchicago.org/resource/igwz-8jzy.geojson?$limit=100",
       "tl_2023_17031_edges.zip": "https://www2.census.gov/geo/tiger/TIGER2023/EDGES/tl_2023_17031_edges.zip"}
for name, url in SRC.items():
    if not Path("data", name).exists():
        Path("data", name).write_bytes(requests.get(url, timeout=600).content)

RAW = pd.read_parquet(F)
k = RAW.dropna(subset=["latitude", "longitude"]).astype({"latitude": float, "longitude": float, "injuries_fatal": int, "injuries_incapacitating": int})
k = k[(k.latitude > 41) & (k.longitude < -87)]                             # a few records carry 0,0
k["ksi"] = k.injuries_fatal + k.injuries_incapacitating
KSI = gpd.GeoDataFrame(k, geometry=gpd.points_from_xy(k.longitude, k.latitude), crs=4326).to_crs(3435)
CITY = gpd.read_file("data/chicago_community_areas.geojson").to_crs(3435).union_all()
edges = gpd.read_file("data/tl_2023_17031_edges.zip", columns=["FULLNAME", "MTFCC"])
roads = edges[edges.MTFCC.isin(["S1100", "S1200", "S1400"])].to_crs(3435)
roads = roads[roads.intersects(CITY.buffer(500))].reset_index(drop=True)
SEG = momepy.remove_false_nodes(roads[["FULLNAME", "geometry"]])
SEG = SEG[SEG.intersects(CITY)].reset_index(drop=True)
print(f"{len(KSI):,} KSI crashes with usable coordinates; {len(SEG):,} street segments, {SEG.length.sum() / 5280:,.0f} miles")
5,831 KSI crashes with usable coordinates; 47,057 street segments, 4,247 miles
Example 1: name the corridors
A network is easier to act on as named corridors. Sum KSI by the street name on the crash reports and divide by the length of that street's segments:
by_street = j.groupby("street_name").ksi.sum().sort_values(ascending=False)
print(f"street names on KSI crash reports: {by_street.size:,}; top 10 hold {by_street.head(10).sum() / by_street.sum():.1%} of KSI")
print(by_street.head(6).to_string())
street names on KSI crash reports: 620; top 10 hold 20.8% of KSI
street_name
WESTERN AVE 200
CICERO AVE 192
PULASKI RD 188
HALSTED ST 167
ASHLAND AVE 163
KEDZIE AVE 123
620 street names appear on the reports, and ten of them carry a fifth of all KSI. Western Avenue, Cicero Avenue, Pulaski Road, Halsted Street and Ashland Avenue, long north-south arterials crossing the city, top the list.
A prioritisation tool for rare, clustered harm
A high-injury network is a prioritisation tool. Severe injuries are rare at any one place but cluster on a limited set of streets, typically wide, fast arterials with many conflicts between cars, pedestrians and turning traffic. Ranking segments by KSI per mile, rather than by count, puts short dangerous blocks and long dangerous corridors on the same scale; summing along named streets turns the result into corridors that can be redesigned as projects.
Two checks keep the network honest. The first is the comparison with chance: with far more segments than injuries, any ranking of sparse counts looks concentrated, and only the excess over a length-proportional scattering is evidence about the streets. The second is stability: a network drawn from three years should overlap substantially with one drawn from the next three, and pooling years, as here, is the usual way to get there. Crash data also carries its own limits: police reports locate crashes approximately, injury severity is judged at the scene, and crashes on expressways, handled by the state police, may be missing.
Thresholds, short segments and exposure
- Severity threshold: including all injury crashes gives a denser, more stable network but one weighted towards minor crashes.
- Short segments: a 30-foot segment with one KSI has an enormous rate; the miles-share ranking keeps them from dominating, and a minimum length is common.
- Intersections: many severe crashes happen at intersections; assigning them to one approach splits their effect.
- Exposure: KSI per mile ignores traffic volume; per vehicle-mile rates need traffic counts.
- Expressways: interstates (
S1100) are in the segments; their crashes may be under-recorded in city data.
Internal links
- How to count crime on street segments in Python — the same segments for crime
- Crime concentration explained — concentration against chance
- How to map fatal road crashes in the US with FARS in Python — national fatal crashes
FAQ
What is a high-injury network?
The small share of a city's streets where most people are killed or seriously injured in traffic crashes, used by Vision Zero programmes to prioritise street redesigns.
How do I build a high-injury network in Python?
Snap killed-or-seriously-injured crashes to street segments, rank segments by KSI per mile, and select the top segments until they cover a chosen share of injuries or street miles.
Why rank streets by injuries per mile?
Because long streets collect more crashes by length alone; a rate per mile compares streets of different lengths fairly.
How concentrated are severe crashes on Chicago streets?
In 2022–2024, the top 5% of street miles by KSI per mile held about seven in ten killed and seriously injured.