
Why Do My Crime Counts Change Every Time I Download the Data?
On this page
Problem statement
You count last year's crimes, publish the numbers, and a colleague who downloads the same dataset a few months later gets different ones. Neither of you made a mistake. Open crime data is a live extract from a police records system: offences reported long after they happened keep arriving with old dates, records are reclassified as investigations proceed, and locations are corrected. A count is a count as of a date, and without that date it cannot be reproduced.
This page measures how many of Chicago's 2024 records arrived after the year was over, using the fact that record IDs are issued in sequence, finds which offence types arrive late, looks at what the updated_on field does and does not tell you, and sets up a download that records its date and fetches only what changed.
Quick answer
Estimate when each record entered the system from its ID, and count the ones dated 2024 that arrived after a download made in early 2025 would have been taken:
x = C[C.id > 1_000_000].copy()                                        # homicides use a separate, low ID sequence
x["entered"] = pd.Timestamp("2024-01-01") + pd.to_timedelta(np.interp(x.id, CLOCK.med, CLOCK.day), unit="D")
for cut in ("2025-01-08", "2025-07-01", "2026-01-01"):
    late = x.entered > pd.Timestamp(cut)
    print(f"2024 records entered after {cut}: {late.sum():,} ({late.mean():.2%})")
2024 records entered after 2025-01-08: 3,421 (1.32%)
2024 records entered after 2025-07-01: 1,023 (0.39%)
2024 records entered after 2026-01-01: 475 (0.18%)
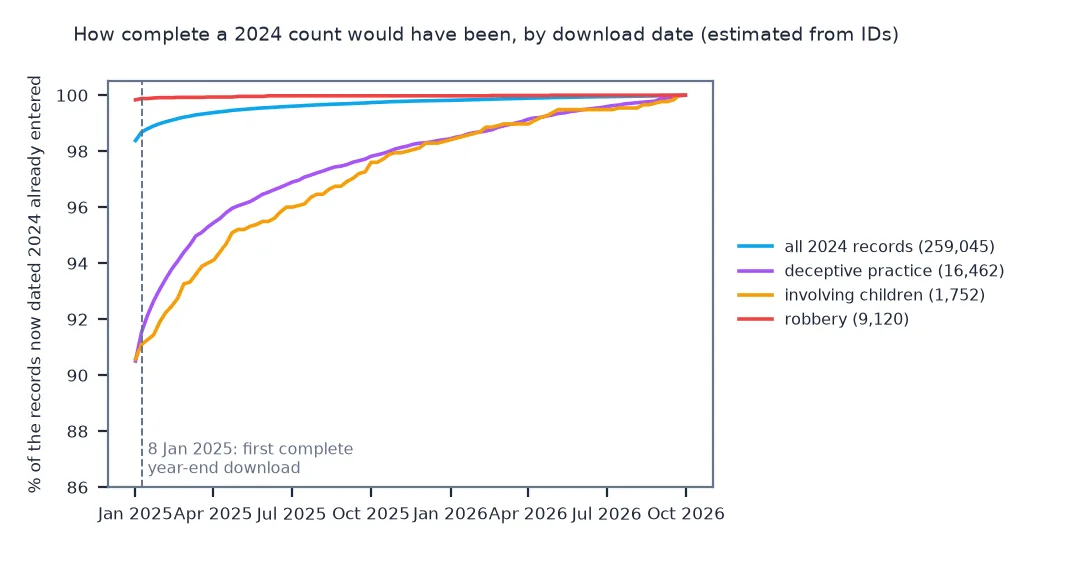
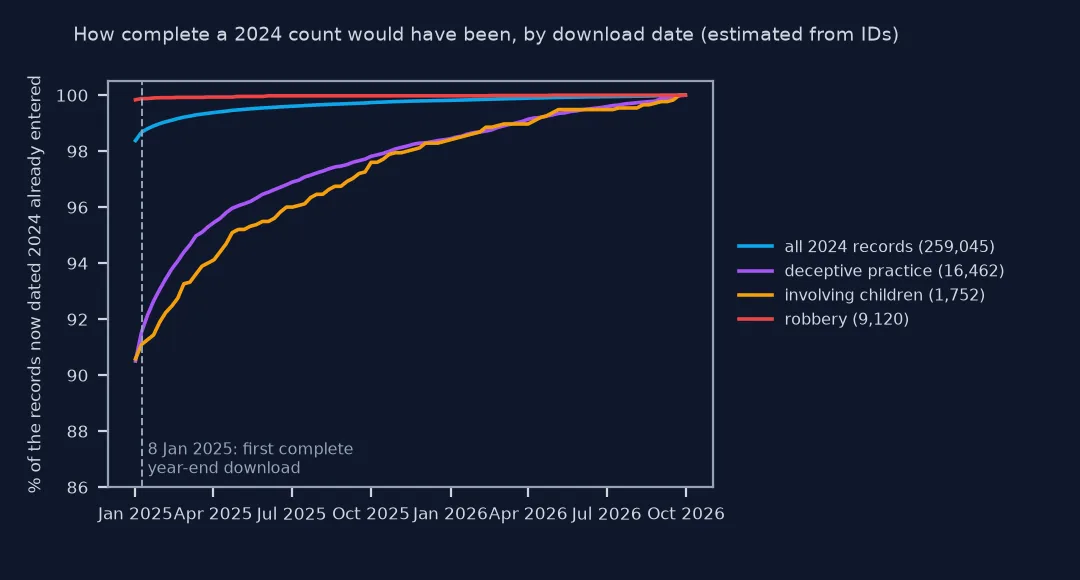
A count of 2024 made on 8 January 2025, the first day the dataset could include all of December, would have missed 3,421 records, 1.32% of the eventual total. 1,023 arrived after July 2025 and 475 after the start of 2026, more than a year late.
An entry clock from ids, late offences, update times
1. Build an entry clock from the IDs
Each new record gets the next ID. For each day since January 2024, the median ID of records dated that day is close to the IDs being issued then, because most records are entered within days. Check that the clock runs forwards and how fast:
per_day = np.diff(CLOCK.med.values).mean()
print(f"{len(CLOCK)} days; IDs issued per day on average: {per_day:,.0f}")
print(f"records dated 2024 by ID sequence: {(C.id > 1_000_000).sum():,} main, {(C.id <= 1_000_000).sum()} in the low sequence, "
      f"{C[C.id <= 1_000_000].primary_type.value_counts().to_dict()}")
lag = (x.entered - x.time).dt.days
print(f"estimated entry delay: median {lag.median():.0f} days, 95th percentile {lag.quantile(0.95):.0f}, 99th {lag.quantile(0.99):.0f}")
998 days; IDs issued per day on average: 1,017
records dated 2024 by ID sequence: 259,045 main, 593 in the low sequence, {'HOMICIDE': 593}
estimated entry delay: median -1 days, 95th percentile 18, 99th 161
The clock issues about 1,017 IDs a day. Its error shows in the median delay of minus one day: records dated on a day get IDs over the following days, so the median ID for that day runs slightly ahead. The tail is what matters, and it is long: one record in twenty arrives more than 18 days after its date, one in a hundred more than 161 days.
2. See which offences arrive late
late = x.entered > pd.Timestamp("2025-01-08")
share = (x[late].primary_type.value_counts() / x.primary_type.value_counts()).dropna().sort_values(ascending=False)
print("share of each type entered after 8 Jan 2025:")
print(share.head(5).map("{:.1%}".format).to_string())
print("largest numbers:", x[late].primary_type.value_counts().head(3).to_dict())
print(f"robbery: {share.get('ROBBERY', 0):.1%}; battery: {share.get('BATTERY', 0):.1%}; all types: {late.mean():.1%}")
share of each type entered after 8 Jan 2025:
primary_type
HUMAN TRAFFICKING 21.7%
OBSCENITY 11.3%
OFFENSE INVOLVING CHILDREN 8.9%
DECEPTIVE PRACTICE 8.5%
SEX OFFENSE 7.9%
largest numbers: {'DECEPTIVE PRACTICE': 1393, 'THEFT': 637, 'OTHER OFFENSE': 326}
robbery: 0.1%; battery: 0.4%; all types: 1.3%
Over a fifth of human trafficking records and about one in eleven for offences involving children and for deceptive practice arrive after the year-end download date, against 0.1% for robbery. By number, deceptive practice dominates, with 1,393 late records.
3. Read updated_on carefully
Every record has an updated_on timestamp. It shows when the row last changed in the published extract, which includes bulk reprocessing, not only corrections:
u = pd.to_datetime(C.updated_on)
print(f"2024 records last updated in 2025 or later: {(u >= '2025-01-01').mean():.1%}")
top = u.dt.to_period("M").value_counts().head(1)
print(f"busiest update month: {top.index[0]} with {top.iloc[0]:,} rows")
print(f"updated in the last 30 days before download: {(u >= u.max() - pd.Timedelta(days=30)).sum():,}")
2024 records last updated in 2025 or later: 65.4%
busiest update month: 2025-05 with 135,327 rows
updated in the last 30 days before download: 409
Two thirds of 2024 records were last updated in 2025 or later, 135,327 of them in May 2025 alone. That is a bulk rewrite of the extract, not 135,327 corrections, so updated_on says that a row may have changed, not that it did or how.
A repeatable, updatable download
The data used on this page
The City of Chicago's Crimes - 2001 to Present (ijzp-q8t2): every record dated 2024, and the median record ID per day for records dated from January 2024, aggregated on the server, as downloaded on the date the page was run.
from pathlib import Path

import numpy as np
import pandas as pd
import requests

Path("data").mkdir(exist_ok=True)
URL = "https://data.cityofchicago.org/resource/ijzp-q8t2.json"
F = Path("data/chicago_crimes_2024.parquet")
if not F.exists():
    rows, offset = [], 0
    while True:
        part = requests.get(URL, timeout=300, params={
            "$where": "year=2024", "$limit": 50_000, "$offset": offset, "$order": "id",
            "$select": "id,date,primary_type,arrest,domestic,community_area,latitude,longitude,location_description,block,updated_on"}).json()
        rows += part; offset += len(part)
        if len(part) < 50_000:
            break
    pd.DataFrame(rows).to_parquet(F)
C = pd.read_parquet(F).astype({"id": int})
C["time"] = pd.to_datetime(C.date)
f = Path("data/id_clock.json")
if not f.exists():
    f.write_bytes(requests.get(URL, timeout=300, params={
        "$select": "date_trunc_ymd(date) AS day, median(id) AS med", "$where": "year >= 2024 AND id > 1000000",
        "$group": "day", "$order": "day", "$limit": 5000}).content)
CLOCK = pd.read_json(f).assign(day=lambda d: (pd.to_datetime(d.day) - pd.Timestamp("2024-01-01")).dt.days)
CLOCK["med"] = np.maximum.accumulate(CLOCK.med.astype(float))       # force the clock to run forwards
print(f"{len(C):,} records dated 2024; ID clock over {len(CLOCK)} days")
259,638 records dated 2024; ID clock over 998 days
Example 1: a download that can be repeated and updated
Save every download with its date, and fetch later changes with updated_on instead of downloading everything again:
stamp = pd.Timestamp.now(tz="America/Chicago").strftime("%Y-%m-%d")
last = pd.to_datetime(C.updated_on).max()
since = requests.get(URL, timeout=120, params={
    "$select": "count(*) AS n", "$where": f"year = 2024 AND updated_on > '{last:%Y-%m-%dT%H:%M:%S}'"}).json()[0]["n"]
print(f"snapshot would be saved as chicago_crimes_2024_{stamp}.parquet")
print(f"newest updated_on in the snapshot: {last:%Y-%m-%d %H:%M}; 2024 rows changed since then: {since}")
snapshot would be saved as chicago_crimes_2024_2026-10-01.parquet
newest updated_on in the snapshot: 2026-09-30 15:43; 2024 rows changed since then: 0
No 2024 row had changed between the snapshot and this query, which is what a fresh snapshot should show; run weeks later, the same query returns the rows to fetch.
A police records system is a working database
A police records system is a working database. Offences are reported days, months or years after they happen and are entered with their occurrence date; investigations change classifications, add arrests and fix locations. The open data extract is refreshed from that system, so its past changes as well as its present. Chicago's dataset withholds the latest seven days, but the changes do not stop after a week.
The size of the effect depends on the offence. Fraud, offences involving children and sexual offences are often reported long after the event, and a noticeable share of each year's records for them arrives in the following year or later. Street crimes such as robbery are reported quickly and change little. So a comparison of this year's partial count with last year's complete one is biased towards a fall, and most strongly for the late-arriving types.
The practical response is bookkeeping. Keep dated snapshots, report counts with their download date, compare like with like (both counts as of the same delay after year end), and fetch increments by updated_on rather than replacing the whole file. The ID sequence used here is a reconstruction, not a field the city publishes; it is good enough to show the scale of late arrivals, not to date individual records.
Deleted records and bulk updates
- Deleted records: records removed from the extract simply disappear; only comparing snapshots by ID shows them.
- Low IDs: homicide records use a separate ID sequence, one row per victim, and are left out of the entry clock.
- Bulk updates: a month in which over a hundred thousand old rows were touched at once is reprocessing, not a hundred thousand corrections.
- The seven-day lag: it applies to new records; corrections to old ones appear whenever they are made.
- Other cities: many portals behave the same way; look for an
updatedorlast_modifiedfield and a statement about lags.
Internal links
- How to analyse crime trends over time in Python — complete months and comparable periods
- Why are coordinates missing from my crime data? — another change in what is published
- How to download and map city crime data in Python — the dataset
FAQ
Why do crime statistics change after they are published?
Because late reports keep arriving with old dates, and records are reclassified or corrected as investigations proceed; an open dataset is refreshed from the live system.
How many crimes are reported late?
In Chicago's 2024 records, about 1.3% were entered after 8 January 2025, when a year-end download could first include all of December; for fraud the share was about 8%, for human trafficking over a fifth.
How do I make crime counts reproducible?
Save each download with its date, report counts as of that date, and compare periods at the same delay after they end.
How do I download only changed crime records?
Filter on the updated_on field with a SoQL $where, using the newest value in your last snapshot.