
How to Analyse Road Death Trends with FARS in Python
On this page
Problem statement
US road deaths fell for decades, then rose sharply from 2020, at a time when Americans were driving less. A trend like that raises the obvious questions: who was killed, where, and has it reversed? FARS answers them year by year, but each year is a separate download whose file and column names have drifted, and a national total hides groups moving at different speeds.
This page stacks the FARS person files for 2017–2023, counts deaths by year and by road user (drivers, passengers, pedestrians, cyclists and people on motorcycles), measures the change from 2019 to 2023 for each group, and maps the change by state.
Quick answer
Read the killed people (INJ_SEV 4) from each year's person file and pivot by role:
role = P.PER_TYP.map({1: "driver", 2: "passenger", 5: "pedestrian", 6: "cyclist"}).fillna("other")
T = P.assign(role=role).pivot_table(index="YEAR", columns="role", values="ST_CASE", aggfunc="size")
T["total"] = T.sum(axis=1)
print(T.to_string())
print((T.loc[2023] / T.loc[2019] - 1).map("{:+.1%}".format).to_string())
role cyclist driver other passenger pedestrian total
YEAR
2017 800 23757 319 6522 6075 37473
2018 868 23045 272 6276 6374 36835
2019 856 22747 353 6127 6272 36355
2020 942 24860 319 6321 6565 39007
2021 971 27555 350 6884 7470 43230
2022 1096 26929 400 6703 7593 42721
2023 1163 25612 384 6499 7367 41025
role
cyclist +35.9%
driver +12.6%
other +8.8%
passenger +6.1%
pedestrian +17.5%
total +12.8%
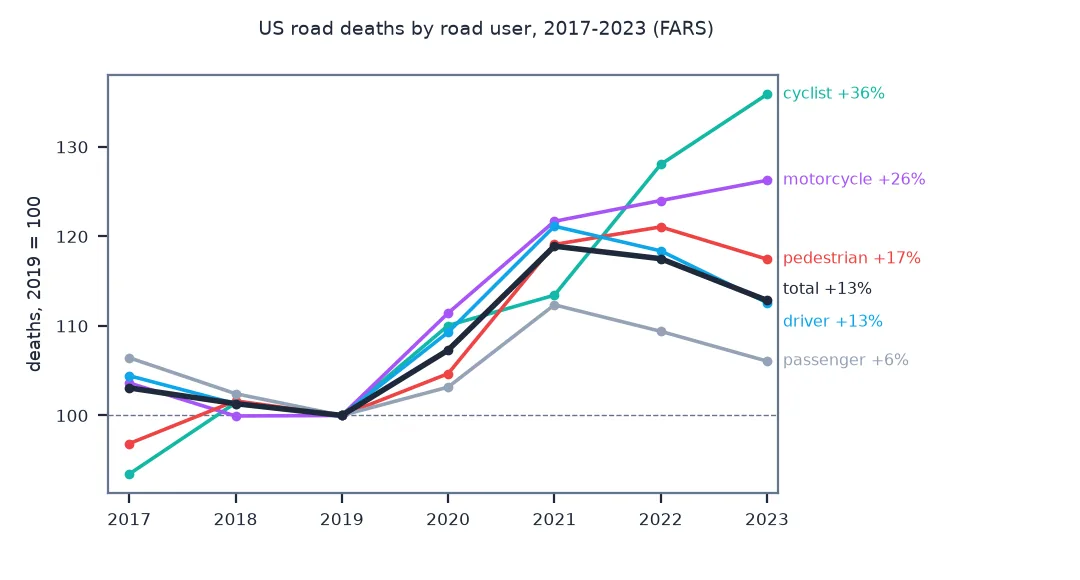
Deaths fell to 36,355 in 2019, then rose in 2020 and peaked at 43,230 in 2021. In 2023 they were 41,025, still 12.8% above 2019. Every group rose; cyclists most, by 35.9%, then pedestrians by 17.5% and drivers by 12.6%.
Consistent years, motorcyclists, change by state
1. Read several years consistently
The person file is person.csv or PERSON.CSV, sometimes in a folder inside the zip, and the 2021 and 2022 files begin with a byte-order mark; read only the columns needed and clean their names:
print(f"killed people read: {len(P):,} over {P.YEAR.nunique()} years")
print(P.groupby("YEAR").size().to_string())
killed people read: 276,646 over 7 years
YEAR
2017 37473
2018 36835
2019 36355
2020 39007
2021 43230
2022 42721
2023 41025
276,646 people killed in seven years, read from seven files with three naming conventions.
2. People on motorcycles
Motorcyclists are drivers and passengers whose vehicle body type is a motorcycle, codes 80–89:
moto = P[P.BODY_TYP.between(80, 89)].groupby("YEAR").size()
print(moto.to_string())
print(f"2019 to 2023: {moto[2023] / moto[2019] - 1:+.1%}; share of all deaths in 2023: {moto[2023] / T.loc[2023, 'total']:.1%}")
YEAR
2017 5228
2018 5042
2019 5045
2020 5622
2021 6139
2022 6256
2023 6370
2019 to 2023: +26.3%; share of all deaths in 2023: 15.5%
People killed on motorcycles rose from 5,045 in 2019 to 6,370 in 2023, 26.3% more, and were 15.5% of all road deaths.
3. Change by state
Compare 2023 with 2019 for each state, with the counts beside the percentages:
S = P[P.YEAR.isin([2019, 2023])].pivot_table(index="STATE", columns="YEAR", values="ST_CASE", aggfunc="size")
S["change"] = S[2023] / S[2019] - 1
S["state"] = NAMES.reindex(S.index).values
print(f"states with more deaths in 2023 than 2019: {(S.change > 0).sum()} of {len(S)}")
print(S.sort_values("change")[["state", 2019, 2023, "change"]].iloc[[0, 1, -2, -1]].round(3).to_string(index=False))
states with more deaths in 2023 than 2019: 44 of 51
state 2019 2023 change
Maine 157 135 -0.140
Hawaii 108 93 -0.139
Washington 538 809 0.504
District of Columbia 23 44 0.913
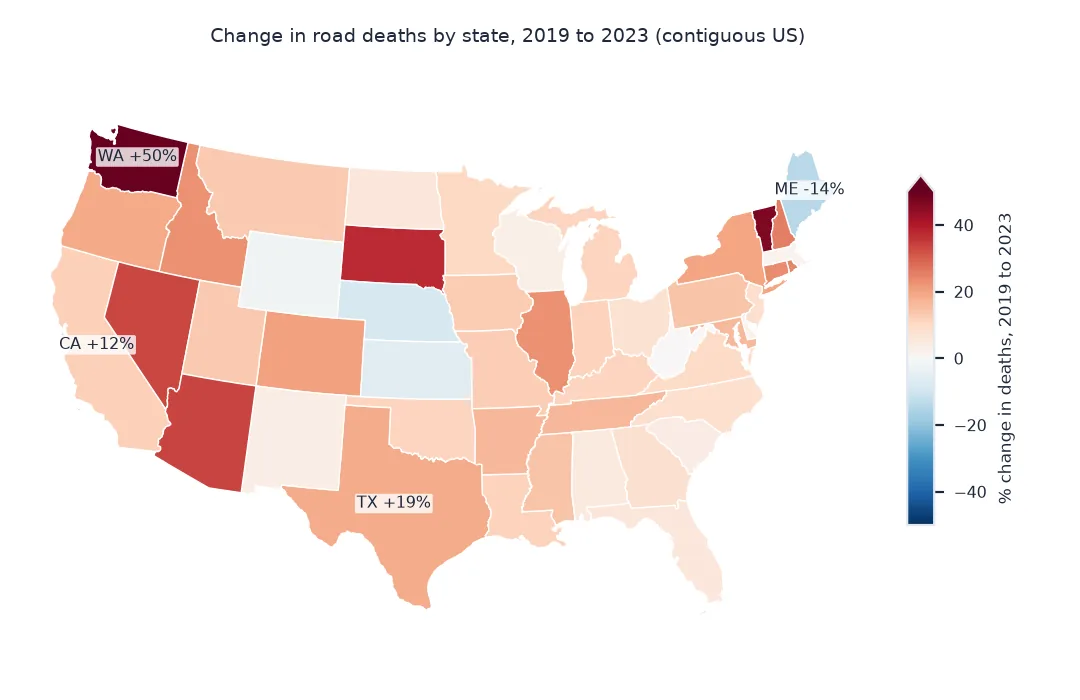
44 of the 51 states had more deaths in 2023 than in 2019. Washington State's rose by half, from 538 to 809; the District of Columbia's nearly doubled, from 23 to 44, a change of 21 deaths. Maine and Hawaii fell by 14%.
The peak and the decline
The data used on this page
NHTSA's FARS national CSV files for 2017 to 2023, person level, and the Census Bureau's 2023 state population estimates file for state names.
import zipfile
from pathlib import Path

import pandas as pd
import requests

Path("data").mkdir(exist_ok=True)
frames = []
for year in range(2017, 2024):
    f = Path(f"data/FARS{year}NationalCSV.zip")
    if not f.exists():
        f.write_bytes(requests.get(f"https://static.nhtsa.gov/nhtsa/downloads/FARS/{year}/National/FARS{year}NationalCSV.zip", timeout=600).content)
    z = zipfile.ZipFile(f)
    clean = lambda c: c.replace("", "").upper()
    p = pd.read_csv(z.open(next(n for n in z.namelist() if n.lower().endswith("person.csv"))), encoding="latin1", low_memory=False,
                    usecols=lambda c: clean(c) in {"STATE", "ST_CASE", "PER_TYP", "INJ_SEV", "BODY_TYP"}).rename(columns=clean)
    frames.append(p[p.INJ_SEV == 4].assign(YEAR=year))
P = pd.concat(frames, ignore_index=True)
N = Path("data/NST-EST2023-ALLDATA.csv")
if not N.exists():
    N.write_bytes(requests.get("https://www2.census.gov/programs-surveys/popest/datasets/2020-2023/state/totals/NST-EST2023-ALLDATA.csv", timeout=300).content)
NAMES = pd.read_csv(N).query("SUMLEV == 40").set_index("STATE").NAME
print(f"{len(P):,} people killed, {P.YEAR.min()}-{P.YEAR.max()}")
276,646 people killed, 2017-2023
Example 1: the peak and the decline
Find each group's peak year and how far it has come down since:
groups = pd.concat([T[["driver", "passenger", "pedestrian", "cyclist", "total"]], moto.rename("motorcycle")], axis=1)
summary = pd.DataFrame({"peak year": groups.idxmax(), "peak": groups.max(), "2023": groups.loc[2023]})
summary["2023 vs peak"] = (summary["2023"] / summary.peak - 1).map("{:+.1%}".format)
print(summary.to_string())
peak year peak 2023 2023 vs peak
driver 2021 27555 25612 -7.1%
passenger 2021 6884 6499 -5.6%
pedestrian 2022 7593 7367 -3.0%
cyclist 2023 1163 1163 +0.0%
total 2021 43230 41025 -5.1%
motorcycle 2023 6370 6370 +0.0%
Driver deaths are 7.1% below their 2021 peak and pedestrian deaths 3.0% below their 2022 peak, but cyclist and motorcycle deaths reached their highest level of the period in 2023.
A national trend is a sum of trends
A national trend in road deaths is a sum of several trends with different causes. Driver deaths respond to how much and how fast people drive, to seat-belt use and to impairment; pedestrian and cyclist deaths respond to how many people walk and cycle, to vehicle size and design, and to street design; motorcycle deaths follow riding and helmet use. Splitting by road user, as here, shows which parts moved and whether they moved together.
The years after 2019 show all of them rising at once, then diverging. Total deaths peaked in 2021 and fell in 2022 and 2023, driven by fewer driver deaths, while cyclist deaths kept rising to 2023 and motorcycle deaths did too. A total that is "coming down" can therefore hide groups that are not. Counts are also not rates: travel fell in 2020 and recovered afterwards, so deaths per mile rose more steeply in 2020 than deaths did; the VMT tables give that denominator year by year.
Release versions and body types
- Release versions: the most recent year is often an annual report file, revised in the final release; compare final files where possible.
- Person types: codes 3 and 4 are occupants of vehicles not in transport and unknown occupants; they are in "other" here.
- Motorcycle body types: 80–89 covers motorcycles, mopeds and other two- and three-wheeled motor vehicles; FARS's manual lists them.
- State counts: small states' year-to-year changes are mostly noise; pool years before ranking.
- Puerto Rico: not in the national files.
Internal links
- How to map fatal road crashes in the US with FARS in Python — the FARS files
- How to calculate road death rates per vehicle mile in Python — rates per mile driven
- How to analyse pedestrian deaths with FARS in Python — pedestrians in detail
FAQ
How have US road deaths changed since 2019?
From FARS: 36,355 deaths in 2019, a peak of 43,230 in 2021, and 41,025 in 2023, still 12.8% above 2019.
Which road users saw the largest increase?
Cyclists: deaths rose 35.9% from 2019 to 2023, against 17.5% for pedestrians and 12.6% for drivers.
How do I combine several years of FARS in Python?
Loop over the yearly zips, find the person or accident file by name regardless of case and folder, clean the column names, and concatenate with a year column.
Are road deaths going down?
Overall, from the 2021 peak; but cyclist and motorcycle deaths were still rising in 2023.