
How to Map UK Road Collisions from STATS19 in Python
On this page
Problem statement
STATS19 is the record of every road collision in Great Britain in which someone was injured and the police were told: about 100,000 collisions a year, each with a location, a severity, and the road and conditions. The Department for Transport publishes it as yearly CSV files of collisions, vehicles and casualties. It is one of the richest open crash datasets anywhere, and it has two features that catch analysts out: coordinates come in two systems, and the severity of injuries is recorded differently by different police forces, so the raw count of serious collisions cannot be compared across forces or years without the DfT's adjustment.
This page downloads the 2023 collision file, maps the collisions in British National Grid coordinates, counts them by severity, applies the severity adjustment, and compares police forces that do and do not use injury-based reporting.
Quick answer
Read the collision CSV, count by severity, and use the adjusted severity columns for serious injuries:
C = pd.read_csv("data/dft-road-casualty-statistics-collision-2023.csv", low_memory=False)
sev = C.collision_severity.map({1: "fatal", 2: "serious", 3: "slight"}).value_counts()
print(f"{len(C):,} collisions, {C.number_of_casualties.sum():,} casualties in 2023")
print(sev.to_string())
print(f"serious, as recorded: {sev['serious']:,}; adjusted: {C.collision_adjusted_severity_serious.sum():,.0f}")
104,258 collisions, 132,977 casualties in 2023
collision_severity
slight 79298
serious 23438
fatal 1522
serious, as recorded: 23,438; adjusted: 24,644
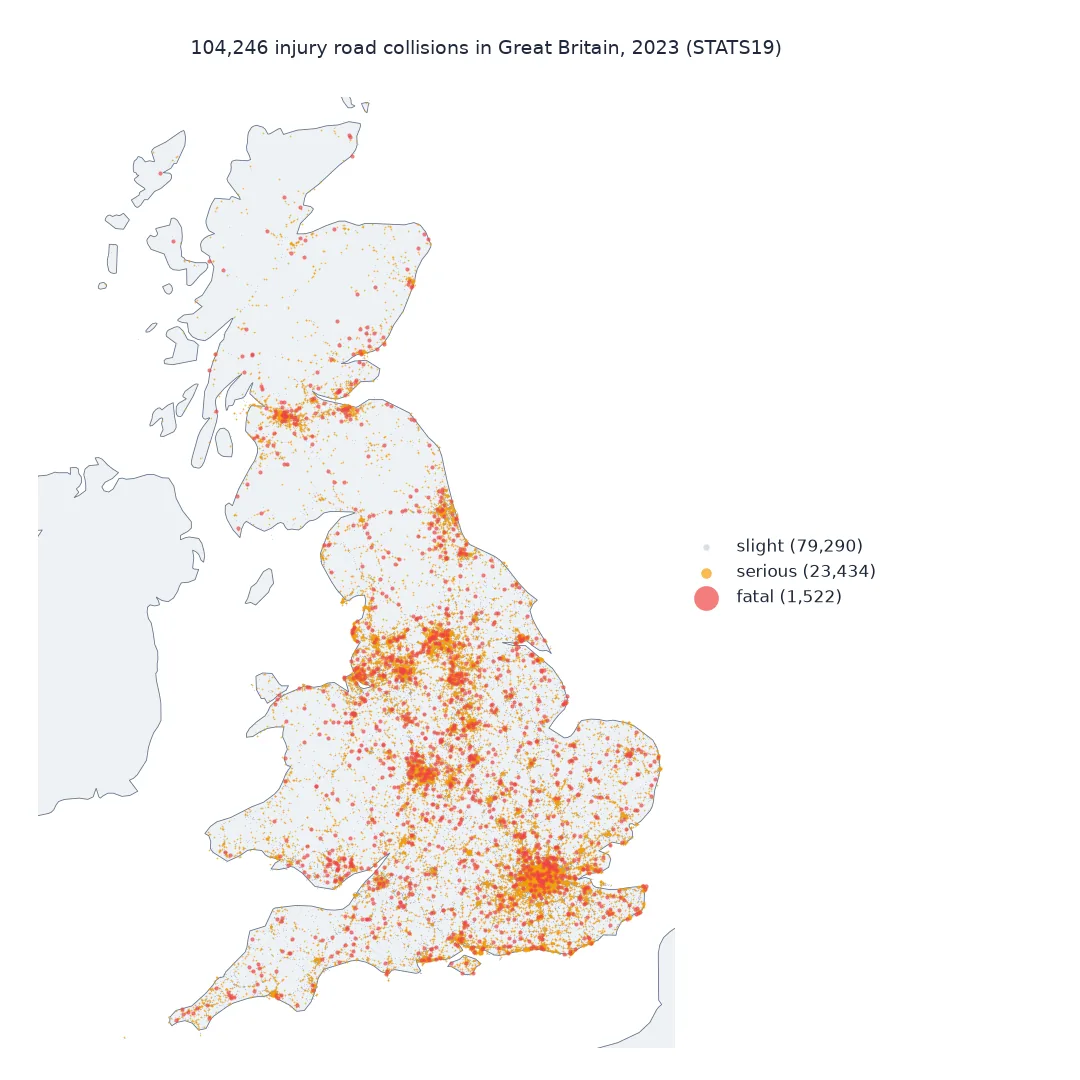
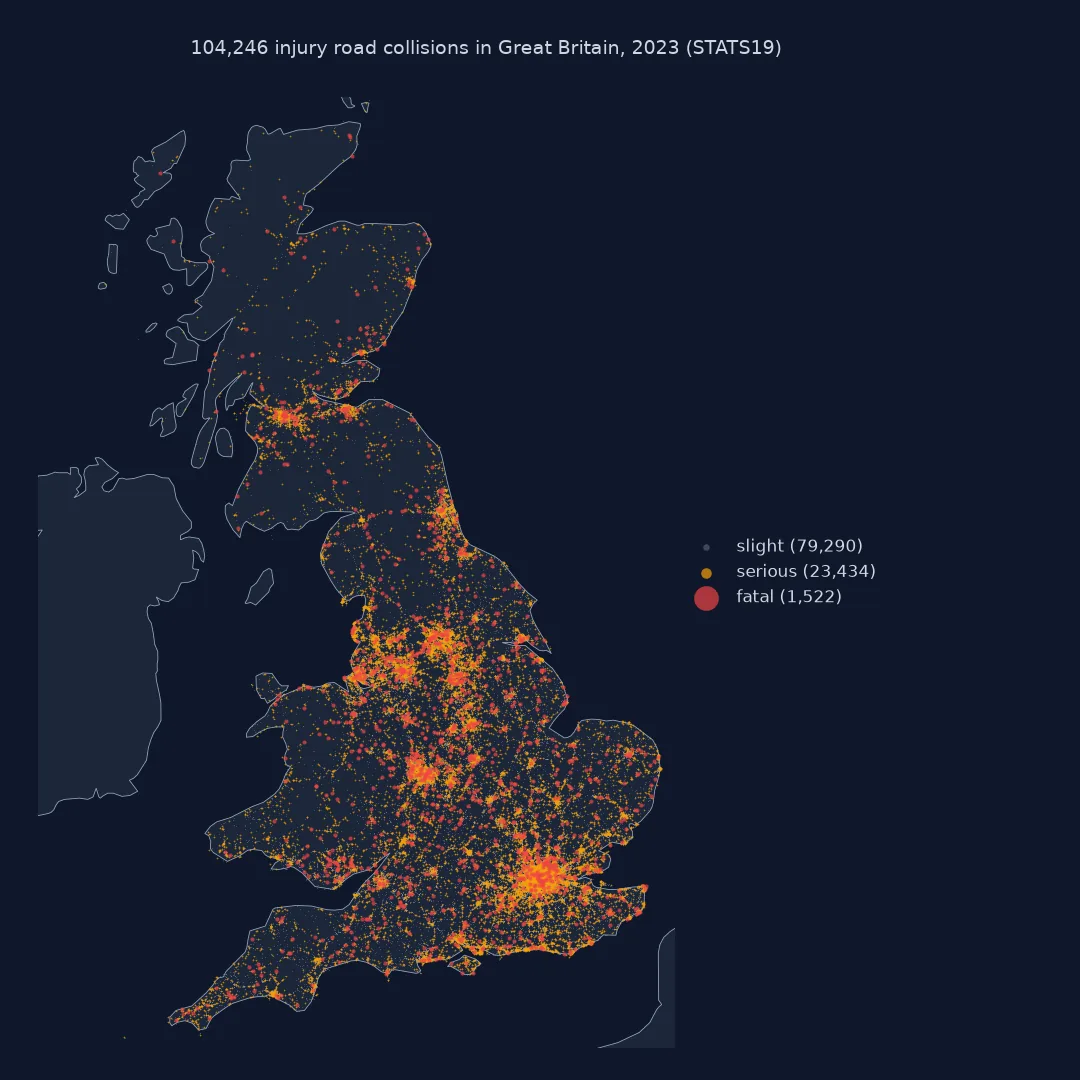
Great Britain's police recorded 104,258 injury collisions in 2023, with 132,977 casualties: 1,522 fatal collisions, 23,438 serious and 79,298 slight. Adjusted for reporting method, the serious count is 24,644, 5% higher.
A coordinate system, the severity adjustment, adjusted comparisons
1. Choose a coordinate system
Each collision has an easting and northing on the British National Grid (EPSG:27700), and a longitude and latitude derived from them. The grid coordinates are the original; plot in metres, and check what is missing:
missing = C.location_easting_osgr.isna() | C.location_northing_osgr.isna()
print(f"collisions without grid coordinates: {missing.sum()}; without latitude: {C.latitude.isna().sum()}")
G = gpd.GeoDataFrame(C[~missing], geometry=gpd.points_from_xy(C.location_easting_osgr[~missing], C.location_northing_osgr[~missing]), crs=27700)
check = G.to_crs(4326)
d = np.hypot(check.geometry.x - G.longitude, check.geometry.y - G.latitude)
print(f"largest difference between reprojected grid point and published lat/lon: {d.max() * 111000:.1f} m")
collisions without grid coordinates: 12; without latitude: 12
largest difference between reprojected grid point and published lat/lon: 0.3 m
Only 12 collisions lack a location, and the published latitude and longitude agree with the reprojected grid coordinates to within 0.3 metres, so either can be used; metres are easier for distances and densities.
2. Understand the severity adjustment
Since 2012 an increasing number of police forces record injuries with an injury-based system, CRASH, in which the officer records the injury and the system assigns the severity. Officers' own judgement, used elsewhere, classifies fewer injuries as serious. The DfT publishes, for every collision, the probability that it would have been serious under injury-based reporting:
by = C.groupby("collision_injury_based").agg(collisions=("collision_index", "size"),
                                            serious_recorded=("collision_severity", lambda s: (s == 2).sum()),
                                            serious_adjusted=("collision_adjusted_severity_serious", "sum"))
by.index = by.index.map({0: "officer judgement", 1: "injury-based"})
by["adjustment"] = by.serious_adjusted / by.serious_recorded - 1
print(by.round(3).to_string())
collisions serious_recorded serious_adjusted adjustment
collision_injury_based
officer judgement 48241 8685 9891.024 0.139
injury-based 56017 14753 14753.000 0.000
54% of collisions come from forces using injury-based reporting, and their adjustment is zero by construction. For the 48,241 collisions recorded by officer judgement, the adjusted serious count is 13.9% higher than the recorded one.
3. Compare places with the adjusted figures
Killed or seriously injured (KSI) collisions are the usual headline measure. By police force, with the adjusted serious count:
C["ksi_recorded"] = C.collision_severity.isin([1, 2])
C["ksi_adjusted"] = (C.collision_severity == 1) + C.collision_adjusted_severity_serious
F = C.groupby("police_force").agg(collisions=("collision_index", "size"), ksi_recorded=("ksi_recorded", "sum"),
                                  ksi_adjusted=("ksi_adjusted", "sum"), injury_based=("collision_injury_based", "mean"))
F["share_recorded"], F["share_adjusted"] = F.ksi_recorded / F.collisions, F.ksi_adjusted / F.collisions
lad = C.groupby("police_force").local_authority_ons_district.agg(lambda v: v.mode()[0])   # each force's commonest local authority
F["force"] = lad.map(PFA).where(~lad.str.startswith("S"), "Police Scotland")
rho = F.share_recorded.corr(F.share_adjusted, method="spearman")
print(f"{len(F)} police forces; rank correlation of recorded and adjusted KSI share: {rho:.2f}")
print(F.sort_values("share_adjusted", ascending=False)[["force", "collisions", "share_recorded", "share_adjusted", "injury_based"]].head(5).round(3).to_string(index=False))
44 police forces; rank correlation of recorded and adjusted KSI share: 0.82
force collisions share_recorded share_adjusted injury_based
Police Scotland 4232 0.434 0.434 1.000
Gwent 502 0.347 0.418 0.000
Dyfed-Powys 1021 0.379 0.407 0.693
North Wales 777 0.315 0.403 0.000
Durham 571 0.375 0.375 1.000
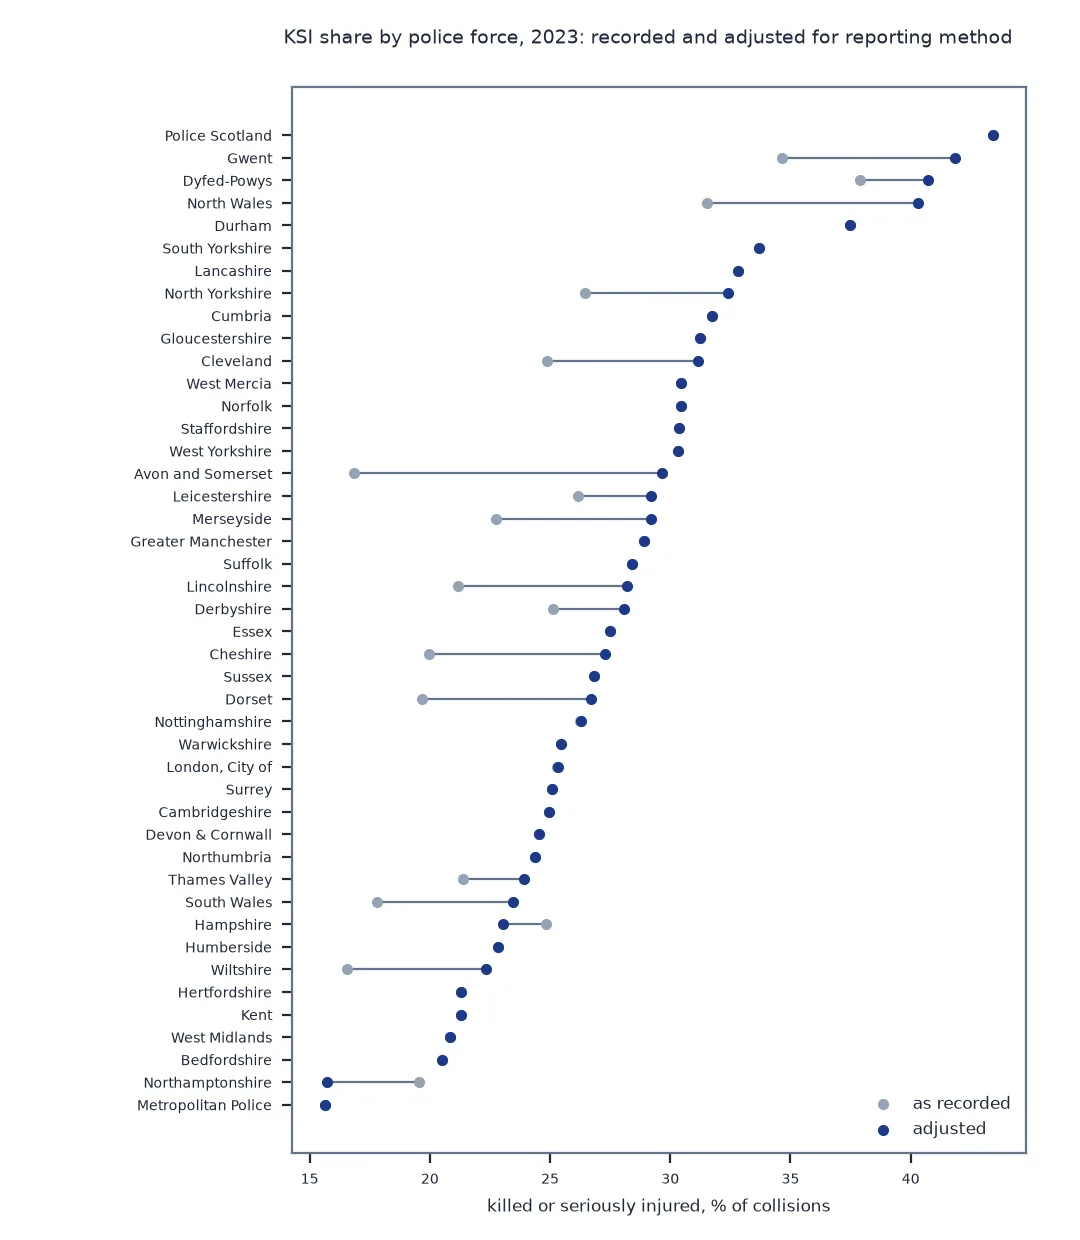
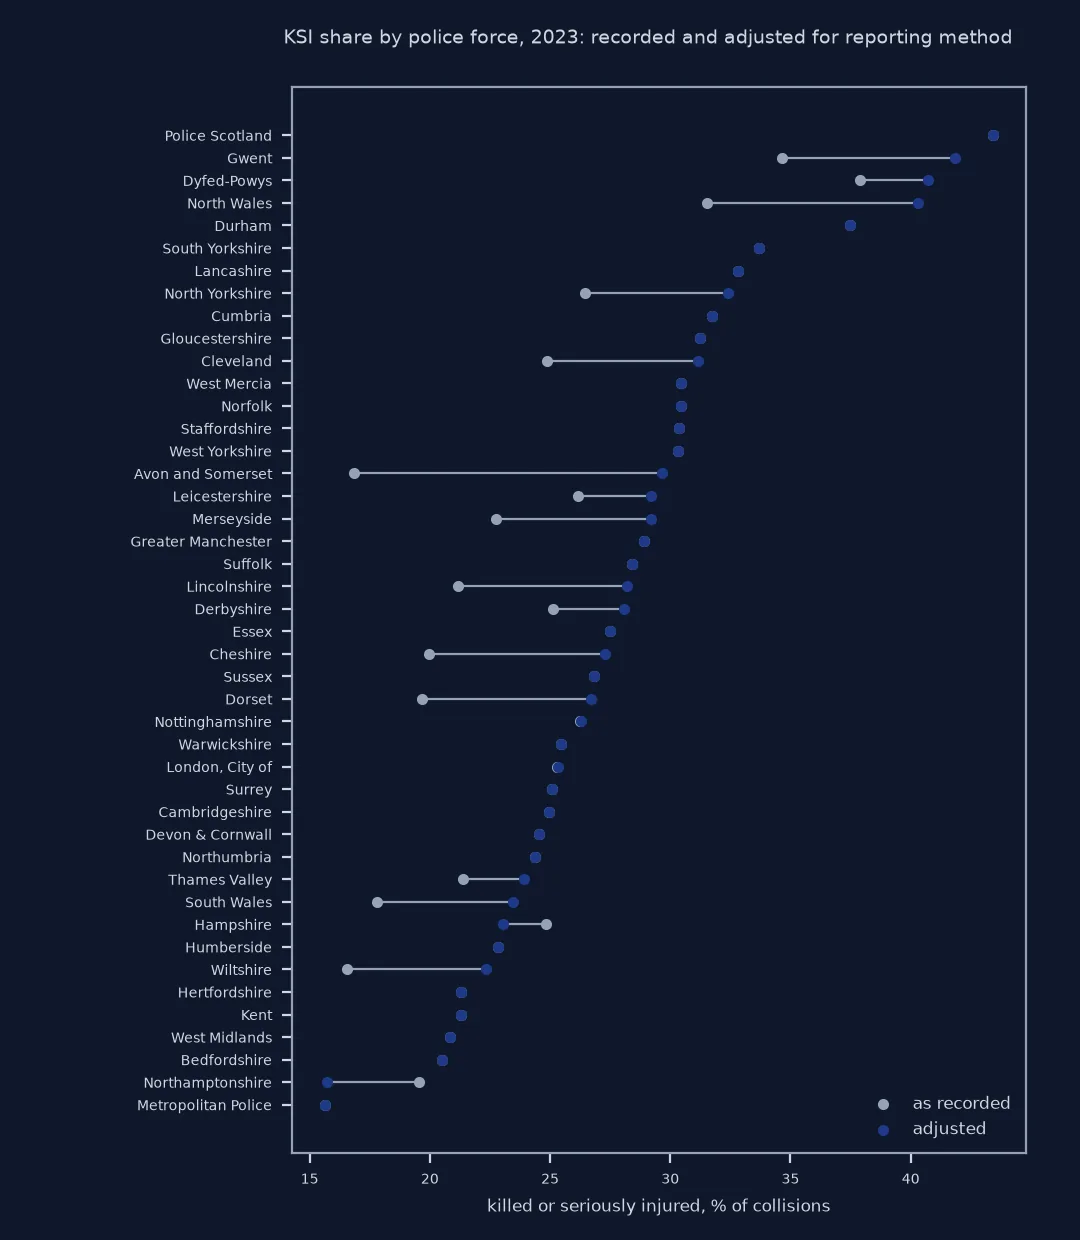
Adjustment changes the ranking of forces, a rank correlation of 0.82 between recorded and adjusted KSI shares. Gwent and North Wales, which record by officer judgement, move from 34.7% and 31.5% to 41.8% and 40.3%, close to Police Scotland's 43.4%; a comparison of raw shares would have understated them by a fifth.
Severity by speed limit
The data used on this page
The Department for Transport's road safety open data, the 2023 collision file (dft-road-casualty-statistics-collision-2023.csv), which covers Great Britain; the ONS local authority to police force area lookup for December 2023, England and Wales, to name the forces; and Natural Earth's 1:50m land polygons for the coastline.
from pathlib import Path

import geopandas as gpd
import numpy as np
import pandas as pd
import requests

Path("data").mkdir(exist_ok=True)
SRC = {"dft-road-casualty-statistics-collision-2023.csv": "https://data.dft.gov.uk/road-accidents-safety-data/dft-road-casualty-statistics-collision-2023.csv",
       "ne_50m_land.zip": "https://naciscdn.org/naturalearth/50m/physical/ne_50m_land.zip"}
for name, url in SRC.items():
    if not Path("data", name).exists():
        Path("data", name).write_bytes(requests.get(url, timeout=600).content)
LU = Path("data/lad23_pfa23_lookup.csv")
if not LU.exists():                                                    # ONS lookup: local authority to police force area, England and Wales
    url = "https://services1.arcgis.com/ESMARspQHYMw9BZ9/arcgis/rest/services/LAD23_CSP23_PFA23_EW_LU/FeatureServer/0/query"
    rows, offset = [], 0
    while True:
        d = requests.get(url, timeout=120, params={"where": "1=1", "outFields": "LAD23CD,PFA23NM", "f": "json", "resultOffset": offset}).json()
        rows += [f["attributes"] for f in d["features"]]; offset += len(d["features"])
        if not d.get("exceededTransferLimit"):
            break
    pd.DataFrame(rows).to_csv(LU, index=False)
PFA = pd.read_csv(LU).drop_duplicates("LAD23CD").set_index("LAD23CD").PFA23NM     # one row per authority and safety partnership
print(f"collision file: {Path('data/dft-road-casualty-statistics-collision-2023.csv').stat().st_size / 1e6:.1f} MB; {len(PFA)} local authorities in the force lookup")
collision file: 19.8 MB; 318 local authorities in the force lookup
Example 1: severity by speed limit
The share of collisions that killed someone rises steeply with the speed limit of the road:
S = C[C.speed_limit.isin([20, 30, 40, 50, 60, 70])].groupby("speed_limit").agg(
    collisions=("collision_index", "size"), fatal=("collision_severity", lambda s: (s == 1).mean()),
    ksi_adjusted=("ksi_adjusted", "mean"))
print(S.round(4).to_string())
collisions fatal ksi_adjusted
speed_limit
20 17942 0.0047 0.1915
30 54177 0.0084 0.2367
40 9154 0.0187 0.2735
50 4593 0.0294 0.3008
60 12729 0.0387 0.3628
70 5663 0.0321 0.2477
A collision on a 60 mph road is eight times as likely to be fatal as one on a 20 mph road, 3.9% against 0.5%. 70 mph roads, mostly motorways and dual carriageways, are slightly less deadly per collision than 60 mph ones, at 3.2%.
What STATS19 does and does not record
STATS19 records collisions that police attend or are told about, in which at least one person was injured. It is not a record of all collisions: damage-only crashes are not included, and research linking hospital and police records has long found that many injury collisions, especially those involving cyclists, never reach the police. Within its scope it is detailed and consistent, with the same variables across all forces and decades of history.
The severity adjustment exists because the scope stayed the same while the measurement changed. When a force moves to injury-based reporting, more of its casualties are classified as seriously injured, with no change in what happened on the road. The DfT estimated, from forces that switched, how likely each collision recorded by officer judgement would have been to count as serious, and publishes those probabilities with the data. Summing them gives an adjusted count comparable across forces and over time; the raw count is not.
Codes, linked files and the 30-day rule
- Codes, not labels: the CSV has numeric codes, and -1 means missing; the DfT's data guide spreadsheet maps them to labels, but its link was broken when this page was written, so the forces here are named through the ONS lookup.
- Collisions, vehicles, casualties: three files share
collision_index; counting casualties needs the casualty file ornumber_of_casualties. - Northern Ireland: STATS19 covers Great Britain; Northern Ireland's police publish separately.
- Provisional years: the latest year's file is provisional and revised the following year.
- Fatal means within 30 days: as in FARS, a casualty is counted as killed if they died within 30 days.
Internal links
- How to map fatal road crashes in the US with FARS in Python — the US census of fatal crashes
- How to calculate age-adjusted death rates in Python — adjusting for a change in measurement of a different kind
FAQ
How do I download STATS19 data in Python?
Download the yearly CSVs from data.dft.gov.uk/road-accidents-safety-data/, for example dft-road-casualty-statistics-collision-2023.csv, and read them with pandas.
How many road collisions were there in Great Britain in 2023?
The 2023 collision file has 104,258 injury collisions reported to the police, 1,522 of them fatal.
What is the STATS19 severity adjustment?
A probability, published for each collision, that it would have been classified as serious under injury-based reporting; summing it gives serious counts comparable across police forces and years.
What is KSI in road safety?
Killed or seriously injured: the number of casualties, or collisions, in the two most severe categories, the usual headline measure in Great Britain.